PT_MA_GAIN_VisualiserThis indicator is designed for use with Profit Trailer's GAIN strategies.
The user can select either EMA or SMA averages and input their own buy value settings.
It incorporates trailing values, either manual trailing values or automatically calculated values based on volatility.
Cerca negli script per "profit"

PT_maSpreadThis indicator is designed for use with Profit Trailer's SPREAD strategies.
The user can select either EMA or SMA averages and input their own buy value settings.
It incorporates trailing values, either manual trailing values or automatically calculated values based on volatility.

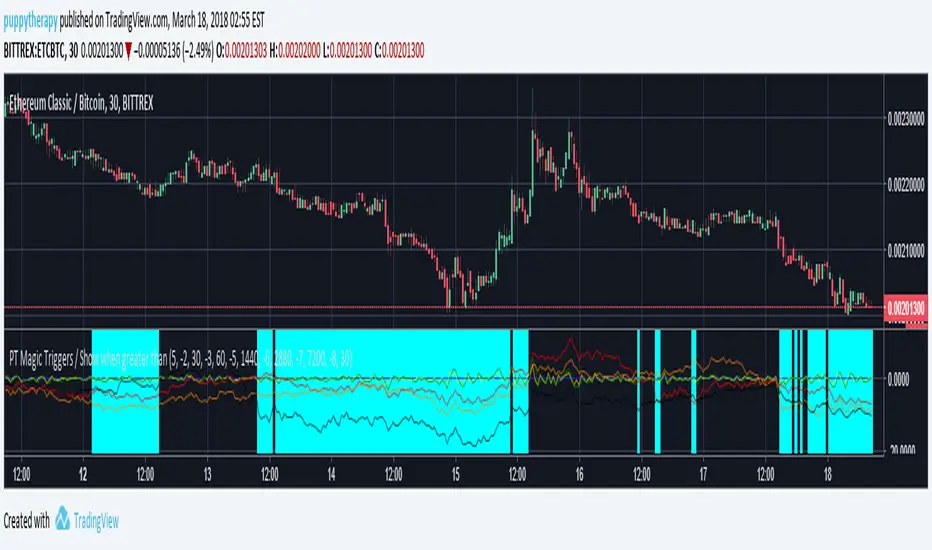
PT Magic Triggers - When smaller than Trend Value ( SOM )PTM Script for Profit trailer if you dont know what it is dont read :)
I just wanted to roll this out ASAP there will be no detailed description.
If the value is smaller then your defined Trend value it will make the background aqua.( Basically you want to be defensive in those areas ) Multiple logical conditions OR /AND combined are beeing worked on.
If questions i will try to answer them here in hour build factory discord.
discord.gg
HighLowPricePercentage of ProfitTrailer Feeder offset criteriaThis is to check the distance/difference of the current price from the norm and is over the MinutesToMeasureTrend time window or LongTermMinutesToMeasureTrend.
You need to put the values in your appsetting and time interval of candle chart.
Default is 120 minute of MinutesToMeasureTrend value and 720 minute of LongTermMinutesToMeasureTrend value on 5 minute candle chart.
This script is to help myself understand the criteria of Feeder.
Any comments and suggestions are welcome.

Low EMA of EMAgain over the chart for ProfitTrailerThis script prints low EMA line over the chart.
Buy value and time frame numbers can be modified in format.
Basically this is same with previous scripts of mine.
Though this does not show the spread between the price and low EMA line (EMAgain) and buy value, you can see the buy trailing signal.
If you set buy value positive for gain starategy, the buy trailing will start from the time point indicated by "▲".
If you set buy value negative for gain starategy, the buy trailing will start from the time point indicated by "▼".
This script is to help myself understand the buy strategies of ProfitTrailer.
Any comments and suggestions are welcome.

EMAgainEMAgain in ProfitTrailer is the strategy using the spread difference between the price and combination of fast EMA and slow EMA .
Buy value and time frame numbers are from popular setting, which can be modified in format.
If you set buy value positive for gain starategy, it is mostly between the price and slow EMA except one or two candle right after cross (sometimes three candles). In the time point indicated by "▲", the trailing for buy will start.
If you set buy value negative for gain starategy, it is mostly between the price and fast EMA except one or two candle right after cross (sometimes three candles). In the time point indicated by "▼", the trailing for buy will start.
This script is to help myself understand the buy strategies of ProfitTrailer.
Any comments and suggestions are welcome.

SMAgainSMAgain in ProfitTrailer is the strategy using the spread difference between the price and combination of fast SMA and slow SMA.
Buy value and time frame numbers are from popular setting, which can be modified in format.
If you set buy value positive for gain starategy, it is mostly between the price and slow SMA except one or two candle right after cross (sometimes three candles). In the time point indicated by "▲", the trailing for buy will start.
If you set buy value negative for gain starategy, it is mostly between the price and fast SMA except one or two candle right after cross (sometimes three candles). In the time point indicated by "▼", the trailing for buy will start.
This script is to help myself understand the buy strategies of ProfitTrailer.
Any comments and suggestions are welcome.

SMAgain vs EMAgain for ProfitTrailerSMAgain or EMAgain in ProfitTrailer is the strategy using the spread difference between the price and combination of fast MA and slow MA.
Time frame numbers are from popular settings.
If you have positive buy value for gain starategy, it is mostly between the price and slow MA except one or two candle right after cross (sometimes three candles).
If you have negative buy value for gain starategy, it is mostly between the price and fast MA except one or two candle right after cross (sometimes three candles).
This script is to help myself understand the buy strategies of ProfitTrailer.
Any comments and suggestions are welcome.

AuditLens - Profit Quality Analyzer📊 AuditLens - Profit Quality Analyzer
Ever wonder if a company's profits are real or just accounting tricks?
This indicator helps you spot potential earnings manipulation by analyzing the gap between reported profits and actual cash generation.
━━━━━━━━━━━━━━━━━━━━━━━━
🔍 WHAT IT DOES
━━━━━━━━━━━━━━━━━━━━━━━━
Calculates the "Divergence Ratio":
(Net Income - Operating Cash Flow) / Total Assets
• Positive divergence = Profits NOT backed by cash (risky)
• Negative divergence = Cash exceeds profits (healthy "cash cow")
━━━━━━━━━━━━━━━━━━━━━━━━
🚦 SIGNAL GUIDE
━━━━━━━━━━━━━━━━━━━━━━━━
🔴 RED FLAG (>10%): High risk - possible aggressive revenue recognition
🟠 ORANGE: Divergence trending up for 3+ quarters
🟡 YELLOW: Divergence trending up for 2+ quarters
🟢 GREEN (<-5%): "Cash Cow" - strong cash generation
✅ HEALTHY (0 to -5%): Normal profit quality
━━━━━━━━━━━━━━━━━━━━━━━━
📈 HOW TO USE
━━━━━━━━━━━━━━━━━━━━━━━━
1. Add to any stock chart
2. Check the summary table (top right)
3. Look for RED FLAGS before buying
4. Prefer stocks with negative divergence (cash cows)
━━━━━━━━━━━━━━━━━━━━━━━━
⚠️ FAMOUS EXAMPLES
━━━━━━━━━━━━━━━━━━━━━━━━
• Enron (2001): Showed profits but burned cash → Bankruptcy
• Wirecard (2020): €1.9B "cash" that didn't exist → Fraud
• Luckin Coffee (2020): Fake revenue, no cash backing → Delisted
This indicator would have flagged all of them.
━━━━━━━━━━━━━━━━━━━━━━━━
🔗 FULL VERSION
━━━━━━━━━━━━━━━━━━━━━━━━
Want more detailed analysis with:
• 6 advanced audit rules
• Historical trend analysis
• Receivables & Inventory checks
• Detailed reports for any stock
👉 Try the full version FREE: auditlens-check.netlify.app
━━━━━━━━━━━━━━━━━━━━━━━━
📚 THE LOGIC
━━━━━━━━━━━━━━━━━━━━━━━━
Based on forensic accounting principles:
- Companies can manipulate earnings (accruals)
- But cash flow is harder to fake
- Big gap between the two = potential red flag
This is NOT financial advice. Always do your own research.
━━━━━━━━━━━━━━━━━━━━━━━━
Built by AuditLens team 🔍
Questions? DM or comment below.

Put Option Profits inspired by Travis Wilkerson; SPX BacktesterPut Option Profits — Travis Wilkerson inspired. This tester evaluates a simple monthly SPX at-the-money credit-spread timing idea: enter on a fixed calendar rule (e.g., 1st Friday or 8th day with business-day shifting) at Open or Close, then exit exactly N calendar days later (first tradable day >= target, at Close). A trade is marked WIN if price at exit is above the entry price (1:1 risk proxy).
The book suggests forward testing 60-day and 180-day expirations to prove the concept. This tool lets you backtest both (and more) to see what actually works best. In the book, profits are taken when the spread reaches ~80% of max credit; losers are left to expire and cash-settle. This backtester does not model early profit-taking—every trade is held to the configured hold period and evaluated on price vs entry at the exit close. Think of it as a pure “set it and forget it” stress test. In live trading, you can still follow Travis’s 80% take-profit rule; TradingView just doesn’t simulate that here. Happy trading!
Features:
Schedule: Day-of-Month (with Prev/Next business-day shift, optional “stay in month”) or Nth Weekday (e.g., 1st Friday).
Entry timing: Open or Close.
Exit: N calendar days later at Close (holiday/weekend aware).
Filters: Optional EMA-200 “risk-on” filter.
Scope: Date range limiter.
Visuals: Entry/exit bubbles (paired colors) or simple win/loss dots.
Table: Overall Win% and N (within range).
Alerts: Entry alert (static condition + dynamic alert() message).
How to use:
[* ]Choose Start Mode (NthWeekday or DayOfMonth) and parameters (e.g., 1st Friday or DOM=8, PrevBizDay).
Pick Entry Timing (Open or Close).
Set Days In Trade (e.g., 150).
(Optional) Enable EMA filter and set Date Range.
Turn Bubbles on/off and/or Dots on/off.
Create alert:
Simple ping: Condition = this indicator -> Monthly Entry Signal -> “Once per bar” (Open) or “Once per bar close” (Close).
Rich message: Condition = this indicator -> Any alert() function call.
Notes:
Keep DOM shift in same month: when a DOM falls on a weekend/holiday, PrevBizDay/NextBizDay shift will stay inside the month if enabled; otherwise it can spill into the prior/next month. (Ignored for NthWeekday.)
Credits: Concept sparked by “Put Option Profits – How to turn ten minutes of free time into consistent cash flow each month” by Travis Wilkerson; this script is a neutral research tool (not financial advice).

Indicator: Profitability by Day & Hour (stacked, non-overlay)What it does
This tool performs a simple seasonality study on the selected symbol. It measures historical returns and summarizes them in two horizontal heatmaps:
Hours table (top) — Columns 00–23 show the average return of each clock hour, plus sample size, win rate, volatility (SD), and a t-score.
Days table (middle) — Columns 1–7 correspond to Mon–Sun with the same metrics.
Summary (bottom) — Shows the most profitable day and hour in the history loaded on your chart.
Green cells indicate higher average returns; red cells indicate lower/negative averages. The layout is centered on the screen, with the hours table above the days table for quick scanning.
How it works (methodology)
Returns: by default the indicator uses log returns ln(Ct/Ct-1) (you can switch to simple % if you prefer).
Daily aggregation (no look-ahead): day statistics are computed from completed daily closes via a higher timeframe request. Yesterday’s daily close vs. the prior day is added to the appropriate weekday bucket, preventing repaint/forward bias.
Hourly aggregation (intraday only): hour statistics are computed bar-to-bar on the current intraday timeframe and accumulated by clock hour (00–23) of the symbol’s exchange timezone.
Metrics per bucket:
Mean: average return in that bucket.
n: number of observations.
Win%: share of positive returns.
SD: standard deviation of returns (volatility proxy).
t-score: mean / SD * sqrt(n) — a quick stability signal (not a hypothesis test).
The indicator does not rely on future data and does not repaint past values.
Reading the tables
Start with the Mean row in each table: it’s color-mapped (red → yellow → green).
Check n (sample size). A bright green cell with very low n is less meaningful than a mild green cell with large n.
Use Win% and SD to judge consistency and noise.
t-score is a compact “signal-to-noise × sample size” measure; higher absolute values suggest more stable effects.
Typical observations traders look for (purely illustrative): for some equity indices, the first hour after the cash open can dominate; for FX/crypto, certain late-US or early-Asia hours sometimes stand out. Always verify on your symbol and timeframe.

Custom Ichimoku Cloud with Signals📊 OVERVIEW
This indicator generates trading signals based on Ichimoku Cloud breakouts and breakdowns. It identifies when price decisively moves through the cloud boundaries, filtering out false signals from consolidation periods.
📈 KEY FEATURES
- Transition-based signals only when price breaks through cloud
- Candle body must completely clear cloud (no touching)
- Alternating signal system prevents consecutive duplicate signals
- Built-in alerts for automated notifications
- Standard Ichimoku components included
⚙️ HOW IT WORKS
BUY SIGNAL: Triggered when candle body moves completely above cloud after being inside/below
SELL SIGNAL: Triggered when candle body moves completely below cloud after being inside/above
🎯 USE CASES
- Trend continuation trading
- Breakout trading strategies
- Cloud support/resistance analysis
- Multi-timeframe analysis
📝 PARAMETERS
- Adjustable Ichimoku periods (Conversion, Base, Lagging Span B)
- Customizable lookback period for transition detection
- Visual signal markers with alerts
⚠️ DISCLAIMER
This indicator is for educational purposes. Past performance doesn't guarantee future results. Always use proper risk management and combine with other analysis methods.
⚠️ DISCLAIMER & RISK WARNING
This indicator is provided for informational and educational purposes only and should not be considered as financial advice.
TRADING RISKS:
- Trading involves substantial risk of loss and is not suitable for all investors
- Past performance is not indicative of future results
- You can lose more than your initial investment
- Never trade with money you cannot afford to lose
NO GUARANTEES:
- This indicator does not guarantee profits or predict market movements with certainty
- Signals are based on mathematical calculations and may produce false signals
- Market conditions can change, making any strategy ineffective
- Success depends on multiple factors beyond this indicator
USER RESPONSIBILITY:
- You are solely responsible for your trading decisions
- Always conduct your own research and analysis
- Consider consulting with a qualified financial advisor
- Use proper risk management and position sizing
- Test thoroughly on demo accounts before live trading
TECHNICAL LIMITATIONS:
- Indicator may be subject to repainting in real-time conditions
- Historical results do not represent actual trading
- Signals are for analysis only, not automatic trade execution
- Performance varies across different timeframes and instruments
By using this indicator, you acknowledge that you understand these risks and accept full responsibility for your trading outcomes. The author assumes no liability for any losses incurred.
NOT FINANCIAL ADVICE - FOR EDUCATIONAL PURPOSES ONLY

EPS+Sales+Net Profit+MCap+Sector & Industry📄 Full Description
This script displays a comprehensive financial data panel directly on your TradingView chart, helping long-term investors and swing traders make informed decisions based on fundamental trends. It consolidates key financial metrics and business classification data into a single, visually clear table.
🔍 Key Features:
🧾 Financial Metrics (Auto-Fetched via request.financial):
EPS (Earnings Per Share) – Displayed with trend direction (QoQ or YoY).
Sales / Revenue – In ₹ Crores (for Indian stocks), trend change also included.
Net Profit – Also in ₹ Crores, along with percentage change.
Market Cap – Automatically calculated using outstanding shares × price, shown in ₹ Cr.
Free Float Market Cap – Based on float shares × price, also in ₹ Cr.
🏷️ Sector & Industry Info:
Automatically identifies and displays the Sector and Industry of the stock using syminfo.sector and syminfo.industry.
Displayed inline with metrics, making it easy to know what business the stock belongs to.
📊 Table View:
Compact and responsive table shown on your chart.
Columns: Date | EPS | QoQ | Sales | QoQ | Net Profit | QoQ | Metrics
Metrics column dynamically shows:
Market Cap
Free Float
Sector (Row 4)
Industry (Row 5)
🌗 Appearance:
Supports Dark Mode and Mini Mode toggle.
You can also customize:
Number of data points (last 4+ quarters or years)
Table position and size
🎯 Use Case:
This script is ideal for:
Fundamental-focused traders who use EPS/Sales trends to identify momentum.
Swing traders who combine price action with fundamental tailwinds.
Portfolio builders who want to see sector/industry alignment quickly.
It works best with fundamentally sound stocks where earnings and profitability are a major factor in price movements.
✅ Important Notes:
Script uses request.financial which only works with supported symbols (mostly stocks).
Market Cap and Free Float are calculated in ₹ Crores.
All financial values are rounded and formatted for readability (e.g., 1,234 Cr).
🙏 Credits:
Developed and published by Sameer Thorappa
Built with a clean, minimalist approach for high readability and functionality.

Supply In Profit Z-ScoreZ-score of BTC Supply in Profit.
Supply in Profit is an On-Chain BTC indicator that shows the percentage of BTC in profit.
In this indicator you can choose to use a Z-Score or not.

Risk Calculator PRO — manual lot size + auto lot-suggestionWhy risk management?
90 % of traders blow up because they size positions emotionally. This tool forces Risk-First Thinking: choose the amount you’re willing to lose, and the script reverse-engineers everything else.
Key features
1. Manual or Market Entry – click “Use current price” or type a custom entry.
2. Setup-based ₹-Risk – four presets (A/B/C/D). Edit to your workflow.
3. Lot-Size Input + Auto Lot Suggestion – you tell the contract size ⇒ script tells you how many lots.
4. Auto-SL (optional) – tick to push stop-loss to exactly 1-lot risk.
5. Instant Targets – 1 : 2, 1 : 3, 1 : 4, 1 : 5 plotted and alert-ready.
6. P&L Preview – table shows potential profit at each R-multiple plus real ₹ at SL.
7. Margin Column – enter per-lot margin once; script totals it for any size.
8. Clean Table UI – dark/light friendly; updates every 5 bars.
9. Alert Pack – SL, each target, plus copy-paste journal line on the chart.
How to use
1. Add to chart > “Format”.
2. Type the lot size for the symbol (e.g., 1250 for Natural Gas, 1 for cash equity).
3. Pick Side (Buy / Sell) & Setup grade.
4. ✅ If you want the script to place SL for you, tick Auto-SL (risk = 1 lot).
5. Otherwise type your own Stop-loss.
6. Read the table:
• Suggested lots = how many to trade so risk ≤ setup ₹.
• Risk (currency) = real money lost if SL hits.
7. Set TradingView alerts on the built-in conditions (T1_2, SL_hit, etc.) if you’d like push / email.
8. Copy the orange CSV label to Excel / Sheets for journalling.
Best practices
• Never raise risk to “fit” a trade. Lower size instead.
• Review win-rate vs. R multiple monthly; adjust setups A–D accordingly.
• Test Auto-SL in replay before going live.
Disclaimer
This script is educational. Past performance ≠ future results. The author isn’t responsible for trading losses.

Multi-Indicator Swing [TIAMATCRYPTO]v6# Strategy Description:
## Multi-Indicator Swing
This strategy is designed for swing trading across various markets by combining multiple technical indicators to identify high-probability trading opportunities. The system focuses on trend strength confirmation and volume analysis to generate precise entry and exit signals.
### Core Components:
- **Supertrend Indicator**: Acts as the primary trend direction filter with optimized settings (Factor: 3.0, ATR Period: 10) to balance responsiveness and reliability.
- **ADX (Average Directional Index)**: Confirms the strength of the prevailing trend, filtering out sideways or choppy market conditions where the strategy avoids taking positions.
- **Liquidity Delta**: A volume-based indicator that analyzes buying and selling pressure imbalances to validate trend direction and potential reversals.
- **PSAR (Optional)**: Can be enabled to add additional confirmation for trend changes, turned off by default to reduce signal filtering.
### Key Features:
- **Flexible Direction Trading**: Choose between long-only, short-only, or bidirectional trading to adapt to market conditions or account restrictions.
- **Conservative Risk Management**: Implements fixed percentage-based stop losses (default 2%) and take profits (default 4%) for a positive risk-reward ratio.
- **Realistic Backtesting Parameters**: Includes commission (0.1%) and slippage (2 points) to reflect real-world trading conditions.
- **Visual Signals**: Clear buy/sell arrows with customizable sizes for easy identification on the chart.
- **Information Panel**: Dynamic display showing active indicators and current risk settings.
### Best Used On:
Daily timeframes for cryptocurrencies, forex, or stock indices. The strategy performs optimally on assets with clear trending behavior and sufficient volatility.
### Default Settings:
Optimized for conservative position sizing (5% of equity per trade) with an initial capital of $10,000. The backtesting period (2021-2023) provides a statistically significant sample of varied market conditions.

FA Dashboard: Valuation, Profitability & SolvencyFundamental Analysis Dashboard: A Multi-Dimensional View of Company Quality
This script presents a structured and customizable dashboard for evaluating a company’s fundamentals across three key dimensions: Valuation, Profitability, and Solvency & Liquidity.
Unlike basic fundamental overlays, this dashboard consolidates multiple financial indicators into visual tables that update dynamically and are grouped by category. Each ratio is compared against configurable thresholds, helping traders quickly assess whether a company meets certain value investing criteria. The tables use color-coded checkmarks and fail marks (✔️ / ❌) to visually signal pass/fail evaluations.
▶️ Key Features
Valuation Ratios:
Earnings Yield: EBIT / EV
EV / EBIT and EV / FCF: Enterprise value metrics for profitability
Price-to-Book, Free Cash Flow Yield, PEG Ratio
Profitability Ratios:
Return on Invested Capital (ROIC), ROE, Operating, Net & Gross Margins, Revenue Growth
Solvency & Liquidity Ratios:
Debt to Equity, Debt to EBITDA, Current Ratio, Quick Ratio, Altman Z-Score
Each of these metrics is calculated using request.financial() and can be viewed using either annual (FY) or quarterly (FQ) data, depending on user preference.
🧠 How to Use
Add the script to any stock chart.
Select your preferred data period (FY or FQ).
Adjust thresholds if desired to match your personal investing strategy.
Review the visual dashboard to see which metrics the company passes or fails.
💡 Why It’s Useful
This tool is ideal for traders or long-term investors looking to filter stocks using fundamental criteria. It draws inspiration from principles used by Benjamin Graham, Warren Buffett, and Joel Greenblatt, offering a fast and informative way to screen quality businesses.
This is not a repackaged built-in or autogenerated script. It’s a custom-built, interactive tool tailored for fundamental analysis using official financial data provided via Pine Script’s request.financial().

Stop Loss / Take Profit Table// (\_/)
// ( •.•)
// (")_(")
📈 Introducing the Stop Loss / Take Profit Table Indicator! 📈
Enhance your trading strategy with our powerful Stop Loss / Take Profit Table indicator, designed for traders in the Crypto, Stock, and Forex markets. This easy-to-use tool helps you manage risk and maximize profits by clearly displaying your Stop Loss and Take Profit levels based on your trading position.
Key Features:
Custom Asset Types: Choose between Crypto, Stock, or Forex to tailor the indicator to your specific trading style.
Dynamic Stop Loss & Take Profit Calculation: Set your desired Stop Loss percentage, and the indicator will automatically calculate your Stop Loss and two Take Profit levels based on different timeframes (1 min to 240 min).
Position Type Flexibility: Whether you're trading Long or Short, the indicator adjusts the calculations accordingly, providing you with precise price levels for effective risk management.
Visual Representation: Stop Loss and Take Profit levels are marked directly on the chart with distinctive horizontal lines in vibrant colors for easy reference.
Informative Table Display: A dedicated table displayed on the chart shows your asset type, position type, and calculated prices for Stop Loss and Take Profit levels, ensuring you have all critical data at a glance.
Alert Notifications: Stay informed with optional alerts that signal when your Stop Loss or Take Profit levels are hit, allowing you to react swiftly in fast-moving markets.
Why Use This Indicator?
Managing your trades is critical for success in the financial markets. With our Stop Loss / Take Profit Table, you can easily set your parameters and visually track your risk and reward levels, making it a practical addition to any trader's toolkit.
Get started today and take control of your trading strategy! ✨
Happy trading! 📊🚀

Moving Average Crossover Strategy with Take Profit and Stop LossThe Moving Average Crossover Strategy is a popular trading technique that utilizes two moving averages (MAs) of different periods to identify potential buy and sell signals. By incorporating take profit and stop loss levels, traders can effectively manage their risk while maximizing potential returns. Here’s a detailed explanation of how this strategy works:
Overview of the Moving Average Crossover Strategy
Moving Averages:
A short-term moving average (e.g., 50-day MA) reacts more quickly to price changes, while a long-term moving average (e.g., 200-day MA) smooths out price fluctuations over a longer period.
The strategy generates trading signals based on the crossover of these two averages:
Buy Signal: When the short-term MA crosses above the long-term MA (often referred to as a "Golden Cross").
Sell Signal: When the short-term MA crosses below the long-term MA (known as a "Death Cross").
Implementing Take Profit and Stop Loss
1. Setting Take Profit Levels
Definition: A take profit order automatically closes a trade when it reaches a specified profit level.
Strategy:
Determine a realistic profit target based on historical price action, support and resistance levels, or a fixed risk-reward ratio (e.g., 2:1).
For instance, if you enter a buy position at $100, you might set a take profit at $110 if you anticipate that level will act as resistance.
2. Setting Stop Loss Levels
Definition: A stop loss order limits potential losses by closing a trade when the price reaches a specified level.
Strategy:
Place the stop loss just below the most recent swing low for buy orders or above the recent swing high for sell orders.
Alternatively, you can use a percentage-based method (e.g., 2-3% below the entry point) to define your stop loss.
For example, if you enter a buy position at $100 with a stop loss set at $95, your maximum loss would be limited to $5 per share.
Example of Using Moving Average Crossover with Take Profit and Stop Loss
Entry Signal:
You observe that the 50-day MA crosses above the 200-day MA at $100. You enter a buy position.
Setting Take Profit and Stop Loss:
You analyze historical price levels and set your take profit at $110.
You place your stop loss at $95 based on recent swing lows.
Trade Management:
If the price rises to $110, your take profit order is executed, securing your profit.
If the price falls to $95, your stop loss is triggered, limiting your losses.

SuperATR 7-Step Profit - Strategy [presentTrading] Long time no see!
█ Introduction and How It Is Different
The SuperATR 7-Step Profit Strategy is a multi-layered trading approach that integrates adaptive Average True Range (ATR) calculations with momentum-based trend detection. What sets this strategy apart is its sophisticated 7-step take-profit mechanism, which combines four ATR-based exit levels and three fixed percentage levels. This hybrid approach allows traders to dynamically adjust to market volatility while systematically capturing profits in both long and short market positions.
Traditional trading strategies often rely on static indicators or single-layered exit strategies, which may not adapt well to changing market conditions. The SuperATR 7-Step Profit Strategy addresses this limitation by:
- Using Adaptive ATR: Enhances the standard ATR by making it responsive to current market momentum.
- Incorporating Momentum-Based Trend Detection: Identifies stronger trends with higher probability of continuation.
- Employing a Multi-Step Take-Profit System: Allows for gradual profit-taking at predetermined levels, optimizing returns while minimizing risk.
BTCUSD 6hr Performance
█ Strategy, How It Works: Detailed Explanation
The strategy revolves around detecting strong market trends and capitalizing on them using an adaptive ATR and momentum indicators. Below is a detailed breakdown of each component of the strategy.
🔶 1. True Range Calculation with Enhanced Volatility Detection
The True Range (TR) measures market volatility by considering the most significant price movements. The enhanced TR is calculated as:
TR = Max
Where:
High and Low are the current bar's high and low prices.
Previous Close is the closing price of the previous bar.
Abs denotes the absolute value.
Max selects the maximum value among the three calculations.
🔶 2. Momentum Factor Calculation
To make the ATR adaptive, the strategy incorporates a Momentum Factor (MF), which adjusts the ATR based on recent price movements.
Momentum = Close - Close
Stdev_Close = Standard Deviation of Close over n periods
Normalized_Momentum = Momentum / Stdev_Close (if Stdev_Close ≠ 0)
Momentum_Factor = Abs(Normalized_Momentum)
Where:
Close is the current closing price.
n is the momentum_period, a user-defined input (default is 7).
Standard Deviation measures the dispersion of closing prices over n periods.
Abs ensures the momentum factor is always positive.
🔶 3. Adaptive ATR Calculation
The Adaptive ATR (AATR) adjusts the traditional ATR based on the Momentum Factor, making it more responsive during volatile periods and smoother during consolidation.
Short_ATR = SMA(True Range, short_period)
Long_ATR = SMA(True Range, long_period)
Adaptive_ATR = /
Where:
SMA is the Simple Moving Average.
short_period and long_period are user-defined inputs (defaults are 3 and 7, respectively).
🔶 4. Trend Strength Calculation
The strategy quantifies the strength of the trend to filter out weak signals.
Price_Change = Close - Close
ATR_Multiple = Price_Change / Adaptive_ATR (if Adaptive_ATR ≠ 0)
Trend_Strength = SMA(ATR_Multiple, n)
🔶 5. Trend Signal Determination
If (Short_MA > Long_MA) AND (Trend_Strength > Trend_Strength_Threshold):
Trend_Signal = 1 (Strong Uptrend)
Elif (Short_MA < Long_MA) AND (Trend_Strength < -Trend_Strength_Threshold):
Trend_Signal = -1 (Strong Downtrend)
Else:
Trend_Signal = 0 (No Clear Trend)
🔶 6. Trend Confirmation with Price Action
Adaptive_ATR_SMA = SMA(Adaptive_ATR, atr_sma_period)
If (Trend_Signal == 1) AND (Close > Short_MA) AND (Adaptive_ATR > Adaptive_ATR_SMA):
Trend_Confirmed = True
Elif (Trend_Signal == -1) AND (Close < Short_MA) AND (Adaptive_ATR > Adaptive_ATR_SMA):
Trend_Confirmed = True
Else:
Trend_Confirmed = False
Local Performance
🔶 7. Multi-Step Take-Profit Mechanism
The strategy employs a 7-step take-profit system
█ Trade Direction
The SuperATR 7-Step Profit Strategy is designed to work in both long and short market conditions. By identifying strong uptrends and downtrends, it allows traders to capitalize on price movements in either direction.
Long Trades: Initiated when the market shows strong upward momentum and the trend is confirmed.
Short Trades: Initiated when the market exhibits strong downward momentum and the trend is confirmed.
█ Usage
To implement the SuperATR 7-Step Profit Strategy:
1. Configure the Strategy Parameters:
- Adjust the short_period, long_period, and momentum_period to match the desired sensitivity.
- Set the trend_strength_threshold to control how strong a trend must be before acting.
2. Set Up the Multi-Step Take-Profit Levels:
- Define ATR multipliers and fixed percentage levels according to risk tolerance and profit goals.
- Specify the percentage of the position to close at each level.
3. Apply the Strategy to a Chart:
- Use the strategy on instruments and timeframes where it has been tested and optimized.
- Monitor the positions and adjust parameters as needed based on performance.
4. Backtest and Optimize:
- Utilize TradingView's backtesting features to evaluate historical performance.
- Adjust the default settings to optimize for different market conditions.
█ Default Settings
Understanding default settings is crucial for optimal performance.
Short Period (3): Affects the responsiveness of the short-term MA.
Effect: Lower values increase sensitivity but may produce more false signals.
Long Period (7): Determines the trend baseline.
Effect: Higher values reduce noise but may delay signals.
Momentum Period (7): Influences adaptive ATR and trend strength.
Effect: Shorter periods react quicker to price changes.
Trend Strength Threshold (0.5): Filters out weaker trends.
Effect: Higher thresholds yield fewer but stronger signals.
ATR Multipliers: Set distances for ATR-based exits.
Effect: Larger multipliers aim for bigger moves but may reduce hit rate.
Fixed TP Levels (%): Control profit-taking on smaller moves.
Effect: Adjusting these levels affects how quickly profits are realized.
Exit Percentages: Determine how much of the position is closed at each TP level.
Effect: Higher percentages reduce exposure faster, affecting risk and reward.
Adjusting these variables allows you to tailor the strategy to different market conditions and personal risk preferences.
By integrating adaptive indicators and a multi-tiered exit strategy, the SuperATR 7-Step Profit Strategy offers a versatile tool for traders seeking to navigate varying market conditions effectively. Understanding and adjusting the key parameters enables traders to harness the full potential of this strategy.

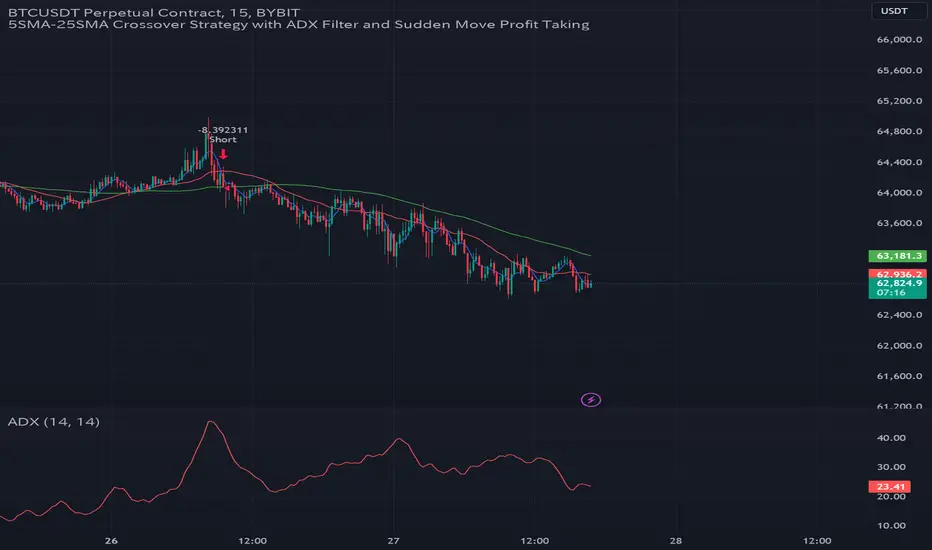
GC Strategy with Trend Filter and Sudden Move Profit TakingBYBIT:BTCUSDT.P 15M
Situation Assessment with Three Moving Averages
The strategy uses the crossover of the 5SMA and 25SMA as entry signals.
Additionally, the 75SMA is used as a filter. Long entries are only allowed when the price is above the 75SMA, and short entries are only allowed when the price is below the 75SMA.
ADX Filter
The Average Directional Index (ADX) is used to check the strength of the trend. Entry signals are only activated when the ADX is above 20. This ensures that trades are only executed when the trend is strong.
Sudden Move Detection
The strategy detects sudden price movements. If a sudden move occurs, the position is closed to lock in profits.
Entry
Long Entry: When the 5SMA crosses above the 25SMA, the price is above the 75SMA, and the ADX is above 20.
Short Entry: When the 5SMA crosses below the 25SMA, the price is below the 75SMA, and the ADX is above 20.
Exit
Positions are closed if a sudden move occurs. Positions are also closed if an opposing entry signal is generated.
This strategy aims to confirm the strength of the trend using moving average crossovers and ADX and to lock in profits based on sudden price movements.
3本の移動平均線による状況判断
5SMAと25SMA のクロスオーバーをエントリーシグナルとして使用します。
さらに、75SMAをフィルターとして使用し、価格が75SMAの上にある場合のみロングエントリーを許可し、75SMAの下にある場合のみショートエントリーを許可します。
ADXフィルター
ADX(平均方向性指数)を使ってトレンドの強さを確認します。
ADXが20より大きい場合のみ、エントリーシグナルを有効にします。これにより、トレンドが強い時にのみ取引を行うことができます。
急激な変動検知
価格の急激な変動を検出します。
急激な変動があった場合には、ポジションをクローズして利益を確定します。
エントリー
ロングエントリー
5SMAが25SMAを上にクロスし、価格が75SMAの上にあり、ADXが20を超えているとき。
ショートエントリー
5SMAが25SMAを下にクロスし、価格が75SMAの下にあり、ADXが20を超えているとき。
エグジット
急激な変動があった場合、ポジションをクローズします。
反対のエントリーシグナルが発生した場合にも、ポジションをクローズします。
このストラテジーは、移動平均のクロスオーバーとADXを使ってトレンドの強さを確認し、急激な変動に基づいて利益を確定することを目的としています。
Risk Management Calculator with Fees and Take Profit [CHE]Risk Management Calculator with Fees and Take Profit
Welcome to the Risk Management Calculator with Fees and Take Profit script! This powerful tool is designed to help traders manage their risk effectively, calculate leverage, and set take profit targets. The script is inspired by and builds upon the ideas from the following TradingView script: ().
This script is inspired by and builds upon the ideas from the following TradingView script:
Features
1. Portfolio Size Input: Enter the size of your portfolio to accurately calculate your risk and leverage.
2. Max Loss Percent Input: Specify the maximum percentage of your portfolio that you are willing to risk on a single trade.
3. Max Leverage Input: Set the maximum leverage you are comfortable using.
4. Trading Fee Input: Include trading fees in your calculations to get a more realistic view of your potential losses and gains.
5. ATR Settings: Configure the ATR period and multiplier to calculate your stop loss and take profit levels.
6. RSI Settings: Adjust the RSI period for trend analysis.
How to Use
Portfolio Size
- Description: This is the total value of your trading account.
- Input: `portfolioSize`
- Default Value: 100
- Minimum Value: 0.001
Max Loss Percent
- Description: The maximum percentage of your portfolio you are willing to lose on a single trade.
- Input: `maxLossPercent`
- Default Value: 3%
- Range: 0.1% to 100%
Max Leverage
- Description: The maximum leverage you wish to use.
- Input: `maxLeverage`
- Default Value: 125
- Range: 1 to 125
Trading Fee
- Description: The fee percentage you pay per trade.
- Input: `feeRate`
- Default Value: 1%
- Range: 0% to 10%
ATR Settings
- ATR Period: Number of bars used to calculate the Average True Range.
- Input: `atrPeriod`
- Default Value: 5
- ATR Multiplier: Multiplier for ATR to set stop loss levels.
- Input: `atrMultiplier`
- Default Value: 2.0
Take Profit Multiplier
- Description: Multiplier for ATR to set take profit levels.
- Input: `takeProfitMultiplier`
- Default Value: 2.0
RSI Settings
- RSI Period: Period for the RSI calculation.
- Input: `rsiPeriod`
- Default Value: 14
Dashboard
The script includes a customizable dashboard that displays the following information:
- Portfolio Size
- Maximum Loss Amount
- Entry Price
- Stop Loss Price
- Stop Loss Percentage
- Calculated Leverage
- Order Value
- Order Quantity
- Trend Direction
- Adjusted Maximum Loss Percentage
- Take Profit Price
Dashboard Settings
- Location: Choose the position of the dashboard on the chart.
- Options: 'Top Right', 'Bottom Right', 'Top Left', 'Bottom Left'
- Size: Adjust the size of the dashboard text.
- Options: 'Tiny', 'Small', 'Normal', 'Large'
- Text/Frame Color: Set the color for the text and frame of the dashboard.
Underlying Principles and Assumptions
Leverage Calculation
The leverage calculation is fundamental to risk management in trading. It ensures that the risk per trade does not exceed a specified percentage of the portfolio. This calculation takes into account the potential loss from the entry price to the stop loss level, adjusted for trading fees. By dividing the maximum acceptable loss by the total potential loss (including fees), we derive a leverage that limits the exposure per trade. This approach helps traders avoid over-leveraging, which can lead to significant losses.
ATR and Stop Loss
The Average True Range (ATR) is used to set stop loss levels because it measures market volatility. A higher ATR indicates more volatility, which means wider stop losses are needed to avoid being prematurely stopped out by normal market fluctuations. By using an ATR multiplier, the stop loss is dynamically adjusted based on current market conditions, providing a more robust risk management strategy.
Take Profit Calculation
The take profit level is calculated as a multiple of the ATR, ensuring that it is set at a realistic level relative to market volatility. This method aims to capture significant price movements while avoiding the noise of smaller fluctuations. Setting take profit targets this way helps in locking in profits when the market moves favorably.
RSI for Trend Confirmation
The Relative Strength Index (RSI) is used to confirm the trend direction. An RSI above 50 typically indicates a bullish trend, while an RSI below 50 indicates a bearish trend. By aligning trades with the prevailing trend, the script increases the probability of successful trades. This trend confirmation helps in making informed decisions about leverage and position sizing.
Risk Color Coding
The script uses color coding to visually indicate the risk level and trend direction. Green indicates a favorable condition for long trades, red for short trades, and gray for neutral conditions. This intuitive color coding aids in quickly assessing the market conditions and making timely trading decisions.
Conclusion
This script aims to provide a comprehensive risk management tool for traders. By integrating portfolio size, leverage, fees, ATR, and RSI, it helps in making informed trading decisions. We hope you find this tool useful in your trading journey.
Happy Trading!

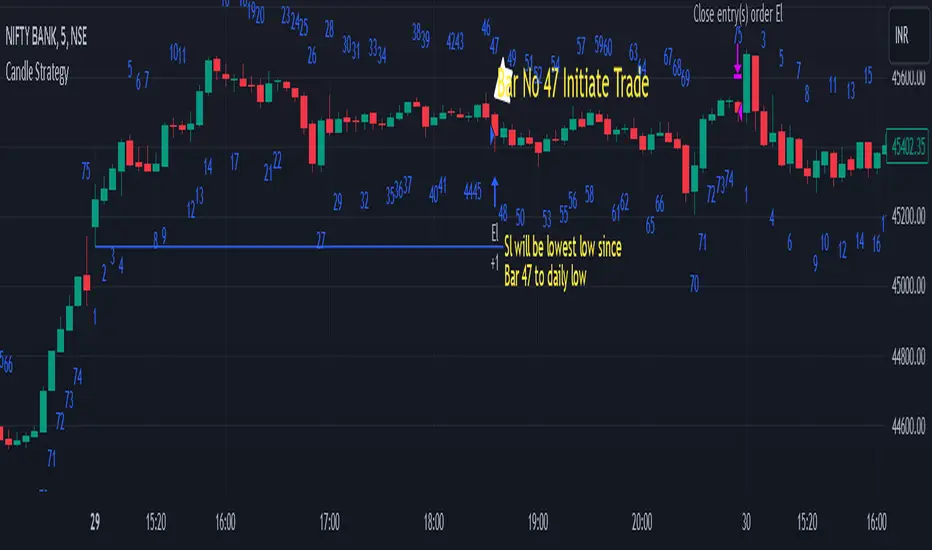
Candle StrategyThis strategy is based candle count number also strategy analysis -
Rules for buy-
1) choose Candle Number(Ex.-47) For Trade
2) Trade Sell if price is above high of day 1st candle that mean direction is upside
3) We are taking stop loss on lowest low of candle since day first candle to trade no.
4) close Trade at last bar of the day
5) Trader Can Choose Trade Direction From input
Rules for Sell-
1) Choose Candle Number(Ex.-47) For Trade
2) Trade Sell if price is below low of day 1st candle that mean direction is downside
3) We are taking stop loss on highest of candle since day first candle to trade no.
4) close Trade at last bar of the day
5) Trader Can Choose Trade Direction From input
Note - this strategy can be also use for static to understand which candle will make low/high of the day high chance Example in bank nifty 5 minutes chart candle no 47 have highest trade
opportunity appear on long side ...this data is small based on 5000 previous bar ...
Disclaimer: market involves significant risks, including complete possible loss of funds. Consequently trading is not suitable for all investors and traders. By increasing leverage risk increases as well.With the demo account you can test any trading strategies you wish in a risk-free environment. Please bear in mind that the results of the transactions of the practice account are virtual, and do not reflect any real profit or loss or a real trading environment, whereas market conditions may affect both the quotation and execution