Economic Profit (Fixed & Labeled) — Rated + PeersFRAC (Fundamental-Rated-Asset-Calculate)
FRAC is a fundamentals-driven tool designed to measure whether a company is creating or destroying shareholder value. Unlike surface ratios, FRAC uses Economic Profit (ROIC – WACC) as its engine, showing whether a business truly outperforms its cost of capital.
🔹 What FRAC Does
Calculates ROIC (Return on Invested Capital) vs. WACC (Weighted Average Cost of Capital).
Shows whether a company is creating or destroying shareholder value.
Uses tiered color coding for clarity:
🔵 Superior (Aqua Blue) → Top tier; best of the best.
🟣 Elite (Purple) → Strong value creation.
🟢 Positive (Green) → Solid, creating shareholder value.
🟡 Marginal (Yellow) → Barely covering cost of capital.
🔴 Negative (Red) → Value destruction.
🔹 Composite Ranking System (1–4)
FRAC also assigns each company a Composite Rank so you can compare multiple names side by side. The rank works like this:
Rank 1 → Superior (🔵 Aqua Blue)
Best possible rating; wide gap between ROIC and WACC.
Rank 2 → Elite (🟣 Purple)
Strongly positive; above-average capital efficiency.
Rank 3 → Positive (🟢 Green)
Creating value but only moderately; not a top compounder.
Rank 4 → Marginal/Negative (🟡/🔴)
Weak or destructive; either barely covering WACC or losing money on capital.
✅ How to Use the Ranks
When comparing a set of peers (e.g., NVDA, AMD, INTC):
FRAC will display each company’s color rating + composite rank (1–4).
You can instantly see who is strongest vs. weakest in the group.
Best decisions = overweight Rank 1 & 2 companies, avoid Rank 4 names.
🔹 Key Inputs Explained
Risk-Free Asset → Typically the 10-Year US Treasury yield (US10Y).
Corporate Tax Rate → Effective tax rate for the company’s country (e.g., USCTR).
Expected Market Return → Historical average ~8–10%, adjustable.
Beta Lookback Period → Controls how far back Beta is calculated (longer = more stable, shorter = more reactive).
👉 These must be set correctly for FRAC to calculate WACC accurately.
🔹 Example Comparison
NVDA: ROIC 25% – WACC 7% = +18% → 🔵 Superior → Rank 1
AMD: ROIC 17% – WACC 8% = +9% → 🟣 Elite → Rank 2
INTC: ROIC 11% – WACC 9% = +2% → 🟢 Positive → Rank 3
FSLY: ROIC 5% – WACC 10% = –5% → 🔴 Negative → Rank 4
🔹 Why It Matters
Buffett said: “The best businesses are those that can consistently generate returns on capital above their cost of capital.”
FRAC turns that into a visual + numeric rating system (1–4), making comparisons across peers simple and actionable.
🔹 Credit
FRAC was created by Hunter Hammond (Elite x FineFir), inspired by corporate finance models of Economic Profit and Economic Value Added (EVA).
⚠️ Disclaimer: FRAC is a research framework, not financial advice. Always pair with full due diligence.
Cerca negli script per "profit"

Trojan Cycle: Dip & Profit Hunter📉 Crypto is changing. Your signals should too.
This script doesn’t try to outguess price — it helps you track capital rotation and flow behavior in alignment with the evolving macro structure of the digital asset market.
Trojan Cycle: Dip & Profit Hunter is a signal engine built to support and validate the capital rotation models outlined in the Trojan Cycle and Synthetic Rotation theses — available via RWCS_LTD’s published charts
It is not a classic “buy low, sell high” tool. It is a structural filter that uses price/volume statistics to surface accumulation zones, synthetic traps, and macro context shifts — all aligned with the institutionalization of crypto post-2024.
🧠 Purpose & Value
Crypto no longer follows the retail-led, halving-driven pattern of 2017 or 2021.
Instead, institutional infrastructure, regulatory filters, and equity-market Trojan horses define the new path of capital.
This tool helps you visualize that path by interpreting behavior through statistical imbalances and real-time momentum signals.
Use it to:
Track where capital is accumulating or exiting
Identify signals consistent with true cycle rotation (vs. synthetic traps)
Validate your macro view with real-time statistical context
🔍 How It Works
The engine combines four signal layers:
1. Z-Score Logic
- Measures how far price and volume have deviated from their mean
- Detects dips, blowoffs, and exhaustion zones
2. Percentile Logic
- Compares current price and volume to historical rank distribution
- Flags statistically rare conditions (e.g. bottom 10% price, top 90% volume)
3. Combined Context Engine
- Integrates both models to generate one of 36 unique output states
- Each state provides a labeled market context (e.g., 🟢 Confluent Buy, 🔴 Confluent Sell, 🧨 Synthetic Trap )
4. Momentum Spread & Divergence
- Measures whether price is leading volume (trap risk) or volume is leading price (accumulation)
- Outputs intuitive momentum context with emoji-coded alerts
📋 What You See
🧠 Contextual Table UI with key Z-Scores, percentiles, signals, and market commentary
🎯 Emoji-coded signals to quickly grasp high-probability setups or risk zones
🌊 Optional overlays: price/volume divergence, momentum spread
🎨 Visual table customization (size, position) and chart highlights for signal clarity
🔔 Alert System
✅ Single dynamic alert using alert() that only fires when signal context changes
Prevents alert fatigue and allows clean webhook/automation integration
🧭 Use Cases
For macro cycle traders: Track where we are in the Trojan Cycle using statistical context
For thesis explorers: Use the 36-output signal map to match against your rotation thesis
For capital rotation watchers: Identify structural setups consistent with ETF-driven or compliance-filtered flow
For narrative skeptics: Avoid synthetic altseason traps where volume lags or flow dries up
🧪 Suggested Pairing for Thesis Validation
To use this tool as part of a thesis-confirmation framework , pair it with:
BTC.D — Bitcoin Dominance
ETH/BTC — Ethereum strength vs. Bitcoin
TOTALE100/ETH — Altcoin strength relative to ETH
RWCS_LTD’s published charts and macro cycle models
🏁 Final Note
Crypto has matured. So should your signals.
This tool doesn’t try to game the next 2 candles. It helps you understand the current phase in a compliance-filtered, institutionalized rotation model.
It’s not built for hype — it’s built for conviction.
Explore the thesis → Validate the structure → Trade with clarity.
🚨 Disclaimer
This script is not financial advice. It is an analytical tool designed to support market structure research and rotation thesis validation. Use this as part of a broader framework including technical structure, dominance charts, and macro data.

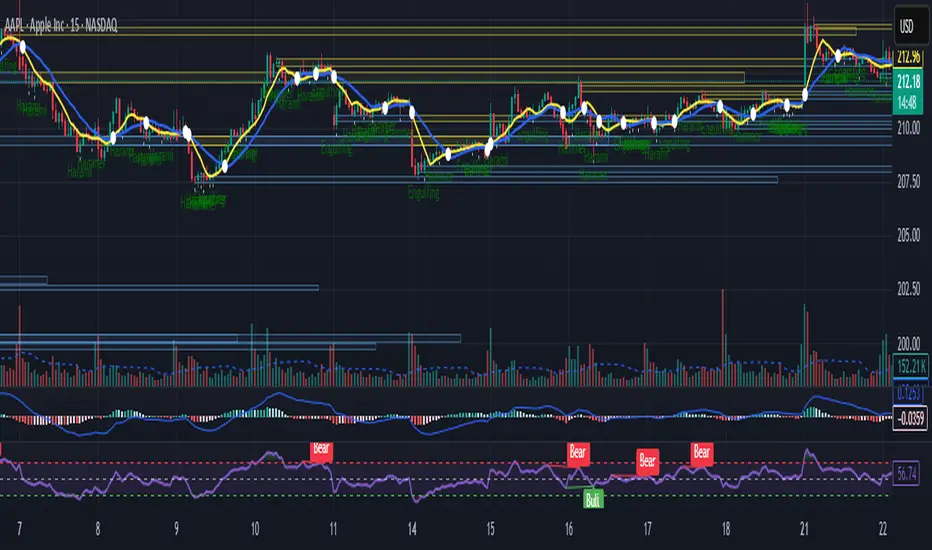
Intraday Bullish Scanner - Profit Ping📊 Intraday Bullish Scanner – Profit Ping Only
This custom-built TradingView script identifies high-probability intraday BUY signals on the 15-minute chart, confirmed by volume, momentum, and price action. It uses:
✅ EMA 7/14 crossovers
✅ Bullish candlestick patterns (Engulfing, Piercing, etc.)
✅ Volume spikes above 20-MA
✅ RSI between 55–65
✅ MACD histogram flip from red to green
✅ Cross-confirmation with the 30-minute trend
Once in a trade, it activates a dynamic trailing stop (starting at 2%, tightening to 1% as profit and volume increase). SELL signals are confirmed only with:
❌ MACD turning red
❌ Bearish RSI movement or drop below 50
❌ EMA 7 crossing below EMA 14
❌ A bearish candlestick (Engulfing or Piercing)
❌ Volume spike on a red candle
💰 When all SELL conditions align, a yellow triangle appears. BUYs are marked with a white triangle. Alerts can be connected directly to Python/webhook systems for full automation with IBKR.
Max Profit Min Loss Options Strategyoption when to buy and sell calls and puts indicator. it uses the rsi macd and volume indicators. it has high profit and low loses
SOXL Trend Surge v3.0.2 – Profit-Only RunnerSOXL Trend Surge v3.0.2 – Profit-Only Runner
This is a trend-following strategy built for leveraged ETFs like SOXL, designed to ride high-momentum waves with minimal interference. Unlike most short-term scalping scripts, this model allows trades to develop over multiple days to even several months, capitalizing on the full power of extended directional moves — all without using a stop-loss.
🔍 How It Works
Entry Logic:
Price is above the 200 EMA (long-term trend confirmation)
Supertrend is bullish (momentum confirmation)
ATR is rising (volatility expansion)
Volume is above its 20-bar average (liquidity filter)
Price is outside a small buffer zone from the 200 EMA (to avoid whipsaws)
Trades are restricted to market hours only (9 AM to 2 PM EST)
Cooldown of 15 bars after each exit to prevent overtrading
Exit Strategy:
Takes partial profit at +2× ATR if held for at least 2 bars
Rides the remaining position with a trailing stop at 1.5× ATR
No hard stop-loss — giving space for volatile pullbacks
⚙️ Strategy Settings
Initial Capital: $500
Risk per Trade: 100% of equity (fully allocated per entry)
Commission: 0.1%
Slippage: 1 tick
Recalculate after order is filled
Fill orders on bar close
Timeframe Optimized For: 45-minute chart
These parameters simulate an aggressive, high-volatility trading model meant for forward-testing compounding potential under realistic trading costs.
✅ What Makes This Unique
No stop-loss = fewer premature exits
Partial profit-taking helps lock in early wins
Trailing logic gives room to ride large multi-week moves
Uses strict filters (volume, ATR, EMA bias) to enter only during high-probability windows
Ideal for leveraged ETF swing or position traders looking to hold longer than the typical intraday or 2–3 day strategies
⚠️ Important Note
This is a high-risk, high-reward strategy meant for educational and testing purposes. Without a stop-loss, trades can experience deep drawdowns that may take weeks or even months to recover. Always test thoroughly and adjust position sizing to suit your risk tolerance. Past results do not guarantee future returns. Backtest range: May 8, 2020 – May 23, 2025

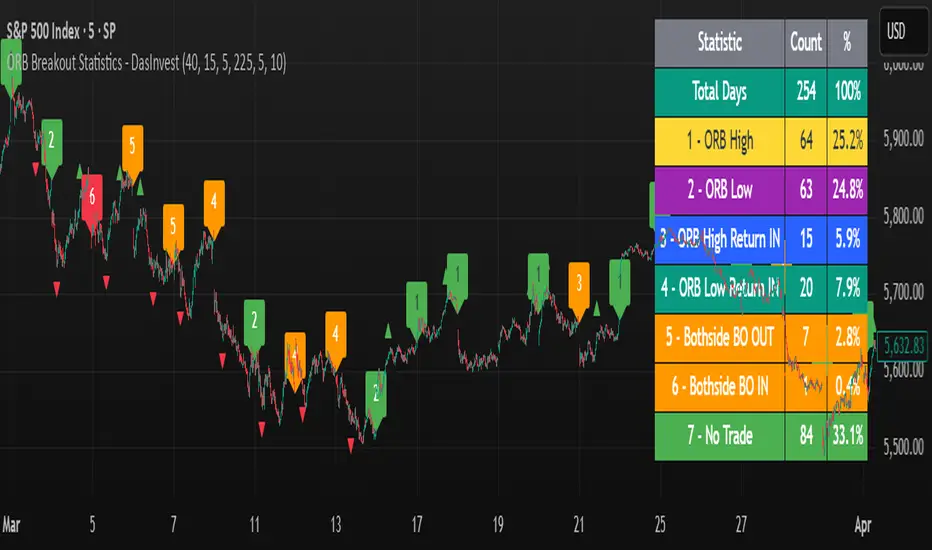
ORB Breakout Statistics with Labels and ProfitOpening Range Breakout Statistics – This indicator identifies the opening range based on user-defined inputs and detects breakouts above the high or below the low. At the end of each trading day, it classifies the session into a specific category based on price action. Additionally, it tracks profit and loss for each classification, allowing you to backtest the strategy using log files.
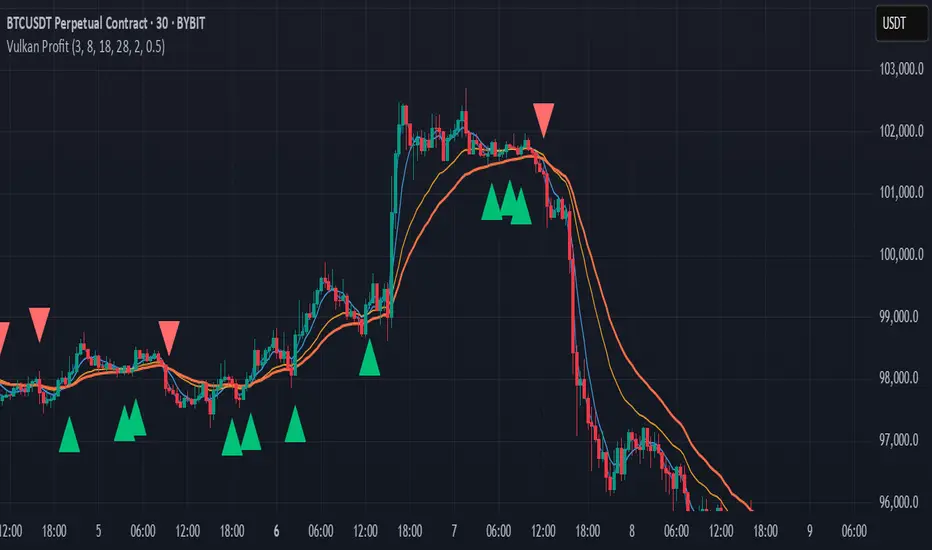
Vulkan Profit
Overview
The Vulkan Profit indicator is a trend-following tool that identifies potential entry and exit points by monitoring the relationship between short-term and long-term moving averages. It generates clear buy and sell signals when specific moving average conditions align, making it useful for traders looking to confirm trend changes across multiple timeframes.
How It Works
The indicator utilizes four different moving averages:
Fast WMA (period 3) - A highly responsive weighted moving average
Medium WMA (period 8) - A less sensitive weighted moving average
Fast EMA (period 18) - A responsive exponential moving average
Slow EMA (period 28) - A slower exponential moving average
These moving averages are grouped into two categories:
Short-term MAs: Fast WMA and Medium WMA
Long-term MAs: Fast EMA and Slow EMA
Signal Generation Logic
The Vulkan Profit indicator generates signals based on the relative positions of these moving averages:
Buy Signal (Green Triangle)
A buy signal appears when the minimum value of the short-term MAs becomes greater than the maximum value of the long-term MAs. In other words, when both short-term MAs cross above both long-term MAs.
Sell Signal (Red Triangle)
A sell signal appears when the maximum value of the short-term MAs becomes less than the minimum value of the long-term MAs. In other words, when both short-term MAs cross below both long-term MAs.
Visual Components
Moving Averages - All four moving averages can be displayed or hidden
Signal Arrows - Green triangles for buy signals, red triangles for sell signals
Colored Line - A line that changes color based on the current market stance (green for bullish, red for bearish)
Customization Options
The indicator offers several customization settings:
Toggle the visibility of moving averages
Toggle the visibility of buy/sell signals
Adjust the color, width, and position of the signal line
Choose between different line styles (Line, Stepline, Histogram)
Practical Trading Applications
Trend Identification: The relative positioning of all moving averages helps identify the current market trend
Entry/Exit Points: The buy and sell signals can be used as potential entry and exit points
Trend Confirmation: The colored line provides ongoing confirmation of the trend direction
Filter: Can be used in conjunction with other indicators as a trend filter
Trading Strategy Suggestions
Trend Following: Enter long positions on buy signals and exit on sell signals during trending markets
Confirmation Tool: Use the signals to confirm trades identified by other indicators
Timeframe Analysis: Apply the indicator across multiple timeframes for stronger confirmation
Risk Management: Place stop-loss orders below recent swing lows for long positions and above recent swing highs for short positions
Tips for Best Results
The indicator performs best in trending markets and may generate false signals in ranging or highly volatile markets
Consider the broader market context before taking trades based solely on these signals
Use appropriate position sizing and risk management regardless of the indicator's signals
The longer timeframes generally produce more reliable signals with fewer false positives
The Vulkan Profit indicator combines the responsiveness of short-term averages with the stability of long-term averages to capture significant trend changes while filtering out minor price fluctuations.
Spent Output Profit Ratio (SOPR) Z-Score | [DeV]SOPR Z-Score
The Spent Output Profit Ratio (SOPR) is an advanced on-chain metric designed to provide deep insights into Bitcoin market dynamics by measuring the ratio between the combined USD value of all Bitcoin outputs spent on a given day and their combined USD value at the time of creation (typically, their purchase price). As a member of the Realized Profit/Loss family of metrics, SOPR offers a window into aggregate seller behavior, effectively representing the USD amount received by sellers divided by the USD amount they originally paid. This indicator enhances this metric by normalizing it into a Z-Score, enabling a statistically robust analysis of market sentiment relative to historical trends, augmented by a suite of customizable features for precision and visualization.
SOPR Settings -
Lookback Length (Default: 150 days): Determines the historical window for calculating the Z-Score’s mean and standard deviation. A longer lookback captures broader market cycles, providing a stable baseline for identifying extreme deviations, which is particularly valuable for long-term strategic analysis.
Smoothing Period (Default: 100 days): Applies an EMA to the raw SOPR, balancing responsiveness to recent changes with noise reduction. This extended smoothing period ensures the indicator focuses on sustained shifts in seller behavior, ideal for institutional-grade trend analysis.
Moving Average Settings -
MA Lookback Length (Default: 90 days): Sets the period for the Z-Score’s moving average, offering a shorter-term trend signal relative to the 150-day Z-Score lookback. This contrast enhances the ability to detect momentum shifts within the broader context.
MA Type (Default: EMA): Provides six moving average types, from the simple SMA to the volume-weighted VWMA. The default EMA strikes an optimal balance between smoothness and responsiveness, while alternatives like HMA (Hull) or VWMA (volume-weighted) allow for specialized applications, such as emphasizing recent price action or incorporating volume dynamics.
Display Settings -
Show Moving Average (Default: True): Toggles the visibility of the Z-Score MA plot, enabling users to focus solely on the raw Z-Score when preferred.
Show Background Colors (Default: True): Activates dynamic background shading, enhancing visual interpretation of market regimes.
Background Color Source (Default: SOPR): Allows users to tie the background color to either the SOPR Z-Score’s midline (reflecting adjustedZScore > 0) or the MA’s trend direction (zScoreMA > zScoreMA ). This dual-source option provides flexibility to align the visual context with the primary analytical focus.
Analytical Applications -
Bear Market Resistance: When the Z-Score approaches or exceeds zero (raw SOPR near 1), it often signals resistance as sellers rush to exit at break-even, a pattern historically observed during downtrends. A rising Z-Score MA crossing zero can confirm this pressure.
Bull Market Support: Conversely, a Z-Score dropping below zero in uptrends indicates reluctance to sell at a loss, forming support as sell pressure diminishes. The MA’s bullish coloring reinforces confirmation of renewed buying interest.
Extreme Deviations: Values significantly above or below zero highlight overbought or oversold conditions, respectively, offering opportunities for contrarian positioning when paired with other on-chain or price-based metrics.

20 Day Moving Average with Profit TargetsThis Pine Script indicator plots a 20-day simple moving average (SMA) on the chart and displays profit target labels relative to an initial buy price.
The script allows the user to input a custom buy price and calculates profit levels at 10%, 20%, 30%, and 50% above the buy price. Labels are shown on the last bar of the chart for each profit level and the buy price, with the labels offset to the right to avoid overlapping with the price action.
The labels are color-coded based on the profit levels, and the buy price label is blue.

Dynamic Stop Loss & Take ProfitDynamic Stop Loss & Take Profit is a versatile risk management indicator that calculates dynamic stop loss and take profit levels based on the Average True Range (ATR). This indicator helps traders set adaptive exit points by using a configurable ATR multiplier and defining whether they are in a Long (Buy) or Short (Sell) trade.
How It Works
ATR Calculation – The indicator calculates the ATR value over a user-defined period (default: 14).
Stop Loss and Take Profit Multipliers – The ATR value is multiplied by a configurable factor (ranging from 1.5 to 4) to determine volatility-adjusted stop loss and take profit levels.
Trade Type Selection – The user can specify whether they are in a Long (Buy) or Short (Sell) trade.
Long (Buy) Trade:
Stop Loss = Entry Price - (ATR × Stop Loss Multiplier)
Take Profit = Entry Price + (ATR × Take Profit Multiplier)
Short (Sell) Trade:
Stop Loss = Entry Price + (ATR × Stop Loss Multiplier)
Take Profit = Entry Price - (ATR × Take Profit Multiplier)
Features
Configurable ATR length and multipliers
Supports both long and short trades
Clearly plotted Stop Loss (red) and Take Profit (green) levels on the chart
Helps traders manage risk dynamically based on market volatility
This indicator is ideal for traders looking to set adaptive stop loss and take profit levels without relying on fixed price targets.

Investment Tracker Profit/lossThe Investment Tracker is a custom-built indicator designed to help traders and investors track their performance in real time. With this tool, you can easily monitor the gains or losses from your initial investment based on the price movement of a specific token. The indicator dynamically updates to show how much you've earned or lost, providing valuable insights into your investment strategy.
Key Features:
Profit/Loss Tracking: Instantly see whether you're in profit (green) or loss (red) based on the token's price movement.
Current Value Calculation: Tracks your investment’s current value by comparing the price at which you bought the token with its current price.
Visual Representation: Displays your initial investment, current value, and profit/loss on the chart with dynamic color coding (green for profit, red for loss).
Top-Right Display: Profit/loss data is conveniently displayed in the top-right corner of the chart, providing a clean and non-intrusive way to monitor your position.
Transparency: The indicator's lines have reduced opacity, allowing you to view your position without obstructing the price action.
How to Use:
Input your initial investment amount (in USD or your desired currency).
Set the buy price of the token when you made the purchase.
Watch the indicator update as the price of the token changes, providing real-time tracking of your profit or loss.
Whether you're holding a single position or monitoring multiple investments, this tracker gives you a clear and up-to-date view of how your portfolio is performing.
Perfect For:
Crypto traders who want to monitor their positions in real time.
Long-term investors looking to track the performance of their investments.
Anyone who wants a simple, visual way to measure their gains and losses in the market.

MA Crossover with Demand/Supply Zones + Stop Loss/Take ProfitStop Loss and Take Profit Inputs:
Added stopLossPerc and takeProfitPerc as inputs to allow the user to define the stop loss and take profit levels as a percentage of the entry price.
Stop Loss and Take Profit Calculation:
For long positions, the stop loss is calculated as strategy.position_avg_price * (1 - stopLossPerc), and the take profit is calculated as strategy.position_avg_price * (1 + takeProfitPerc).
For short positions, the stop loss is calculated as strategy.position_avg_price * (1 + stopLossPerc), and the take profit is calculated as strategy.position_avg_price * (1 - takeProfitPerc).
Exit Strategy:
Added strategy.exit to define the stop loss and take profit levels for each trade. The from_entry parameter ensures that the exit is tied to the specific entry order.
Flexibility:
The stop loss and take profit levels are dynamic and adjust based on the entry price of the trade.
How It Works:
When a buy signal is generated (MA crossover near a demand zone), the strategy enters a long position and sets a stop loss and take profit level based on the input percentages.
When a sell signal is generated (MA crossunder near a supply zone), the strategy enters a short position and sets a stop loss and take profit level based on the input percentages.
The trade will exit automatically if either the stop loss or take profit level is hit.
Example:
If the entry price for a long position is $100, and the stop loss is set to 1% while the take profit is set to 2%:
Stop loss level =
100
∗
(
1
−
0.01
)
=
100∗(1−0.01)=99
Take profit level =
100
∗
(
1
+
0.02
)
=
100∗(1+0.02)=102
Notes:
You can adjust the stopLossPerc and takeProfitPerc inputs to suit your risk management preferences.
Always backtest the strategy to ensure the stop loss and take profit levels are appropriate for your trading instrument and timeframe.

Bitcoin Exponential Profit Strategy### Strategy Description:
The **Bitcoin Trading Strategy** is an **Exponential Moving Average (EMA) crossover strategy** designed to identify bullish trends for Bitcoin.
1. **Indicators**:
- **Fast EMA (default 9 periods)**: Represents the short-term trend.
- **Slow EMA (default 21 periods)**: Represents the longer-term trend.
2. **Entry Condition**:
- A **bullish crossover** occurs when the Fast EMA crosses above the Slow EMA.
- The strategy enters a **long position** with a user-defined order size (default 0.01 BTC).
3. **Exit Conditions**:
- **Take Profit**: Closes the position when the profit target is reached (default $100).
- **Stop Loss**: Closes the position when the price drops below the stop loss level (default $50).
- **Bearish Crossunder**: Closes the position when the Fast EMA crosses below the Slow EMA.
4. **Visual Signals**:
- **BUY signals**: Displayed when a bullish crossover occurs.
- **SELL signals**: Displayed when a bearish crossunder occurs.
This strategy is optimized for trend-following behavior, ensuring positions are aligned with upward-moving trends while managing risk through clear stop-loss and take-profit levels.

Eze Profit Range Detection FilterThe Range Detection Filter is a technical analysis tool designed to help traders identify range-bound market conditions and focus on breakout opportunities. It combines the ATR (Average True Range) for volatility analysis and the ADX (Average Directional Index) for trend strength evaluation to highlight consolidation phases and alert traders when the market is ready to break out.
This indicator provides visual cues and customizable alerts, making it suitable for traders looking to avoid false signals during choppy markets and capitalize on trending moves following a breakout.
What Makes It Unique?
ATR for Volatility:
Measures market volatility by comparing ATR with its moving average.
Consolidation phases are flagged when ATR remains below its moving average for a sustained period.
ADX for Trend Strength:
Monitors trend strength, confirming range-bound conditions when ADX falls below a user-defined threshold (default: 20).
Combines with ATR to ensure accurate detection of trendless periods.
Breakout Alerts:
Notifies traders of breakout opportunities when the price moves outside the highest high or lowest low of the range.
How It Works:
Range Detection:
The market is considered "in range" when:
ATR is below its moving average, indicating low volatility.
ADX is below the threshold, confirming a lack of trend strength.
Visual Indication:
A yellow background highlights range-bound conditions, allowing traders to avoid low-probability trades.
Breakout Detection:
Alerts are triggered for breakouts above or below the range to help traders identify potential opportunities.
Features:
Range Highlighting:
Automatically detects and highlights range-bound markets using a yellow background.
Breakout Alerts:
Sends alerts for breakouts above or below the range once the market exits consolidation.
Customizable Inputs:
ATR length, moving average length, and ADX parameters are fully adjustable to adapt to various trading styles and asset classes.
Multi-Timeframe Compatibility:
Suitable for all markets and timeframes, including stocks, forex, and cryptocurrencies.
How to Use:
Identify Ranges:
Avoid trading when the yellow background appears, signaling a range-bound market.
Focus on Breakouts:
Look for alerts indicating breakouts above or below the range for potential trending opportunities.
Combine with Other Indicators:
Use volume analysis, momentum oscillators, or candlestick patterns to confirm breakout signals.
Credits:
This script utilizes widely accepted methodologies for ATR and ADX calculations. ADX is calculated manually using directional movement (+DI and -DI) for precise trend detection. The concept has been adapted and enhanced to create this comprehensive range-detection tool.
Notes:
This indicator is intended for educational purposes and should not be used as standalone financial advice.
Always incorporate this tool into a broader trading strategy for optimal results.

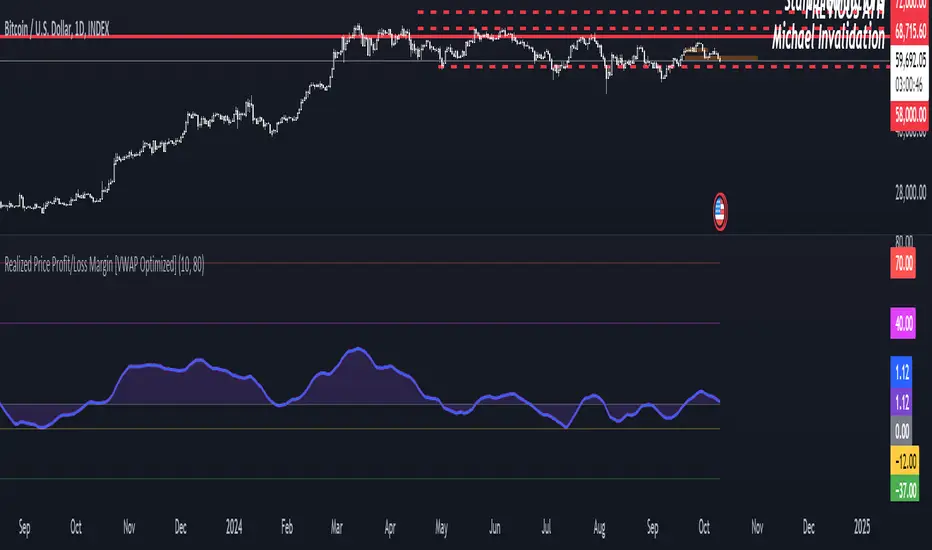
Realized Price Profit/Loss Margin [VWAP Optimized]Shaded Profit/Loss Margin Oscillator
The Shaded Profit/Loss Margin Oscillator is a powerful tool designed to measure Bitcoin’s Net Unrealized Profit/Loss (NUPL). This metric reflects the difference between Bitcoin’s current market price and its realized price, which approximates the price at which coins were last moved. By smoothing the NUPL using a moving average, the indicator provides a clean purple oscillator line that helps users easily gauge market sentiment. When the oscillator is above the zero line, the market is in profit, and when it is below zero, participants are generally in a state of unrealized loss. The shaded area between the oscillator and the zero line enhances visual clarity, making it easier to identify potential shifts in market behavior such as profit-taking or capitulation.
Unique Features and Added Value
What sets this indicator apart from traditional NUPL indicators is the use of a volume-weighted average price (VWAP) as a proxy for the realized price. Unlike the original on-chain NUPL metric, which relies on complex on-chain data, this indicator leverages VWAP to provide an approximation of realized price based solely on price and volume data available directly on TradingView. This method makes it highly accessible to traders who don’t have access to on-chain data platforms.
The use of VWAP not only simplifies the calculation but also provides additional value, as it incorporates volume into the realized price estimation. This volume-sensitive approach may offer a more responsive and dynamic reflection of realized prices compared to on-chain models, which can sometimes lag. In essence, this VWAP-based NUPL oscillator offers a unique edge in tracking profit/loss margins, particularly for traders who want a straightforward and efficient way to gauge sentiment without relying on external on-chain data sources. It brings the essence of NUPL into the world of technical analysis in an accessible and actionable way.
ATR Band, Stop loss , Take Profit Lines, and Pip Distance# ATR Band, Take Profit Lines, and Pip Distance Indicator
This indicator helps traders identify potential stop loss and take profit levels using Average True Range (ATR) bands and custom multipliers. It provides a visual representation of these levels and calculates the pip distance to stop loss, aiding in risk management and trade planning.
## Key Features:
- ATR-based upper and lower bands for potential stop loss levels
- Two take profit levels above and below the ATR bands
- Customizable ATR period and multipliers for bands and take profit levels
- Pip distance calculation to stop loss levels
- Adjustable colors for all elements
## How to Use:
1. The ATR bands (blue and red lines) suggest potential stop loss levels.
2. Take profit levels are shown as green lines above and below the ATR bands.
3. Labels display the pip distance from the current or last close to the stop loss levels.
## Customization:
- Adjust the ATR period and multipliers to fit your trading style
- Customize colors for better visibility on your chart
- Choose between current candle or last close for pip distance calculation
Remember, this indicator is for informational purposes only. Always manage your risk carefully and consider using it in conjunction with other analysis tools and your trading strategy.
Good luck with your trading!

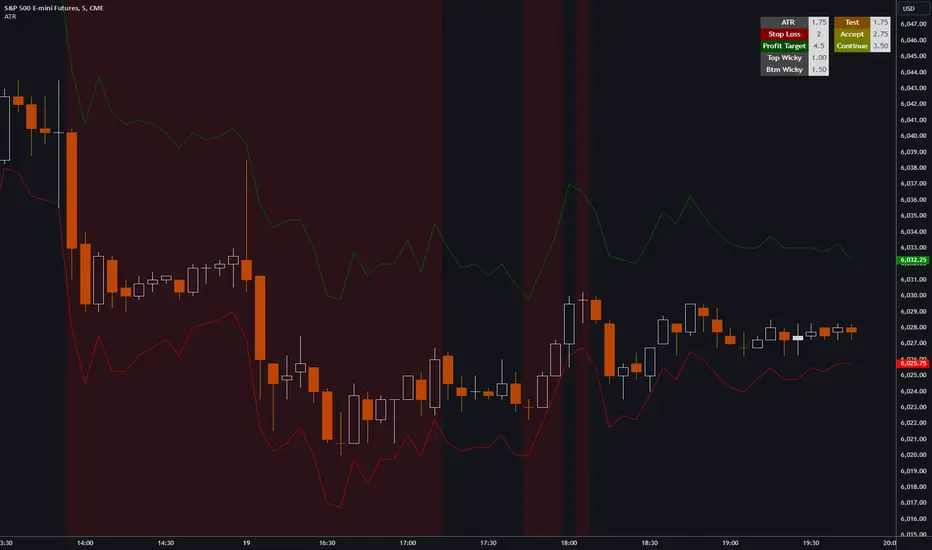
ATR, Chop, Profit Target and Stop Loss TableThe ATR Table indicator is a versatile tool that helps traders visually and quantitatively manage risk, identify market conditions, and set profit targets and stop-loss levels. It is designed to enhance decision-making by incorporating key volatility and chop (market consolidation) signals into a comprehensive table format.
Key Features:
Average True Range (ATR) Calculation : The indicator computes the ATR over a user-defined period (default 14). ATR helps to measure market volatility, providing insights into how much an asset's price typically moves within a given period.
Stop Loss and Profit Target Calculation : You can configure stop-loss and profit target levels using multipliers based on the ATR. This allows dynamic risk management that adjusts to market volatility:
Stop Loss : Defined as a multiple of the ATR to help control losses.
Profit Target : Also based on a multiple of the ATR to lock in gains. The user can specify whether they are trading long or short, and the indicator adjusts the levels accordingly.
Customizable Plot Lines : The indicator can display the Stop Loss and Profit Target levels directly on the chart. Users can toggle these lines on or off and customize their colors.
Chop Signa l: The indicator highlights potential consolidation periods (chop) using a wick-based analysis. It calculates the highest upper or lower wick values and compares them to the ATR to detect periods of indecision or consolidation.
Table Display : When these wick values exceed the ATR by a user-defined multiplier, the corresponding table rows are highlighted.
Background Alerts : Optionally, users can activate background color changes on the chart to visually alert them when chop conditions are detected.
Customizable Table Layout : A table displaying the key values (ATR, Stop Loss, Profit Target, Upper/Lower Wickiness) is placed on the chart. You can choose the table's position, adjust its color scheme, and decide which rows to display.
Chop Background Customization : For users who prefer more visual cues, the indicator allows you to enable or disable background shading when chop conditions are met. You can also choose the color of this background for better customization.
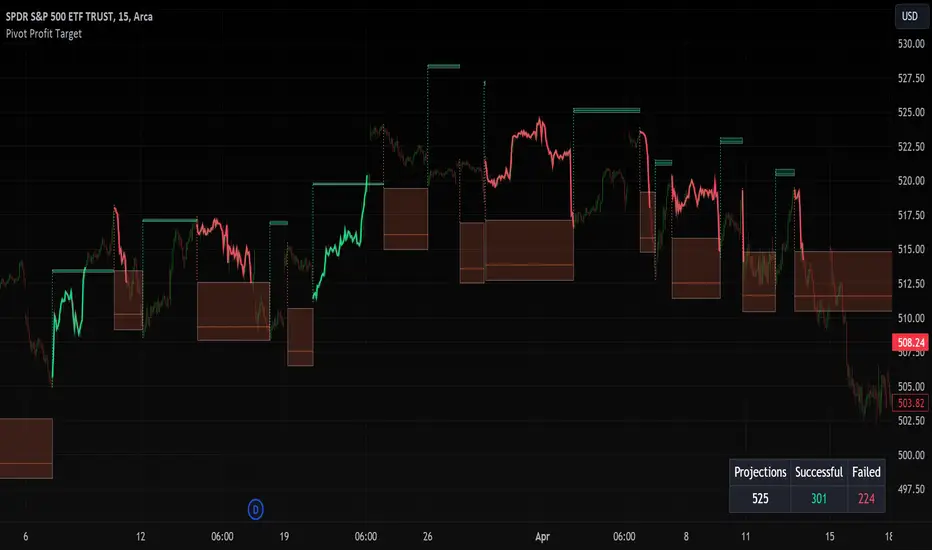
Pivot Profit Target [Mxwll]Introducing the Pivot Profit Target!
This script identifies recent pivot highs/lows and calculates the expected minimum distance for the next pivot, which acts as an approximate profit target.
The image above details the indicator's output.
The image above shows a table consisting of projection statistics.
How to use
The Pivot Profit Targets can be used to approximate a profit target for your trade.
Identify where your entry is relative to the most recent pivot, and assess whether the minimum expected distance for the most recent pivot has been exceeded. Treat the zones as an approximation.
If your trade aligns with the most recent pivot - treat the minimum expected distance zone as a potential profit target area. Of course, price might stop short or continue beyond the projection area!
That's it! Just a short and sweet script; thank you!
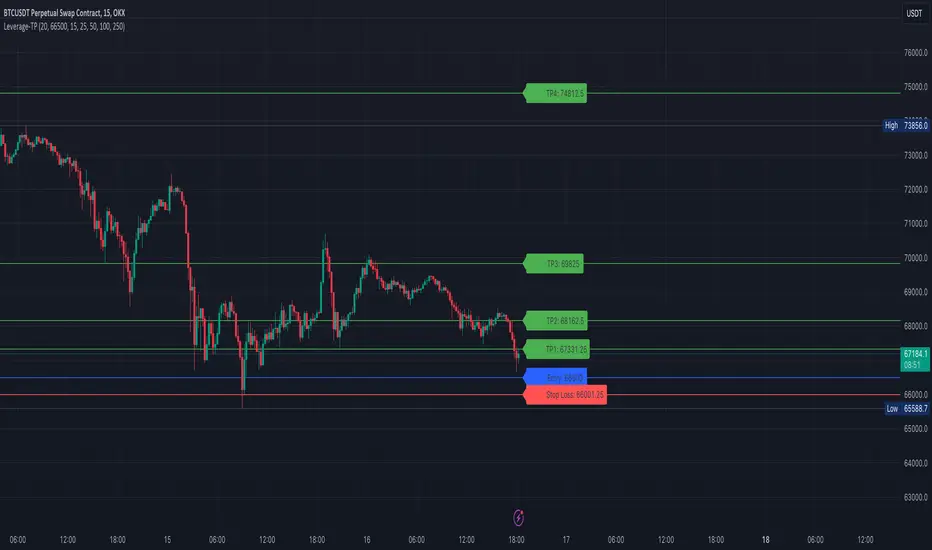
[S1B] Leverage Take-Profit-LinesShort Description:
The Leverage Take-Profit-Lines indicator assists traders in setting take-profit and stop-loss levels based on leverage, entry price, and risk percentage. It draws horizontal lines representing various take-profit levels and the stop-loss level on the chart, aiding traders in visually identifying potential exit points and managing risk.
Detailed Description:
The Leverage Take-Profit-Lines indicator is designed to provide traders with a visual representation of take-profit and stop-loss levels tailored to their leverage, entry price, and risk preferences.
Key Features:
Customizable Parameters: Traders can adjust parameters such as leverage, entry price, risk percentage, and whether to extend lines to suit their trading strategy.
Take-Profit Levels: The indicator calculates and draws horizontal lines representing different take-profit levels based on the specified percentage of leverage-adjusted entry price.
Stop-Loss Level: It calculates and displays the stop-loss level based on the specified risk percentage and leverage, helping traders manage risk effectively.
Visual Representation: The indicator visually highlights take-profit and stop-loss levels on the chart, facilitating quick decision-making for traders.
Usage Guide:
Setting Parameters: Adjust the input parameters including leverage, entry price, risk percentage, and other settings according to your trading strategy.
Interpreting Lines: Horizontal lines are drawn on the chart representing take-profit levels (TP1, TP2, TP3, TP4) and the stop-loss level. These lines indicate potential exit points and risk management levels.
As an example the TP1 can be used to sell 10% of position size, TP2 20%, TP3 20% and TP4 20-40%.
The Leverage Take-Profit-Lines indicator empowers traders with valuable insights into setting profit targets and managing risk effectively, contributing to more informed trading decisions.
NUPL - Net Unrealized Profit-Loss BTC Tops/Bottoms [Logue]Net Unrealized Profit Loss (NUPL) - The NUPL measures the profit state of the bitcoin network to determine if past transfers of BTC are currently in an unrealized profit or loss state.
Values above zero indicate that the network is in overall profit, while values below zero indicate the network is in overall loss. Highly positive NUPL values indicate overvaluation of the BTC network and relatively negative NUPL values indicate an undervaluation of the BTC network.
For tops: The default setting for tops is based on decreasing "strength" of BTC tops. A decreasing linear function (trigger = slope * time + intercept) was fit to past cycle tops for this indicator and is used as the default to signal macro tops. The user can change the slope and intercept of the line by changing the slope and/or intercept factor. The user also has the option to indicate tops based on a horizontal line via a settings selection. This horizontal line default value is 73. This indicator is triggered for a top when the NUPL is above the trigger value.
For bottoms: Bottoms are displayed based on a horizontal line with a default setting of -13. The indicator is triggered for a bottom when the NUPL is below the bottom trigger value.

Potential Profit at ATHUsage:
Enter how much of the particular coin you are holding within the settings area.
What this indicator does:
Grabs the current All Time High (ATH).
Uses the ATH to calculate the potential profit in percentage from the current price to ATH.
Calculates the potential profit in EUR based on the percentage in the previous calculation.
Displays the above-mentioned values on the screen as labels.
You now have a forecast of the potential profit you can make when you hodl to the ATH.
Attention: "The example uses 1 coin as default.
For a calculation of your holdings, make sure you enter the amount of the current coin you are holding"

Take Profit ModelThis Indicator allows you to define 9 Taking Profit levels between your floor price and a target price you define for 10 selectable Assets and tweak the levels to your preference. It does not do any fancy dynamic calculations, it just draws lines on the chart where you want them so that you have an easy reference for when to take profit (or not).
Example:
So, if your floor price for an asset is e.g. $10 and your target price is $110 (its up to you to define, who knows right, I do not have a crystal ball), You have a range of $100 where you can set your levels as follows
The first level is the Floor price you entered = $10
Formula: Level x (Target - Floor) + Floor = Take Profit level
Levels
0.1 x (110 - 10) + 10 = $20
0.2 x (110 - 10) + 10 = $30
0.3 x (110 - 10) + 10 = $40
0.4 x (110 - 10) + 10 = $50
0.5 x (110 - 10) + 10 = $60
0.6 x (110 - 10) + 10 = $70
0.7 x (110 - 10) + 10 = $80
0.8 x (110 - 10) + 10 = $90
0.9 x (110 - 10) + 10 = $100
And finally the last level is drawn for the target price
Target Price = $110
To change the settings, go to the cog icon of the Indicator, select the assets (Tickers) you have and next enter a value between 0 and 1 (as shown above) for each level, and if you want a different color. Instead of using 0.1-0.9 you e.g. can also use Fibonacci numbers like 0.235, 0.382, 0.618, 0.786 and disable (using the check mark) the rest of the levels. Experiment with this as you see fit.
Make sure that the chart you are looking at in TradingView is the same as you select in the indicator configuration e.g. COINBASE:BTCUSD should be selected as the chart as well as the Ticker in the configuration.
The Start date of the script is configurable (one date across all assets and levels)
The colors of the Levels is configurable (I am colorblind so go wild)
The standard values in the script are just examples, you need to determine the values that apply in your case and do your own research.
Your feedback is most welcome

Anticipated Profit Targets (APT)Anticipated Profit Targets (APT)
Purpose:
The Anticipated Profit Targets script is a specialized tool designed to assist traders in visualizing potential exit points for their trades. This is achieved by leveraging the Average True Range (ATR), a renowned measure of market volatility.
How It Works:
ATR Computations: At its core, the script calculates the ATR based on a user-defined number of periods. The ATR captures the range between the high and low prices of an asset over a specific duration, providing a snapshot of its volatility.
Multiplier Application: To fine-tune the profit targets, the ATR is multiplied by a user-defined multiplier. This step adjusts the ATR value, setting the profit targets at a distance from the current price, thus accounting for potential price movements.
Adaptable Timeframes: One of the standout features of this script is its adaptability. Users can select their desired timeframe for the profit target calculations. This flexibility means that a trader can be on a 15-minute chart but visualize profit targets based on the volatility of a 1-hour chart.
Visual Representation: The calculated profit targets are then overlaid onto the current chart. This visual aid provides traders with a clear perspective of potential exit points in relation to ongoing price movements.
Originality and Usefulness:
While the concept of using ATR for setting profit targets isn't new, this script's adaptability across timeframes and its user-centric customization options make it a unique offering. The combination of ATR with dynamic multipliers and timeframe adaptability ensures that traders get a tool tailored to their specific needs, rather than a one-size-fits-all solution.
Usage Guidelines:
After adding the script to the chart, traders can adjust the input parameters to their preferences. The anticipated profit targets will then be displayed, offering potential exit points. It's recommended to use these targets in conjunction with other technical indicators and chart patterns for a holistic trading strategy.
Features:
ATR Periods: The ATR is calculated using a user-defined number of periods. By default, it's set to 14 periods, a standard setting. The ATR gauges the asset's volatility, and adjusting the periods can increase or decrease its sensitivity to recent price fluctuations.
ATR Multiplier: The ATR is multiplied by a user-defined factor to determine the profit targets. With a default multiplier of 1.5, the profit target will be positioned 1.5 times the ATR above (for bullish trades) or below (for bearish trades) the current price.
Target Timeframe: Traders can choose the timeframe for which the profit targets are calculated. This feature enables viewing of profit targets from higher timeframes on the current chart. For instance, while observing a 15-minute chart, one can see the 1-hour profit targets.
Visual Indicators:
1. Two lines are plotted: the bullish target (in green) and the bearish target (in red).
2. At the onset of each new candle in the selected higher timeframe, labels indicating the precise profit target values are displayed.
3. Price scale labels also showcase the profit targets, offering a quick reference for potential exit points.
Customization:
Traders can modify the following parameters:
1. ATR Periods: Adjusting the number of periods can refine the ATR's sensitivity to price changes.
2. Multiplier for ATR: Tweaking this value alters the distance between the profit targets and the current price.
3. Timeframe for Profit Targets: A variety of timeframes are available, granting flexibility in viewing profit targets.
How to Use:
After integrating the script into their chart, traders can modify the input parameters as desired. The anticipated profit targets will then be overlaid on the chart, offering potential exit points. When used alongside other technical indicators and chart patterns, this tool can enhance trading decision-making.
Note: This script is designed for educational purposes and should not be considered as financial advice. Always conduct your own research and consult with a financial advisor before making any trading decisions.
