EMASAR Investor ModePLEASE READ THE FULL DESCRIPTION BEFORE BUYING OR USING THIS INDICATOR
THIS IS THE INVESTOR MODE ONLY VERSION OF THE EMASAR INDICATOR. IT INCLUDES THE ORIGINAL SIGNALS TELLING YOU WHEN TO BUY OR SELL. IT ONLY INCLUDES THE OCEAN TO INDICATE PULLBACKS AND NOT OTHER TRADING REGIONS ARE INCLUDED. IT SHOWS THE BUY/SELL SIGNALS AS WAS PUBLISHED IN THE ORIGINAL VERSION OF EMASAR
EMASAR (pronounced Emma-sar) is a strategy based on Exponential Moving Averages and the Parabolic SAR. This is a position trading approach that is derived from Tyler Jenks’ Consensio.
This strategy was developed with four objectives in mind: (1) managing risk (2) protecting from missing out on major moves (3) maximizing risk:reward (4) staying in a trending market and taking profit before it fully reverses.
EMASAR does a great job at accomplishing all of the above through the buy and sell signals that are generated. The data provided below is from the signals that occurred on Bitcoin ( Bitstamp ) from January 1, 2015 to present (November 11, 2019).
(1) Risk is tightly managed, relative to the winners, and losing positions will be exited before the market moves too far against.
The biggest losing trade on Bitcoin , for the time period outlined above, is -18.47%.
(2) Following the EMASAR buy and sell signals guarantees that one will not miss out on a major trend. As a result of the indicators used for this system it is mathematically impossible for a major trend to occur without providing a buy or sell signal. This system isn't meant to catch exact tops or bottoms but it will do a great job of capturing ~85% of a trend.
(3) On average the winning trades will be 5.55 times the losing trades. There will be stretches where the losers are bigger than the winners and this could last for many months, maybe even a year. However, over the long run the average reward is expected to be 5.55 times the average risk*.
*Past performance does not guarantee future results!
(4) This indicator was designed to capitalize on parabolic markets, specifically Bitcoin and alt coins. Crypto markets have a tendency to get moving so fast that many indicators become all but useless.
Entries can get signaled too late and exits will get signaled way too early. This is specifically true when using oscillators that are designed to identify overbought or oversold environments. EMASAR does a great job of keeping us in a position for the duration of a trend and this includes the major parabolic runs that Bitcoin has a tendency to go on.
When Bitcoin , or other alts, really get moving it can be very difficult to distinguish between a correction and a full reversal. We do not want to be exiting during a minor correction, instead this is a time when we want to be holding on or looking to buy the dip.
This is a very fragile balance. The market has a very strong tendency to make corrections looks like reversals and to make reversals look like corrections. Therefore it is very important to have a tool(s) that you trust to distinguish in between the two.
I believe that EMASAR is the best way to find that balance - if I knew of a better way then I would be using it instead!
Following these signals will help us to hold onto positions while the market is still trending in our favor when most think that it has moved too far / too fast, and it will also get us out before a market fully reverses.
Keep in mind that there will be times when we exit a market that is in danger of reversing, only to buy back higher later on. That is okay because it enables us to properly manage risk during times of uncertainty and buying back in at a higher price is more than worth the opportunity cost.
Risks
The biggest risks with trading EMASAR revolve around disobeying the signals. Risk management is built into this system with the exit signals that will occur, however it is up to the individual to execute those signals. Passing on an exit signal could lead to a big loss which would have a dramatic impact on the ROI . Most trading systems will have small and medium losses with small, medium and large wins. That is exactly how this works. The small - medium losses and wins will mostly be a wash and will account for roughly 80% of the trades. The large wins will happen about 20% of the time and will make up 80% - 90% of the profits.
Therefore the two biggest risks are passing on signals entirely, or exiting preemptively. Getting chopped in and out of a market can be quite frustrating. If you become overwhelmed with negative emotions then it could cause you to pass up on the next signal. That signal will often be the one that more than makes up for the small - medium losses that preceded.
On average EMASAR will provide one signal every 6 weeks when using the default settings on the 4h chart. Therefore missing one entry could turn an otherwise profitable year into a loser. If electing to trade a system, whether it is EMASAR or another, it is crucial to commit to taking every signal regardless of outside variables (namely your personal bias about market direction or frustration that follows a losing stretch).
Another major risk with this system is taking too much profit too soon. When getting into a trade that has the potential to be a big winner it can be challenging to continue holding through the swings. Anyone that has watched paper profits vanish will be inclined to start exiting after the market makes a big move in his or her favor. While this is better than watching profits completely evaporate, this mistake can be enough to turn a profitable system into one that loses to the market. If 80% - 90% of our profits come from 10% - 20% of our trades then it is vital we do not cut those positions off at the knees.
If taking too much profit too soon then you will consistently turn potential large winners into medium winners. This may lead to making money over the long run which will make it very difficult to realize that anything is wrong. However making money and beating the market are two very different things. Exiting early and making money is nearly as big of a risk as missing entries entirely.
If you have the discipline to execute signals in a timely manner after they are triggered and the emotional control to let the winners run despite the appearance of a vastly overbought / oversold market, then you should have what it takes to beat the market with EMASAR.
If you are not an experienced trader then it is very important to start out small. The only way to learn is to trade in a live environment and the only way to succeed is to risk much less than you can afford to lose. If you have $2,000 to trade with then start with a maximum position size of $20 - $50 and don’t be shy about scaling that down even further. Focus on ROI instead of actual dollars made. If you can return 100% on a $20 roll then you should be able to do the same with a $2,000 roll.
Important Notes
Make sure that you read / understand the risks outlined above. If you jump into this without understanding the unique risks that this system entails then you are going to have a bad time.
This indicator was developed around the 4h and that is where it works best. For crypto adjusting to higher TF’s will cause for bad results as the entries / exits will be late to the party. For traditional markets the Daily - Weekly time frames are preferred. It was not originally intended for smaller TF's but we have seen some good results on the 15m and 1h. The RSI can be a great compliment when using on smaller TF's. Adding a rule for not entering when RSI > 75 or < 25 and instead entering when RSI retests 50 will help to avoid some bad signals.
Alerts can be set for this indicator. Simply make sure that it is visible on the chart, then click the alert icon on the top panel. In the first dropdown set 'Condition' to 'EMASAR' and the second 'Condition' for the upcoming signal. For example if just entered long then set the second condition to 'Close Long' and you will be notified as soon as that signal occurs. If waiting for the next long entry then set the second condition to 'Open Long' so on and so forth . There is an 'All in One' alert that is also available. If you select that then you will be alerted any time that a signal occurs. The message will tell you to check the chart to see which signal caused the alert.
Cerca negli script per "profitable"
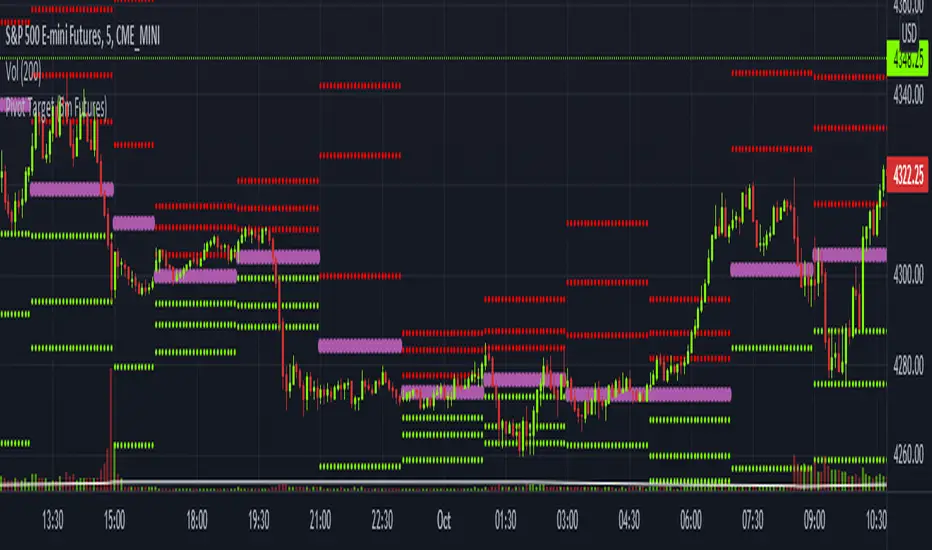
Pivot Target (5m Futures)I am new to both Futures Trading and Pivots. Looking for shorter-term profitable opportunities, I have investigated the use of pivots from a higher timeframe. All the work of this script is performed using two lines. It calculates the pivot from the previous 2-hour bar and draws this pivot line on the 5-minute timeframe. Many many times, the price will reach back to this pivot point - sometimes fairly quickly within the same horizontal pivot line and sometimes farther out (4-hours to 6-hours, or within the next few days). Price tends to reach the level around ninety percent of the time, making for plenty of short-term trading opportunities.
I get the best results when I see the price rise or fall from the pivot, along with a second indicator indicating a possible reversal (my favorite is Divergence for Many Indicators v4 by LonesomeTheBlue . Who knew divergence (both regular and hidden) was so common and useful for finding probable reversals? If I find the price above or below the pivot line with a second signal, I'll place a buy or sell within that same 2-hour window the price tends to return back to the higher timeframe pivot for a nice profit very quickly. Other times it does take a little longer to return with only a small percentage of time not returning within a reasonable amount of time, or very unusually, not at all. The image above shows a number of profitable trading opportunities using a combination of the Pivot Target and LonesomeTheBlue's Divergence for Many Indicators v4. You can further limit risk by only taking trades that are in the same direction of the overall trend, possibly confirmed on a higher timeframe.
This script will only be visible on the 5-minute timeframe the way it is written right now. I wouldn't suggest shorter or longer timeframes unless some editing is done by you. It doesn't seem to work as well with stocks, but is best on Futures due to the wave-like natures of the futures market. Trade safe, trade with the trend, use stops and limits appropriately and stay safe.
[CP]Pivot Boss Candlestick Scanner - No Repainting This indicator is based on the high probability candlestick patterns described in the ’Secrets of a Pivot Boss’ book.
The indicator does not suffer from repainting.
I have kept this indicator open source, so that you can take this indicator and design a complete trading system around it.
Although the patterns have some statistical edge in the markets, blindly using them as Buy/Sell Indicators will certainly result in a heavy loss.
I like some of these setups more than others, and I have listed them in the order of my likeness.
The first one I like the most, the last one, I like the least.
The patterns are universal and work well in both intraday, daily and even larger timeframes.
Signals in the example charts are manually marked by,
Hammer - profitable short signal
Rocket - profitable long signal
X - unprofitable long or short signal
GENERAL USER INPUTS:
These settings exist as the indicator uses ‘Labels’ to mark the patterns and Pine Script limits a maximum of 500 labels on a chart.
If you want to go back in the past and check how the indicator was doing, set the Start and End dates both and check the ’Use the date range above to mark the Candlestick Setups?’ option.
EXTREME REVERSAL SETUP:
This is by far my favorite setup in the lot. Classic Mean Reversion setup.
The logic, as explained in the book, goes like this,
1. The first bar of the pattern is about two times larger than the average size of the candles in the lookback period.
2. The body of the first bar of the pattern should encompass more than 50 percent of the bar’s total range, but usually not more than 85 percent.
3. The second bar of the pattern opposes the first.
The setup works extremely well in high beta stocks like Vedanta VEDL.
Feel free to play with the settings in order to better align this pattern with your favorite stock.
Check out the examples below,
No indicator is perfect, failed patterns are marked with an X.
OUTSIDE REVERSAL SETUP:
My second favorite setup, it is quite good at catching intraday trends.
Here’s the logic,
1. The engulfing bar of a bullish outside reversal setup has a low that is below the prior bar’s low and a close that is above the prior bar’s high. Reverse the conditions for bearish outside reversal.
2. The engulfing bar is usually 5 to 25 percent larger than the size of the average bar in the lookback period.
Settings for this pattern simply reflect these conditions. Feel free to modify them as you wish.
The pattern is pretty powerful and will sometimes help you catch literally all the highs and lows of the market, as shown in the examples of Vedanta VEDL and RELIANCE stocks below.
As usual, this pattern is not PERFECT either.
DOJI REVERSAL SETUP:
Doji candles signify market indecision and this pattern tries to profit off these market conditions.
Logic:
1. The open and close price of the doji should fall within 10 percent of each other, as measured by the total range of the candlestick.
2. For a bullish doji, the high of the doji candlestick should be below the ten-period simple moving average. Vice-versa for bearish.
3. For a bullish doji setup, one of the two bars following the doji must close above the high of the doji. Vice-versa for bearish.
Feel free to modify the settings and optimize according to the stock you are trading.
Don't optimize too much :)
This pattern works brilliantly well on larger intraday timeframes, like 15m/30m/60m.
This pattern also has a higher propensity to give false indications than the two described above.
Doji reversal typically helps to catch larger trend reversals. Check out the examples below from RELIANCE and NIFTY charts,
Note that the RELIANCE chart below is the same as shown for the Outside Reversal Setup above, notice the confluence of Outside
Reversal and Doji Reversal on the 31st August.
Confluence of patterns usually increases the probability of success.
RELIANCE 15m Chart - Pattern can catch nice trends on higher timeframes
NIFTY 15m Chart
WICK REVERSAL SETUP:
This pattern tries to capture candlesticks with large wick sizes, as they often indicate trend reversal when coupled with significant support and resistance levels.
Logic:
1. The body is used to determine the size of the reversal wick. A wick that is between 2.5 to 3.5 times larger than the size of the body is ideal.
2. For a bullish reversal wick to exist, the close of the bar should fall within the top 35 percent of the overall range of the candle.
3. For a bearish reversal wick to exist, the close of the bar should fall within the bottom 35 percent of the overall range of the candle.
This pattern must always be coupled with important support resistance levels, else there will be a lot of false signals.
The chart below is the same NIFTY chart as above with the Wick Reversal candles marked as well.
You can see that there are a lot of false signals, but the price also indicates ’pausing’ at important levels by printing a wick reversal setup.
You can use this information to your advantage when riding a trend.
FINAL WORDS:
Settings for various patterns simply reflect the logic described.
You will probably need to tweak and optimize the pattern settings for the stock that you are trading.
Higher Beta/Higher Volatility stocks are a great choice for these patterns.
Using these patterns at critical support and resistance levels will result in dramatically high accuracy.
Be creative and try to develop a proper system around this indicator, with rules for position sizing, stop loss etc.
You do not have to trade all the patterns. Even trading just one pattern with a proper system is good enough.
DO NOT USE THIS INDICATOR AS A BUY/SELL SYSTEM, YOU WILL LOSE MONEY.
Feel free to drop any feedback in the comments section below, or if you have any unique candlestick patterns that you would like me to code.

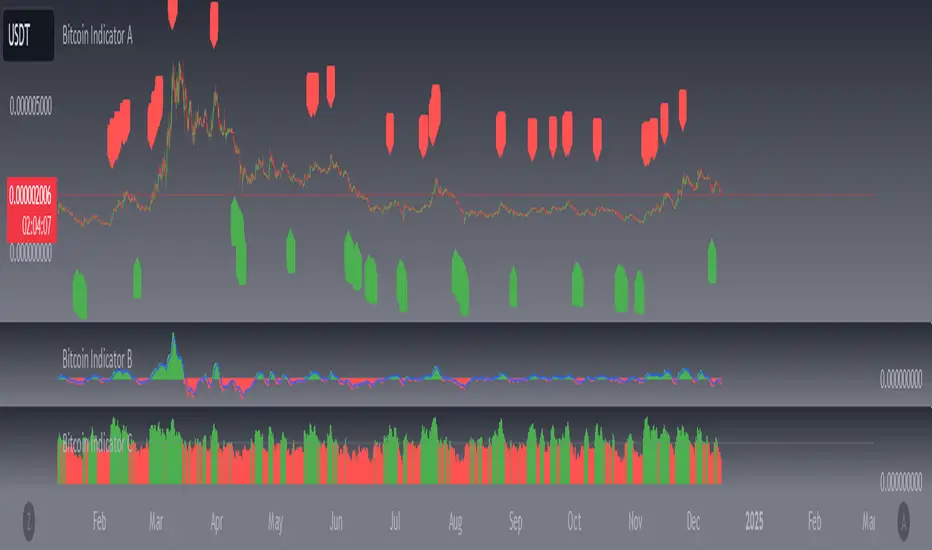
Bitcoin Indicator BThe Bitcoin Indicator was developed especially for high leverage Bitcoin trading. It comes in two parts; Bitcoin Indicator A/B. Indicator B shows the amount of money flow in & out the market in real time.
Indicator B must be used together with Indicator A. You can use it as the last confirmation after a trading signal on Indicator A. You can also look for divergence, trend continuation and trend dominance with it.
For example: There is a strong uptrend according to the Indicator A also a trend continuation signal appears. This case you won't jump into the trade immediately but check Indicator B. If there is a huge dominance on the positive side you can be pretty sure your trade will be profitable. If you rather look for trend reversal the best thing you can do is waiting for a divergence on the Bitcoin Indicator B and the price. If the Trend Cloud also shows weakness from Indicator A you can open your position.
Divergence usually comes with a new trend. So if you trade divergence you can use the Trend Cloud from Indicator A to identify trend weakness. When you see the weakness in the new trend there will be your exit point. If you do short-term trade you can also look for the top of the first hill on Indicator B right after the divergence.
There are 4 levels added to the indicator which are the grey lines. These will help you to identify the selling and buying power on the market. Also the lines can be changed manually and used for alerts.
The Bitcoin Indicator can be used on any timeframe. Also there are several strategies you can apply. For the other strategies you can read the Bitcoin Indicator user guide once you got access. For more information please go to the website.
Trade Central 2-Bars ScalperTrade Central 2-Bar Scalper is a scalping signal indicator based on short term price action using candlesticks. If 2 consecutive green candles form which are less than the max bar length defined in settings then indicator gives a buy signal. Similarly, if 2 consecutive red candles form then it gives a sell signal. It sounds very simple but it is a very powerful and popular scalping method. Along with the signal, you should pay attention to the candle formations, e.g. if there is a buy signal but you see a significant wick on top of signal candles then you may want to avoid that signal. Same for short.
Indicator shows bars in 3 colors - Green, Red and White. Signal candles, i.e. long and short, are green and red respectively. Rest of the candles are white and no action is needed when candles are white.
Trading using the script is simple - you enter a long trade on a green bar and enter a short trade on red bar. Detailed rules for trade execution are mentioned below.
Trading Rules
Recommended Timeframe: 3 minute
Go LONG after a green bar when signal candle high is broken. For example, on BTC chart if signal candle (green) high is 50000 then enter at least 3-5 points above it, i.e. 50003. If the signal candle high isn't broken then wait for that to happen, but signal/trade gets invalidated if the signal candle low is broken before signal candle high is broken .
Go SHORT after a red bar when signal candle low is broken. For example, on BTC chart if signal candle (red) low is 50000 then enter at least 3-5 points below it, i.e. 49997. If the signal candle low isn't broken then wait for that to happen, but signal/trade gets invalidated if the signal candle high is broken before signal candle low is broken .
For SL, we will use fixed profit and SL targets. For BTC, we recommend setting 100 points SL and 50 points target. That's a risk-to-reward of 1:0.5 which may look very bad, but the success rate of this strategy is very high (>70%) hence you would still be profitable. You can also try with 1:1 risk-to-reward ratio and that too should work fine though we haven't backtested it.
Default settings work best on 3 minute timeframe and has been tested on BTC. If you're applying the indicator on something else then ensure that you update the length as per security price you plan to trade. Will share backtested data and detailed explanation over a YouTube video.
Will strongly recommend paper trading in desired market/asset before executing live trades.

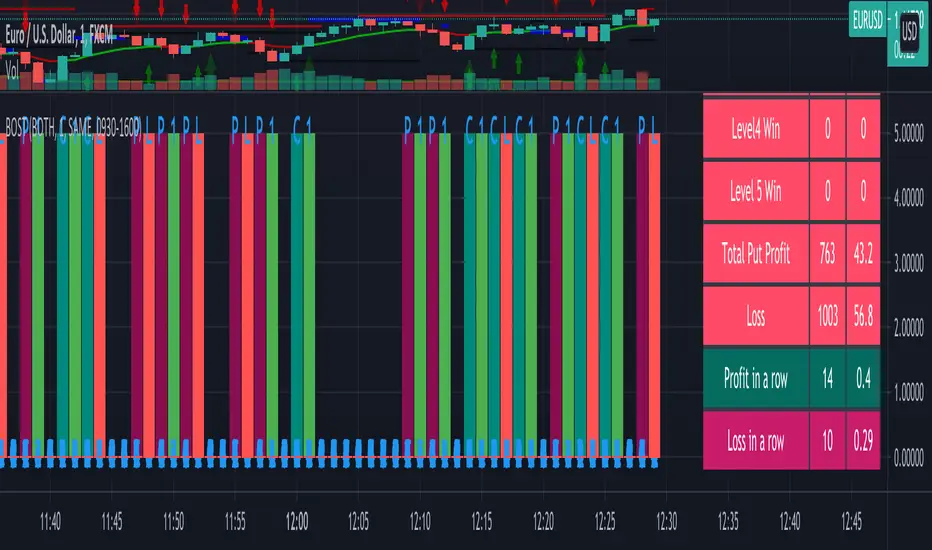
Binary Option Strategy Tester with MartingaleIn Binary options, strategy testing is a bit different. The script is just a try to test Binary options strategies.
Assumption:
We are opening position at next candle after signal come
We are taking the position at opening price
Our call will be profitable if we get a green candle and put will be profitable if we get a red candle
We can open only one trade at a time. So if we are in trade, subsequent signals will be ignored.
The script is not counting your profit or loss, it just counting the winning and losing trades.
Input Options:
Choose long only or short only test. Default is both.
You can continue your trade with Martingale Level, up to 5. Default is 1 (no Martingale)
You can choose Martingale trade type
SAME: if call subsequent trade will be call only and vice versa
OPPOSITE: if call subsequent trade will be put
FOLLOW CANDLE COLOR: Subsequent trade will follow previous candle color
OPPOSITE CANDLE COLOR: Subsequent trade will opposite of previous candle color
You can choose trading session to test. Default is false.
The strategy is taken from Vdub Binary Options SniperVX v1 (by @vdubus) . I have deleted extra parts and kept only the necessary part.
Without Martingale
Result Table
With Martingale
I am very new to Pine script, so waiting for your comments and review.
Random Buy Success Rate CalculatorI created a prior Success Rate Calculator to help me quantify the success rate of my invite-only indicator "SB Master Chart". Happy with the results of the calculator, I decided to create a calculator for a random buy.
This is a table addon that calculates in real-time the success rate of a random buy. I think this simple calculation can give you a good indication if you want to invest in a stock and what the odds are for it being profitable at anytime during your holding period. A stock with a low score might be one that you stay away from.
There are two configurable options.
Lookback Success Calculations (Bars)
This setting is used to determine what the success is for a random buy. For example. The script tracks purchases made at every bar and check the results bars in the future to see if at any time during that time it closed above the buy cost basis.
For example if the setting is 5, we would want a close above our cost basis within 5 bars from the random buy.
The longer you are willing to hold a stock, the higher you should set this setting. If you want to buy/hold a stock for 20 days, set it to twenty to see your odds of being profitable during that time period.
Lets use the daily chart as a quick example.
If today the signal goes off and we have a settings of five, in five days (5bars) if there is a close above todays close, we count that as a success. If there is not, we count that as a failure.
Start Date Settings
This setting is used to limit the amount of data we gather for testing. For example, we may want to only know how many successes we want since the start of the year. This is the default setting, you can set it for an earlier date in time if you wish to gather more data.
Future todo updates: Adjust cell color based on values. Right now its defaulted to green.

MBY_Quant_APOLOHello.
MBY_LAB.
Finally, I am happy to introduce this strategy.
The APOLO strategy uses the volume factor to estimate the fair price of a stock.
A buy/sell signal is calculated based on the “fair price” of a stock as defined by APOLO.
this indicator is a momentum indicator , and it can be said to be a non-trend following indicator.
The blue line that outputs as blue shows a graph of the asset change when buying or selling at the price pointed to by this indicator, including 0.2% slippage and 0.2% transaction fee.
Of course, this doesn't mean that this metric is always profitable.
This strategy was created to aid trading.
This indicator is a private indicator, please comment if you wish to use it.
**notice**
"Use the link(Invite only script Contact) below to obtain access to this indicator".

Price Moving Average Ratio & PercentileIntroducing the Price Moving Average Ratio & Percentile indicator
A simple indicator which calculates :
The ratio between a chosen source price and a user defined moving average ( PMAR ) or
The percentile of the ratio between the chosen source price and a user defined moving average over an adjustable lookback period ( PMARP )
It then displays either the PMAR or PMARP as a line plot with optional user defined signal moving average.
It also plots an optional Visual Alert Level line and background signal bars.
Indicator Settings
Main Properties :
Source Price .. choice of price values or external value from another indicator ( default )
Line Plot Type .. choice between PMAR or PMARP ( default PMAR )
Price Moving Average Ratio Settings :
PMAR Length ..The time period to be used in calculating the Moving Average for the Price Moving Average Ratio and the PMAR component of the PMARP. ( default )
PMAR Type ..The type of Moving Average which creates the MA for the Price Moving Average Ratio and the PMAR component of the PMARP. ( default )
Price Moving Average Ratio Percentile Settings :
PMARP Lookback .. The lookback period to be used in calculating the Price Moving Average Ratio Percentile.
Line Plot Color Settings :
Gives a choice between a user defined solid color, and a choice of "Blue Green Red", or "Blue Red" spectrum palettes.
Signal Moving Average Settings :
Signal MA Length ..The time period to be used in calculating the Signal Moving Average for the Line Plot ( default )
Signal MA Type ..The type of Moving Average which creates the Signal Moving Average for the Line Plot ( default )
Signal Moving Average Color Settings :
Gives a choice between a user defined solid color, and a choice of "Blue Green Red", or "Blue Red" spectrum palettes.
Visual Alert Level Settings :
Alert level .. Level which activates the background signal bars ( default )
Typical Use case for the Price Moving Average Ratio
Traders and Technical Analysts will typically use the PMAR as an accumulation signal generator.
To do this....
Set a level below 1 where it has been historically profitable to accumulate the asset in question on the chosen timeframe.
Typical Use case for the Price Moving Average Ratio Percentile
Traders and Technical Analysts will look at the PMARP to judge how far away current PA is away from the defined MA based on a statistical measure of the lookback period in a percentile format.
Traders and Technical Analysts will typically use the PMAR as an accumulation signal generator.
To do this...
Set a low level where it has been historically profitable to accumulate the asset in question on the chosen timeframe.
Note : The default settings are specifically set up for use on the daily timeframe with a MA of 140 equating (approximately) to the 20 week moving average.
This is not a stand alone indicator and should be used in combination with volatility and momentum indicators for a more effective trading edge.

Linear Regression & RSI Multi-Function Screener with Table-LabelHi fellow traders..
Happy to share a Linear Regression & RSI Multi-Function Custom Screener with Table-Labels...
The Screener scans for Linear Regression 2-SD Breakouts and RSI OB/OS levels for the coded tickers and gives Summary alerts
Uses Tables (dynamica resizing) for the scanner output instead of standard labels!
This Screener cum indicator collection has two distinct objectives..
1. Attempt re-entry into trending trades.
2. Attempt Counter trend trades using linear regression , RSI and Zigzag.
Briefly about the Screener functions..
a. It uses TABLES as Labels a FIRST for any Screener on TV.
b. Tables dynamically resize based on criteria..
c. Alerts for breakouts of the UPPER and the LOWER regression channels.(2 SD)
d. In addition to LinReg it also Screens RSI for OB/OS levels so a multifunction Screener.
e. Of course has the standard summary Alerts and programmable format for Custom functions.
f. Uses only the inbuilt Auto Fib and Lin Reg code for the screener.(No proprietary stuff)
g. The auto Zigzag code is derived(Auto fib).
Question what are all these doing in a single screener ??
ZigZag is very useful in determining Trend Up or Down from one Pivot to another.
So Once you have a firm view of the Current Trend for your chosen timeframe and ticker…
We can consider few possible trading scenarios..
a. Re-entry in an Up Trend - Combination of OS Rsi And a Lower Channel breach followed by a re-entry back into the regression channel CAN be used as an effective re-entry.
b. Similarily one can join a Down Trend on OB Rsi and Upper Channel line breach followed by re-entry into the regression channel.
If ZigZag signals a range-bound market, bound within channel lines then the Upper breakout can be used to Sell and vice-versa!
In short many possibilities for using these functions together with Scanner and Alerts.
This facilitates timely PROFITABLE Trending and Counter trend opportunities across multiple tickers.
You must give a thorough READ to the various available tutorials on ZigZag / Regression and Fib retracements before attempting counter trend trades using these tools!!
A small TIP – Markets are sideways or consolidating 70% of the time!!
Acknowledgements: - Thanks a lot DGTRD for the Auto ZigZag code and also for the eagerness to help wherever possible..Respect!!
Disclaimer: The Alerts and Screener are just few tools among many and not any kind of Buy/Sell recommendations. Unless you have sufficient trading experience please consult a Financial advisor before investing real money.
*The alerts are set for crossovers however for viewing tickers trading above or below the channel use code in line 343 and 344 after setting up the Alerts!
** RSI alerts are disabled by default to avoid clutter, but if needed one can activate code lines 441,442,444 and 445
Wish you all, Happy Profitable Trading!

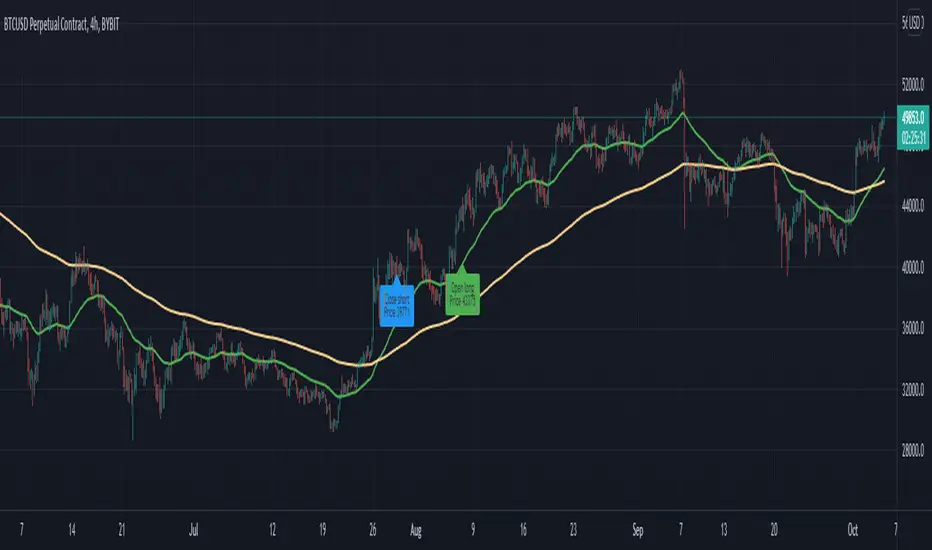
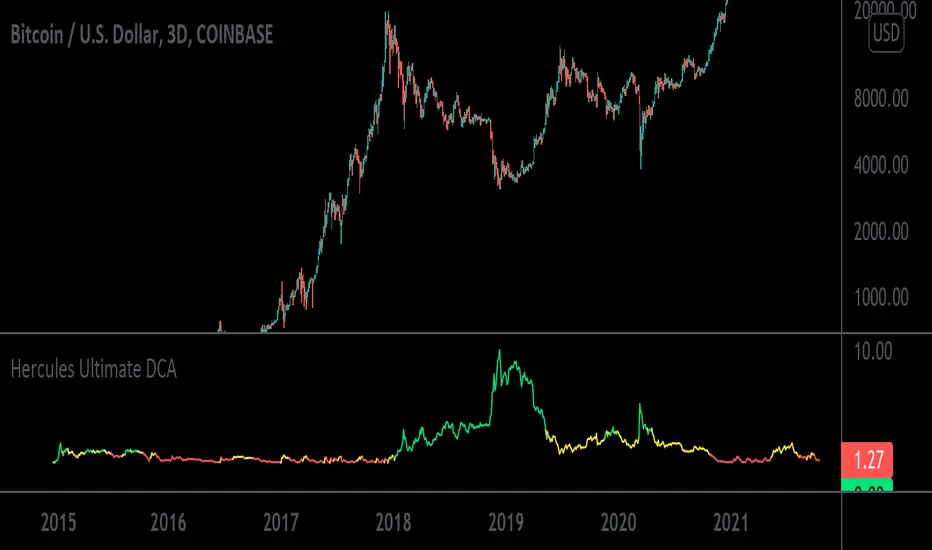
Hercules Ultimate DCA™The Problem Most People Face When Trading & Investing:
If anyone tells you they know where the market is going, they’re either lying or they’re time travelers.
The truth is NOBODY knows whether the markets will move up or down tomorrow, next week, next year, or over any period of time.
If we all knew, we’d all be rich. What would suit most Investors is to Invest consistently over long periods of time into sound financial products.
When Creating This Investing Tool We Had 5 Requirements in Mind:
1. To create a tool that ANYONE with little to no experience could use to outperform 95% of traders and speculators.
2. To ignore the Charts, Candlesticks, Indicators, and Volatility in any market so you can rest easy at night, never having to look at the price of your asset and still remain profitable.
3. To create a tool that tells you exactly HOW MUCH to invest every day or week which takes the stress away in guessing which direction the market will go.
3. To minimize your risk and and exposure to downside even if you started buying a crypto at or near the top of a market.
4. To buy a crypto at or near the bottom of every single major swing or trend.
5. To make Investing Easy, Simple, and Fun for the average joe.
We achieved that goal with the Hercules Ultimate DCA™ Tool!
WHO Created it & HOW was it Created?
This tool uses complex math and an algorithm designed by a Quantitative Military Mathematician (who wishes to remain anonymous, so we’ll call him Satoshi) over a period of 5 and a half months.
To start, we wanted to keep things simple, and extensively researched 6 of the top investing strategies of all time:
1. Buy and Hold
2. Active Investing
3. Dollar Cost Averaging
4. Index Investing
5. Growth Investing
6. Value Investing
Most of the strategies above work well depending on your goals or how risk adverse you are, however most DO NOT check off all of the requirements we mentioned above. Comprehensive home-work and price-action history in Cryptocurrency Markets led us to the Dollar Cost Averaging (DCA) Strategy.
According to Fidelity,
“Dollar Cost Averaging is a strategy where you invest your money in equal portions, at regular intervals, regardless of which direction the market or a particular investment is going. In other words, your purchases occur regardless of the changes in price for the stock or other investment, potentially helping reduce the impact of volatility on the overall purchase.”
With this in mind our High IQ math friend got to work and formulated over 17 Different Variable Algorithms on the DCA Strategy before arriving to the one we named Hercules Ultimate DCA™.
WHY the Hercules Ultimate DCA™ Works BETTER Than Anything Else.
Rigorous backtesting & forward-testing led us to create what we believe is the most effective and efficient strategy to extract the most money from the markets while at the same time minimizing nearly all the risk when investing your hard earned money in small increments in a truly effortless way.
The Hercules Ultimate DCA™ is essentially a DCA strategy put on steroids because no two investments are alike.
As we mentioned above, a traditional DCA approach assumes you purchase the same dollar amount of any asset at scheduled times, no matter where the price of your purchased asset is.
Example: If you have $1,000 dollars and decided to invest 50 dollars per week into Bitcoin, you would invest over a period of 20 weeks before you run out of money. Now, let’s assume the price of bitcoin is 50k during your first week, you would invest $50 dollars. Then next week the price rises to 60k, you would still invest $50 Dollars. The third week, if the Price of BTC rose to 70k, you would invest $50 dollars, so on and so forth. This approach is flawed because although you would still do better than many speculators and traders over a long period of time, it essentially leaves you penniless at the end of twenty weeks with no gunpowder left to buy BTC if it drops to all-time lows.
The Hercules Ultimate DCA™ works so well because it tells you to invest less as the price goes up and far more if the prices drops. What feels counterintuitive to most investors is typically what provides the most returns. Take the example above. If you have $1,000 dollars to invest weekly and Bitcoin currently sits at 50k, you would start by investing $50 dollars. Then next week, let’s say BTC rises to 60k, you would now invest $30 dollars. And your third week, BTC reaches 70k, you would now invest $10 dollars. Not only does strategy preserve your capital but it tells you to invest less into an asset at all time highs and far more into an asset at lows.
Now obviously the math in this tool is more complex, but it’s also more cost effective. At the time of writing this, the current Crypto Market has tanked from all-time-highs. Bitcoin currently sits at a price of $32,000 and is 51% down from its high of $64,900 dollars.
Just using this tool over the last 6 years, you would have invested a total of $5758.71 dollars and accumulated 4.328 Bitcoins for an average purchase of $1330.34 dollars. Your current Portfolio value would be $138,519.77 for a whopping percentage gain total of 2305%.
In other words, even with this massive crypto dump, you’d be rolling handsomely in your profits and you’d feel pretty smart too.
What’s more unique is that the Hercules Ultimate DCA™ will ALWAYS tell you to Invest More Dollars at the Literal Bottom of ANY market.
Dips in a market you believe in are far more exciting and will provide far more returns. The only way this tool fails is if the user (you) choose a market that goes to zero or is a rugpull.
How Do You Use the The Hercules Ultimate DCA™?
Step 1: Scroll to your “Invite-Only Scripts” in your indicators tab on Tradingview, then click on the indicator titled, “Hercules Ultimate DCA.”
Step 2: You should see the Indicator Populate at the Bottom of your chart with two lines, the Green line indicating how much you should buy that day, and the Blue line indicating how much of the asset you’ve purchased.
Step 3: (If you haven’t already) Make sure you turn on the Indicator Label. Navigate to the top right of the Crypto Product you would like to purchase and you will see a small settings gear. Once open, navigate on the left-hand side to the “Scales” tab and find the “Indicator Last Value Label.” Make sure it’s turned on and you will see the direct price.
Step 4: The amount you invest will now populate on the right hand side of the indicator with a number. That’s the exact dollar amount you invest in a disciplined manner no matter how large or small the number may seem.
Step 5: Get familiar with the indicator by opening the settings on the indicator itself. You will notice on the first tab it has a multiplier. If you increase it to 2, then the indicator will tell you to invest double the amount. If you input 10, then it will tell you to invest 10x the amount.
Step 6: Choose a Chart Timeframe and time of day to invest. If you choose to go with a once weekly investment then we recommend you increase your multiplier. If you choose a daily investment (and lack the necessary capital to invest large amounts daily) then we recommend keeping your multiplier down to lower numbers incase we see a lot of volatility. For most folks, once weekly on a 10x multiplier is most convenient. Set your chart to a weekly time-frame and increase your multiplier to 10. Then each week around the same time, you must invest.
Step 7: STAY DISCIPLINED. This method and tool only works if you invest the exact amount it tells you to invest over sustained periods of time.
Step 8: Enjoy Investing Made Easy 🙂
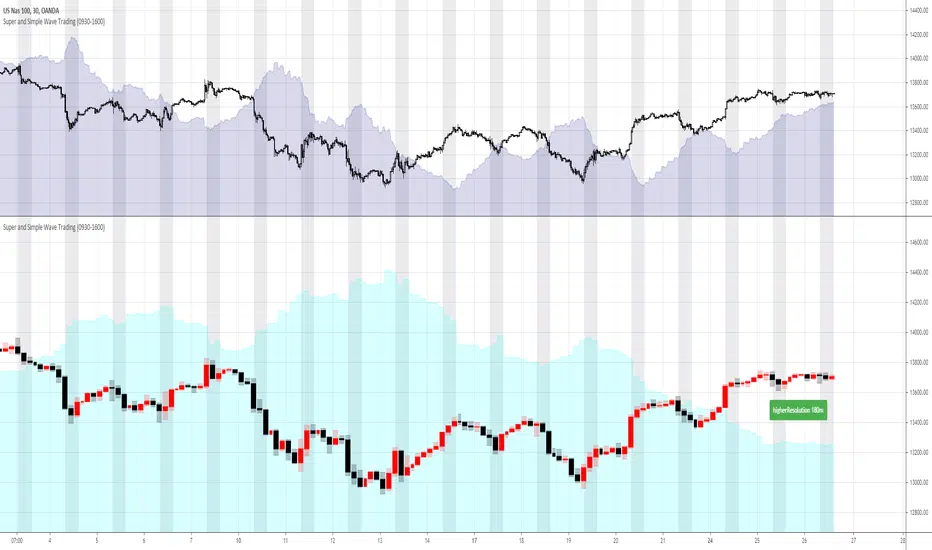
Super and Simple Wave Trading
According to Dow theory, market has three movements, main movement, medium swing and short swing.
Dow theory is very easy to understand with multiple time frame, and probably we can say real market has more than three movements. For example, every time frame, whether it’s 1min, 5 min 30min or Day, Week, Month, has its own ups and downs, like waves in the ocean.
“Super and Simple Wave Trading” presents underlying reverse “price waves” in each time frame. With easy and simple plot, one can intuitively see when the price is above the ocean or under the water. This advanced algorithm is purely rely on price movement and it targets to filter out most noises with super fast response to the price movement.
Besides plotting current resolution wave, “Super and Simple Wave Trading” also plots higher resolution bar and higher resolution wave under current resolution. For example, if current chart resolution is 1min, this indicator can plot 1min wave and 5min bar and wave.
When use this indicator, recommend plotting 2 panes on your screen, upper pane is current resolution candles with current resolution wave, the below pane is higher resolution bar and wave. So one can always get a very clear picture that how price is moving under different time frame. Recommend time frame chain in this indicator is 1m-5m-30m-180m-D-W.
The wave(shaded color area) is plotted under light(white) background, black background won’t show clearly
Some trading suggestions:
While having a whole picture of higher or even higher resolution price wave, always focus on your comfortable current time frame, surf on it. Whether it’s stop loss or taking profit, it’s happening on current wave.
Do not over trading is still a golden rule. Especially in a ranging market, like after hours stock market, the range is so tight that trading is not profitable. Although with this indicator, the loss is always minimal, however, remember the saying: “death by a thousand paper cuts”
Stop loss is always strongly recommended. “Super and Simple Wave Trading” will directly show you the entry and when to exit, however, stop loss is always the last line of defense to protect you.
GODXBT Scalper 15minGodxbt scalper is specifically designed for short term trades on 15min timeframe
This indicator is based on price action
What this indicator includes:
1) BULL,BEAR signals based on price action
2) 3 EMA(exponential moving average) for the market trend/direction .
3) take profits points ( based on oscillators ) shows overbought and oversold conditions.
How to trade :
This indicator works on 15min timeframe the parameters for the indicator is locked for 15min timeframe
***Important: Signal confirms on bar close
1) “BULL” signal shows buying opportunity
Buys are more profitable than sells if EMA ribbon is blue which means bullish trend (buyers are in control)
2) “BEAR” signal shows selling opportunity
Sells are more profitable when EMA ribbon is red which means bearish trend (sellers are in control)
3) TP+ and TP- appears below and above candles it shows the potential reversal points for the price action
There you should take some profits off the trade
Ema ribbon shows market trend
Default ema inputs are set on 20 and 50 (you can add your own sets of ema by changing the input )
Blue ribbon is bullish trend which also acts as a support
Red ribbon is bearish trend which also acts as a resistance
You can use ribbon to add stoploss below and above the ribbon
222 EMA for strong support and resistance
DM for the access

ALT SeasonALT season shows a bullish crypto market when BTC is less profitable than Altcoins.
Therefore, traders can sell their BTC and buy Altcoins to gain more profit. Having an indicator that shows Alt season can be very useful.
To use this tool, you need two coins:
1- Main coin like BTC (you may use TOTAL or ETH, BCH)
2- Alt coin like TOTAL2 (you may use any coin rather than BTC and TOTAL)
Lets say we want to exchange Tron (TRX) with BTC or ETH.
Many Brokers (like Binance, CoinBase, ...) let us to trade TRX/BTC and TRX/ETH.
For example, if you have ETH and ETH market is sideways. Then you may sell ETH and buy TRX. To see wether this exchange is profitable, you can set main coin to ETH/USDT and alt coin to TRX/USDT.
The gray bars shows Alt season and buy opportunity in Alt coin markets.
You may leave a like if you find this script useful.

CUT MY LOSSESS - Levereged Stop loss + R / R ratio checker Hello traders!
We have heard many times that keep your losses small and allow your profits to grow. But what happens is that we often make the mistake of doing high-margin trades that we cannot afford to lose. The main reason for this problem, in my opinion, is the rush to open a position and not paying attention to how much acceptable loss in each trade is for us? Is our stop loss point compatible with the loss we are willing to accept?
Many of the losses we incur are not due to our erroneous analysis but to the wrong trading strategy, miscalculation of Stop Loss and failure to calculate the Risk/Reward for each trade. At least for most novice traders, these mistakes happen .
This script does not have complicated logic and is designed only as a help for those who are not interested in working with calculators !! I hope that sometimes that we are very excited to buy, looking at this script can give us a serious flip to avoid risk .
This is a basic script that helps us to intuitively check our stop loss in according to our leverage and to guess the approximate risk/reward of our trade. This script assumes that you always trade with half of your total capital. It is also assumed that you routinely use up to ten percent of your capital for each trade. Therefore, the first variable in this script is the amount of tolerable loss in each trade for you, which is set to 25% by default. So if you follow the previous assumptions, each trade will endanger 2.5% of your capital.
Since not all analyzes are ever accurate, we need to enter into positions that have good Risk/Reward ratio, so that even if half of our analysis fails, we will profitable. Therefore, the second variable in this script is the acceptable Risk/Reward ratio for us, which is set to 1:4 by default.
Also, to check the efficiency of the stop-loss with different trading leverage, I add five leverage by default from 1 to 5 as lines on the side of your stop-loss point.
LeV A (Lowest Leverage-WHITE): 1 by default
LeV B (AQUA): 2 by default
LeV C (YELLOW): 3 by default
LeV D (ORANGE): 4 by default
LeV E (Highest Leverage-RED):5 by default
You can change all these leverages and Acceptable margin loss and R/R ratio according to your needs.
You can also hide the leverage lines you are not dealing with through the script settings .
You will also see lines on the side of your target point to check your risk/reward ,so you can approximate your target according to your trading leverage and the risk/reward you accept. you can also hide these R/R lines from the setting.
Important Note: This script is not designed to give you a stop loss point or take profit point.
To find these points, you must use technical analysis methods , and then use this script to check the coordination of these points with your trading strategy.
Using the script is simple, but I will try to explain it with a few examples.

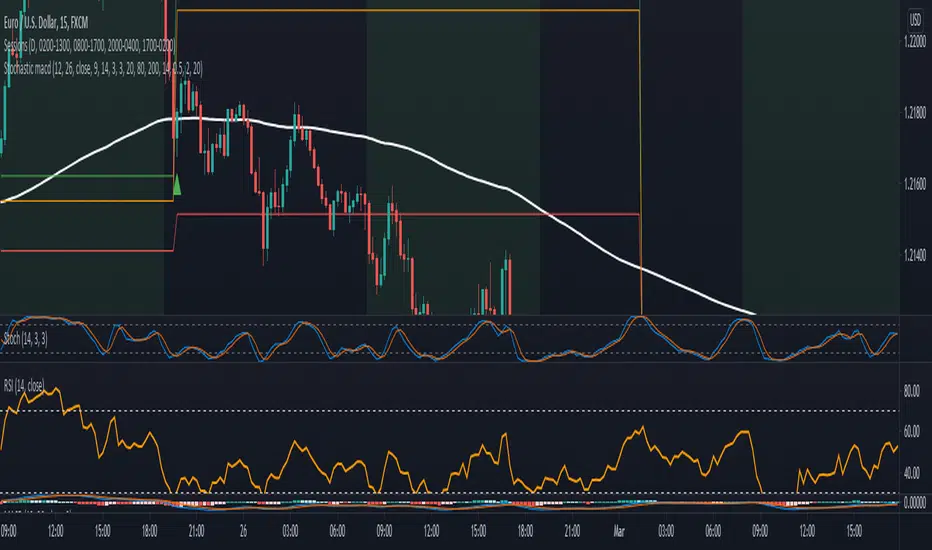
Stochastic with MACD filter + SL/TP + AlertsLong Arrow : close of the candle is above ema + Stochastic is oversold + MACD is below 0 + Stochastic cross up
Short Arrow : close of candle is below ema + Stochastic is overbought + MACD is above 0 + Stochastic cross down
Also added SL, 1:1 and TP where SL can be varied by ATR value and TP is set to 2:1 RR but it can be varied too.
It is not meant to take every single trade even though that might already be profitable.
For higher winrate look for the higher timeframe trend for example when trading the 15min look if the Daily 8ema is going up or down.
Also only take trades when there is either a hidden divergence on RSI or a smaller normal divergence.
The I take the normal divergenes alo when there is no higher high like an M or lower low for longs like a W these tend to work out pretty good too.
Alerts are in it too.
Have Fun :)
Floor Pivots With CPR and Camarilla 3 LevelsThis script plots floor pivots with the central pivot range and camarilla R3/S3 pivots, to spot with ease the Golden Pivot Zone (GPZ). As described in the book *Secret of a pivot Boss* by Franklin Ochoa, the Golden Pivot Zone occurs when R3 or S3 pivot from the Camarilla Equation or from lies within the central pivot range. This combination can be simply profitable.
A bearish GPZ occurs when R3 of the Camarilla Equation is mixed within the central pivot range, therefore we should look for sells in that zone.
A bullish GPZ occurs when S3 of the Camarilla Equation is mixed within the central pivot range, therefore we should look for buys in that zone.
Here are some examples on Gold
Good luck !
Ps* i got part of the code from @cristian.d script

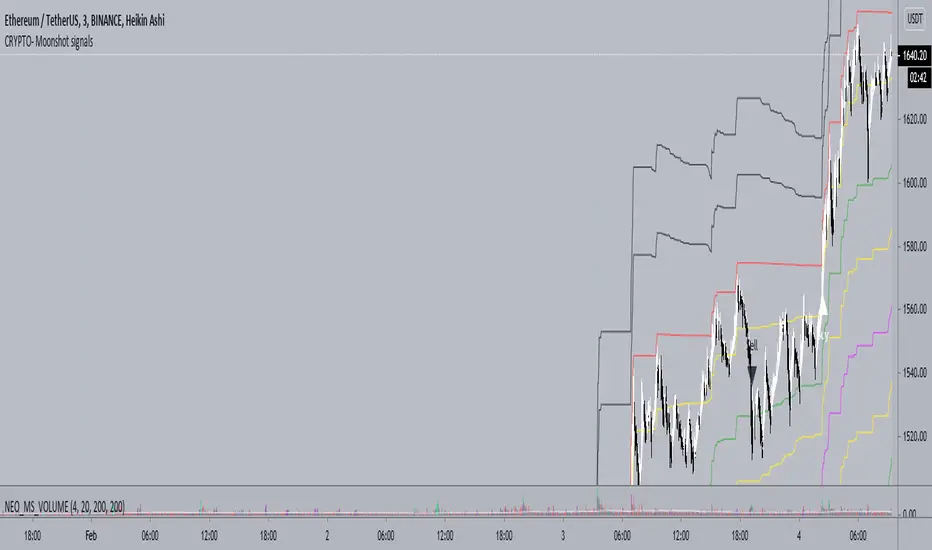
Neo_BTC - CRYPTO - Moonshot signalsCRYPTO - Moonshot signals indicator is designed to work well in trending markets and scalping using the levels in sideways market
FAQs
1. What is the optimal TF (Time Frame) for the indicator?
A. 3 min HA (Heikin Ashi) Candles
2. Will it work on other TFs?
A. Yes, 1min works well as well but less profitable. 1min TF is recommended during High volatility .
3. What does the levels do?
A. There are two levels Buy (B) and (S) Sell which is separated by mid level M.
Above mid level is bullish and below bearish .
As you get the Long or short signal, partially reduce your position at each levels to reduce risk and maximise profits.
4. How to scalp trade on the levels?
A. Depending on the trend you can short or long between the levels
5. How often the signals fire?
A. Only few in a week. But the levels are optimized for swing trades and works well. You are welcome to setup a grid bot to trade between the levels
6. I can only see Sell Labels - no Buy labels?
A. Sell labels are Black and Buy labels are White in colour. So if your TV background is white or black, the labels may not appear. You can change color in the indicator settings.
7. Will it work for Alts?
A. Yes, Alts and other tickers.
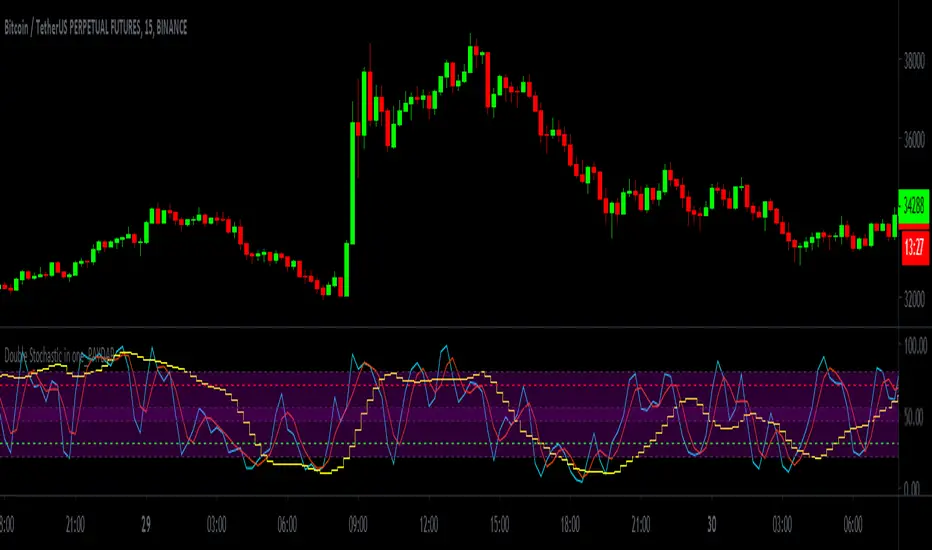
Double Stochastic in one_PAYDARDouble Stochastic in one_PAYDAR
Hello dear friends;
Double Stochastic in one_PAYDAR function:
It actually means that I have used two stochastic oscillators in one oscillator with several lines in different degrees,
First Stochastic: or "Fast Stochastic", as its name implies, is a stochastic oscillator with fast parameters and is capable of detecting small oscillations and small trends.
Second Stochastic : or "slow stochastic" means a stochastic oscillator with slow parameters and is capable of detecting slightly larger fluctuations and trends.
(Of course, here I just put parameter D, because I did not want it to be crowded.)
*** This system just Suggests you for points. ***
_____________________________________________________________________________
How to use this system ( just Suggests you) :
Buy: Whenever the first stochastic (fast stochastic ) crosses in the range of 20 or below and moves upwards, and at the same time the second stochastic (slow stochastic ) moves or crosses the green 30 line, a good time To buy or take a long position.
Sell: Whenever the first stochastic (fast stochastic ) crosses in the range of 80 or above and moves down, and at the same time the second stochastic (slow stochastic ) moves or crosses the red 70 line, a good time For sale or short position.
_____________________________________________________________________________
*** This system just Suggests you for points. ***
My suggestion is not to use this system alone and conclude about entry and exit points according to charts, news, market fluctuations and trend direction.
This system was created by Stochastic Oscillator, which is public and open source on the TradingView site.
***I used the Stochastic Oscillator as a public domain and open source on the TradingView site***
In fast stochastics the values of the parameters are set as fast motion and in slow stochastics the values of the parameters are set as slow motion. In fact, these values of the parameters according to the function and price movement in the candles are fast and slow, and I have determined these values at my suggestion, which, of course, I have consulted with several people.
For easier use and personalization for each person, I have left access to the parameters in this system and you can easily change the parameters as you like and use it optimally for yourself.
Of course, my suggestion is to use the numbers and values of the parameters I have written.
I have put different values, which I think will be very useful for trading swings and even below the daily, but you can change the values of different parameters to your liking.
This oscillator is made of a stochastic oscillator that is open source and public on the TradingView site , of course, due to the changes I have made in the parameter values and the inclusion of two stochastics in one oscillator.
*** In this system, the main and basic oscillators is used, It is available as open source and public on the TradingView site ***
Please comment on the use of this oscillator as well as how to use it and your experiences, I will definitely welcome comments and criticisms.
I am very grateful and very loyal to TradingView ,
Be successful and profitable.
OGHAWKThis indicator is based on Vol flow, MACD , RSI , BB , WMA's. The bars are color coded so it is very simple to use for all types of traders. You simply long/buy when the bar colors flip green and Sell/short when the bar colors flip red. To eliminate false biases and signals I have added the HFT trendbar ( you can access this in settings ) which will be displayed on top of the chart for you to stick to the longer term bias. I have also added Chop filter logic which helps eliminate most false signals and helps you stay longer during uptrends/downtrends as you can see on the chart. The gray Area is considered as chop and you simply hold your positions that you are in.
I hope you guys love using this and are profitable.
Here's to financial freedom.
- HawkEyE

Ehlers 2 Pole Super Smoother Filter V2 [CC]The 2 Pole Super Smoother Filter was created by John Ehlers (Cycle Analytics For Traders pg 32) and this follows the price very closely and very useful because it is consistent with uptrends and falls sharply during a sudden downtrend so it should be able to help you stay more profitable. Buy when the indicator line turns green and sell when it turns red.
Let me know if there are other indicators you would like to see me publish or if you want something custom done!

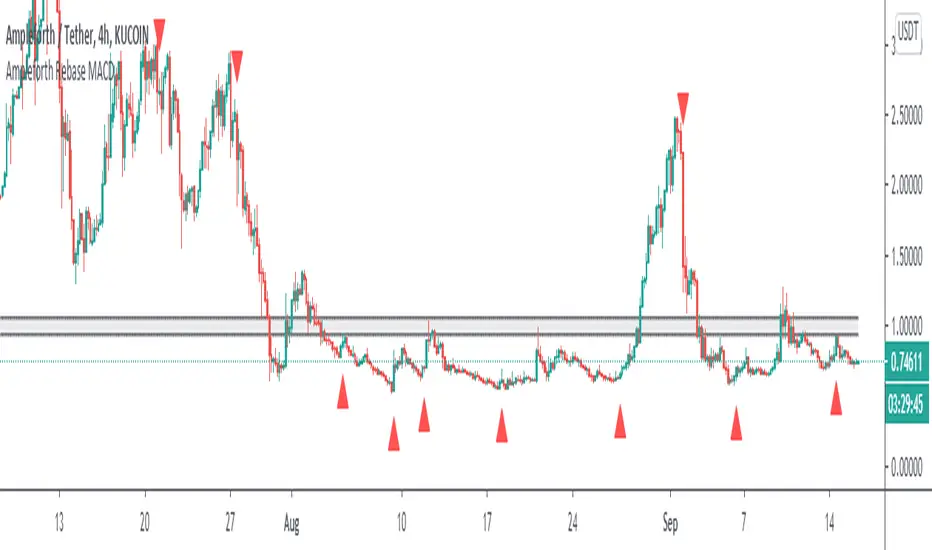
Ampleforth Rebase MACDThis script reveals Ampleforth rebase levels which are going to always work. In addition to that is MACD crossovers serving as potential buy/sell entries. You can set alerts for MACD crossovers and price entering balanced value area (0.96 - 1.06).
MACD signals can be used to automatically open a position and entering a balanced value area can be used as take-profit. Since the price will always move to this level, using this strategy without leverage should be profitable.
Ampleforth seems like a nice asset to trade since it is unlikely to correlate with anything else. At least not when it gets to the extreme levels.
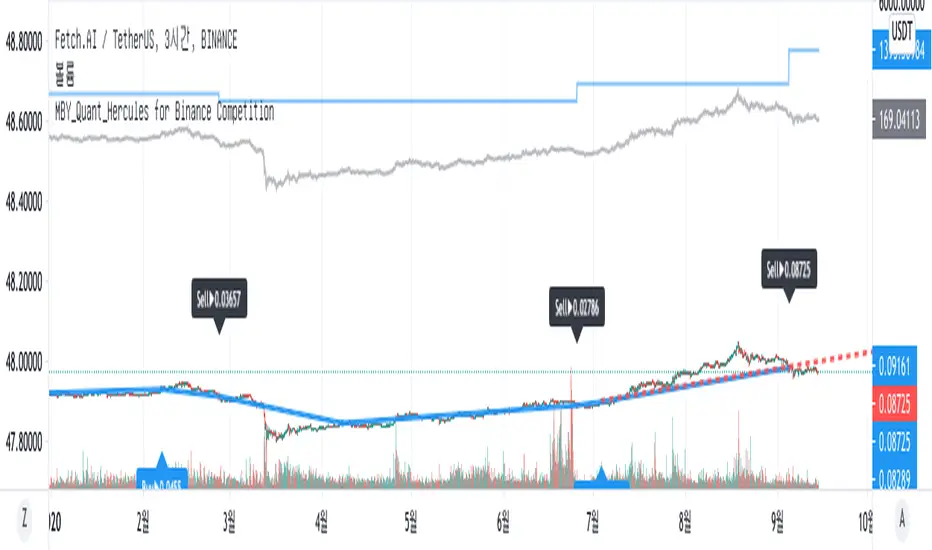
MBY_Quant_Hercules_Ver.CustomHello.
This is MBY Lab.
We are very excited to deploy Hercules metrics.
Hercules strategy operates based on the Relative Strength Index , and displays the price when each Relative Strength Index maintains an upward trend or decreases.
When the stock price rises, the price at the time of entering the overbought or oversold section is displayed as the market price, or when the relative strength index falls when the stock price rises, it is captured and the market price is displayed.
Therefore, this indicator is a momentum indicator , and it can be said to be a non-trend following indicator.
The blue line that outputs as blue shows a graph of the asset change when buying or selling at the price pointed to by this indicator, including 0.2% slippage and 0.2% transaction fee.
Of course, this doesn't mean that this metric is always profitable.
This strategy was created to aid trading.
This indicator is a private indicator, please comment if you wish to use it.
And this version is for VSOP
**notice**
"Use the link(Invite only script Contact) below to obtain access to this indicator".