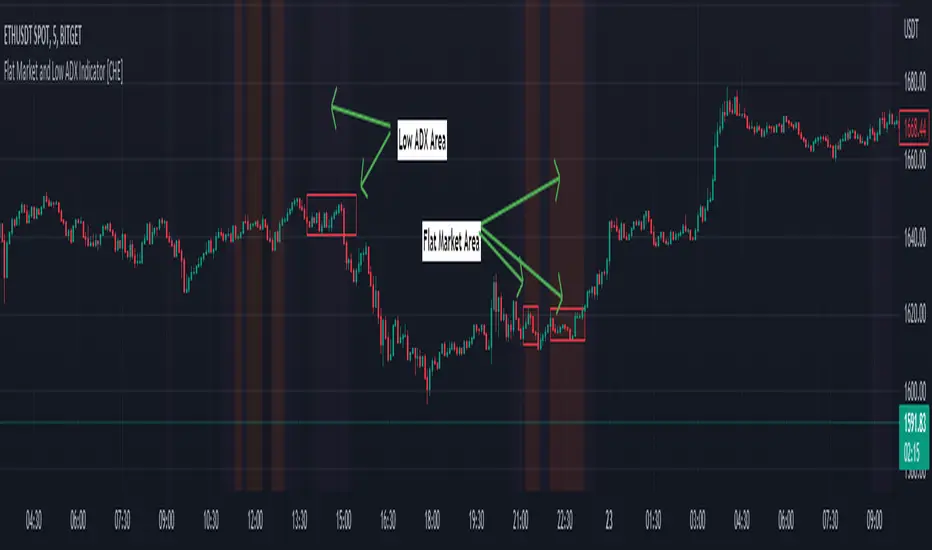
Flat Market and Low ADX Indicator [CHE]Why use the Flat Market and Low ADX Indicator ?
Flat markets, where prices remain within a narrow range for an extended period, can be both critical and dangerous for traders. In a flat market, the price action becomes less predictable, and traders may struggle to find profitable trading opportunities. As a result, many traders may decide to take a break from the market until a clear trend emerges.
However, flat markets can also be dangerous for traders who continue to trade despite the lack of clear trends. In the absence of a clear direction, traders may be tempted to take larger risks or make impulsive trades in an attempt to capture small profits. Such behavior can quickly lead to significant losses, especially if the market suddenly breaks out of its flat range, causing traders to experience large drawdowns.
Therefore, it is essential to approach flat markets with caution and to have a clear trading plan that incorporates strategies for both trending and flat markets. Traders may also use technical indicators, such as the Flat Market and Low ADX Indicator, to help identify flat markets and determine when it is appropriate to enter or exit a position.
The confluence between flat markets and low ADX readings can further increase the risk of trading during these periods. The ADX (Average Directional Index) is a technical indicator used to measure the strength of a trend. A low ADX reading indicates that the market is in a consolidation phase, which can coincide with a flat market. When a flat market occurs during a period of low ADX, traders should be even more cautious, as there is little to no directional bias in the market. In this situation, traders may want to consider waiting for a clear trend to emerge or using range-bound trading strategies to avoid taking excessive risks.
Introduction:
Pine Script is a programming language used for developing custom technical analysis indicators and trading strategies in TradingView. This particular script is an indicator designed to identify flat markets and low ADX conditions. In this description, we will delve deeper into the functionality of this script and how it can be used to improve trading decisions.
Description:
The first input in the script is the length of the moving average used for calculating the center line. This moving average is used to define the high and low range of the market. The script then calculates the middle value of the range by taking the double exponential moving average (EMA) of the high, low, and close prices.
The script then determines whether the market is flat by comparing the middle value of the range with the high and low values. If the middle value is greater than the high value or less than the low value, the market is not flat. If the middle value is within the high and low range, the script considers the market to be flat. The script also uses RSI filter settings to further confirm if the market is flat or not. If the RSI value is between the RSI min and max values, then the market is considered flat. If the RSI value is outside this range, the market is not considered flat.
The script also calculates the ADX (Average Directional Index) to determine whether it's in a low area. ADX is a technical indicator used to measure the strength of a trend. The script uses the ADX filter settings to define the ADX threshold value. If the ADX value is below the threshold value, the script considers the market to be in a low ADX area.
The script provides various input options to customize the display settings, including the option to show the flat market and low ADX areas. Users can choose their preferred colors for the flat market and low ADX areas and adjust the transparency levels to suit their needs.
Conclusion:
In conclusion, this Pine Script indicator is designed to identify flat market and low ADX conditions, which can help traders make informed trading decisions. The script uses a range of inputs and calculations to determine the market direction, RSI filter, and ADX filter. By customizing the display settings, users can adjust the indicator to suit their preferences and improve their trading strategies. Overall, this script can be a valuable tool for traders looking to gain an edge in the markets.
Acknowledgments:
Thanks to the Pine Script™ v5 User Manual www.tradingview.com
Cerca negli script per "profitable"
Rekt Edge Reversion BandRekt Edge Reversion band is a technical indicator that utilizes a combination of moving averages and standard deviations to determine optimal entry and exit points in the market. By comparing the current price to its moving average, the indicator identifies potential trends and determines how you can position around them by plotting buy/sell signals and two channels based on user input parameters. The user can choose between Simple Moving Average ( SMA ) or Exponential Moving Average ( EMA ) and select the moving average period, the unit of separation, the multiples of the unit, and other important parameters. The indicator's inputs can be adjusted to suit different trading styles, and it can be used on any time frame. The indicator can be used to identify potential trend reversals or breakouts (or breakdowns) when the price moves outside of the channels. The indicators potential use cases include identifying overbought or oversold conditions. With its ability to provide a clear signal on when to enter and exit a trade, this indicator is a popular tool among traders looking to make more informed and profitable trading decisions. This indicator can also be used in conjunction with other technical analysis tools to confirm or invalidate trading signals.

Athena Momentum Squeeze - Short, Lean, and Mean This is a very profitable strategy focusing on 15 minute intervals on the Micro Nasdaq Futures contracts. CME_MINI:MNQH2023
As this contract only keeps positions for on average about an hour risk is managed. At a profit factor of 3.382 with a max drawdown of $123 from January 1st to February 15. Looking back to Dec 2019 still maintains a profit factor of 1.3.
See backtesting: www.screencast.com
2019 backtesting: www.screencast.com
Based on the classic Lazy Bear Oscillator Squeeze with a number of modifications from ADX, MAs and adding fibonacci levels.
We like keeping strategies simple yet powerful, no completely where you can't understand your own trades.
Our team is always modifying and improving the strategy. Always open to collaborating on improving as there is no perfect strategy. www.screencast.com

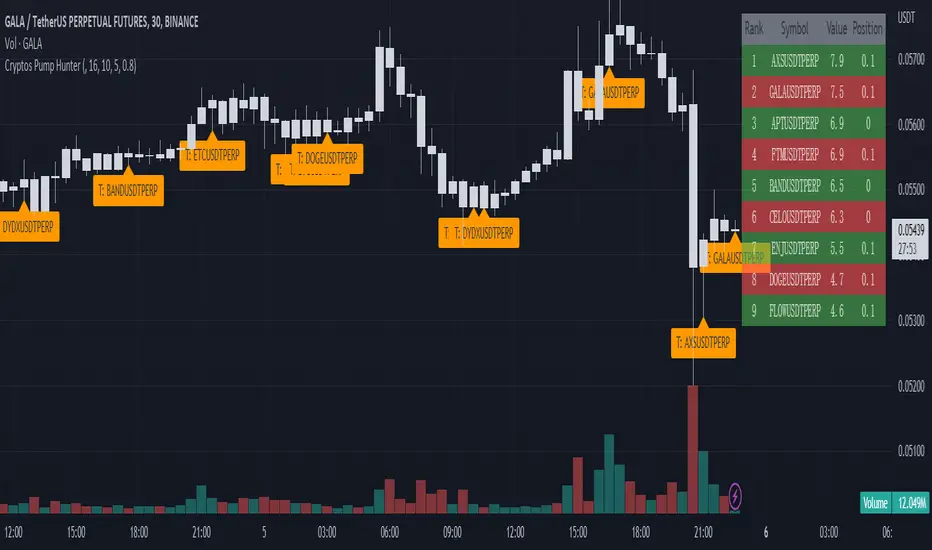
Cryptos Pump Hunter[liwei666]🔥 Cryptos Pump Hunter captured high volatility symbols in real-time, Up to 40 symbols can be monitored at same time.
Help you find the most profitable symbol with excellent visualization.
🔥 Indicator Design logic
🎯 The core pump/dump logic is quite simple
1. calc past bars highest and lowest High price, get movement by this formula
" movement = (highest - lowest) / lowest * 100 "
2. order by 'movement' value descending, you will get a volatility List
3. use Table tool display List, The higher the 'movement', the higher the ranking.
🔥 Settings
🎯 2 input properties impact on the results, 2 input impact on display effects, others look picture below.
pump_bars_cnt : lookback bar to calc pump/dump
resolution for pump : 1min to 1D
show_top1 : when ranking list top1 change, will draw a label
show pump : when symbol over threhold, draw a pump lable
🔥 How TO USE
🎯 only trade high volatility symbols
1. focus on top1 symbol on Table panel at top-right postion, trading symbols at label in chart.
2. Short when 'postion' ~ 0, Long when 'postion' ~ 1 on Table Cell
🎯 Monitor the symbols you like
1. 100+ symbols added in script, cancel remarks in code line if symbol is your want
2. add 1 line code if symbol not exist. if you want monitor 'ETHUSDTPERP ', then add
" ETHUSDTPERP = create_symbol_obj('BINANCE:ETHUSDTPERP'), array.unshift(symbol_a, ETHUSDTPERP ) "
🎯 Alert will be add soon, any questions or suggestion please comment below, I would appreciate it greatly.
Hope this indicator will be useful for you :)
enjoy! 🚀🚀🚀
Strategy Myth-Busting #11 - TrendMagic+SqzMom+CDV - [MYN]This is part of a new series we are calling "Strategy Myth-Busting" where we take open public manual trading strategies and automate them. The goal is to not only validate the authenticity of the claims but to provide an automated version for traders who wish to trade autonomously.
Our 11th one is an automated version of the "Magic Trading Strategy : Most Profitable Indicator : 1 Minute Scalping Strategy Crypto" strategy from "Fx MENTOR US" who doesn't make any official claims but given the indicators he was using, it looked like on the surface that this might actually work. The strategy author uses this on the 1 minute and 3 minute timeframes on mostly FOREX and Heiken Ashi candles but as the title of his strategy indicates is designed for Crypto. So who knows..
To backtest this accurately and get a better picture we resolved the Heiken Ashi bars to standard candlesticks . Even so, I was unable to sustain any consistency in my results on either the 1 or 3 min time frames and both FOREX and Crypto. 10000% Busted.
This strategy uses a combination of 3 open-source public indicators:
Trend Magic by KivancOzbilgic
Squeeze Momentum by LazyBear
Cumulative Delta Volume by LonesomeTheBlue
Trend Magic consists of two main indicators to validate momentum and volatility. It uses an ATR like a trailing Stop to determine the overarching momentum and CCI as a means to validate volatility. Together these are used as the primary indicator in this strategy. When the CCI is above 0 this is confirmation of a volatility event is occurring with affirmation based upon current momentum (ATR).
The CCI volatility indicator gets confirmation by the the Cumulative Delta Volume indicator which calculates the difference between buying and selling pressure. Volume Delta is calculated by taking the difference of the volume that traded at the offer price and the volume that traded at the bid price. The more volume that is traded at the bid price, the more likely there is momentum in the market.
And lastly the Squeeze Momentum indicator which uses a combination of Bollinger Bands, Keltner Channels and Momentum are used to again confirm momentum and volatility. During periods of low volatility, Bollinger bands narrow and trade inside Keltner channels. They can only contract so much before it can’t contain the energy it’s been building. When the Bollinger bands come back out, it explodes higher. When we see the histogram bar exploding into green above 0 that is a clear confirmation of increased momentum and volatile. The opposite (red) below 0 is true when there are low periods. This indicator is used as a means to really determine when there is premium selling plays going on leading to big directional movements again confirming the positive or negative momentum and volatility direction.
If you know of or have a strategy you want to see myth-busted or just have an idea for one, please feel free to message me.
Trading Rules
1 - 3 min candles
FOREX or Crypto
Stop loss at swing high/low | 1.5 risk/ratio
Long Condition
Trend Magic line is Blue ( CCI is above 0) and above the current close on the bar
Squeeze Momentum's histogram bar is green/lime
Cumulative Delta Volume line is green
Short Condition
Trend Magic line is Red ( CCI is below 0) and below the current close on the bar
Squeeze Momentum's histogram bar is red/maroon
Cumulative Delta Volume line is peach

ATR Mean Reversion Strategy V1**Long Only Strategy**
When Price drops below the ATR band below it will enter a buy on the next candle open
SL at current price minus ATR* ATR multiplier
TP at Mean EMA or if higher than Mean EMA and current candle low is below previous candle low or if price is above ATR
NB: I would highly recommend a low fee broker (I use ICmarkets raw spread account) due to the fact that this is a decently high frequency trading strategy you will rack up a lot of commission, if you use and exchange like Bybit or Binance the strategy will not be profitable due to the high commissions.

Reinforced RSI - The Quant Science This strategy was designed and written with the goal of showing and motivating the community how to integrate our 'Probabilities' module with their own script.
We have recreated one of the simplest strategies used by many traders. The strategy only trades long and uses the overbought and oversold levels on the RSI indicator.
We added stop losses and take profits to offer more dynamism to the strategy. Then the 'Probabilities' module was integrated to create a probabilistic reinforcement on each trade.
Specifically, each trade is executed, only if the past probabilities of making a profitable trade is greater than or equal to 51%. This greatly increased the performance of the strategy by avoiding possible bad trades.
The backtesting was calculated on the NASDAQ:TSLA , on 15 minutes timeframe.
The strategy works on Tesla using the following parameters:
1. Lenght: 13
2. Oversold: 40
3. Overbought: 70
4. Lookback: 50
5. Take profit: 3%
6. Stop loss: 3%
Time period: January 2021 to date.
Our Probabilities Module, used in the strategy example:

Market Structure MA Based BOS [liwei666]
🎲 Overview
🎯 This BOS(Break Of Structure) indicator build based on different MA such as EMA/RMA/HMA, it's usually earlier than pivothigh() method
when trend beginning, customer your BOS with 2 parameters now.
🎲 Indicator design logic
🎯 The logic is simple and code looks complex, I‘ll explain core logic but not code details.
1. use close-in EMA's highest/lowest value mark as SWING High/Low when EMA crossover/under,
not use func ta.pivothigh()/ta.pivotlow()
2. once price reaching EMA’s SWING High/Low, draw a line link High/Low to current bar, labled as BOS
3. find regular pattern benefit your trading.
🎲 Settings
🎯 there are 4 input properties in script, 2 properties are meaningful in 'GRP1' another 2 are display config in 'GRP2'.
GRP1
MA_Type: MA type you can choose(EMA/RMA/SMA/HMA), default is 'HMA'.
short_ma_len: MA length of your current timeframe on chart
GRP2
show_short_zz: Show short_ma Zigzag
show_ma_cross_signal: Show ma_cross_signal
🎲 Usage
🎯 BOS signal usually worked fine in high volatility market, low volatility is meaningless.
🎯 We can see that it performs well in trending market of different symbols, and BOS is an opportunity to add positions
BINANCE:BTCUSDTPERP
BINANCE:ETHUSDTPERP
🎯 MA Based signal is earlier than pivothigh()/pivotlow() method when trend beginning. it means higher profit-loss rate.
🎯 any questions or suggestion please comment below.
Additionally, I plan to publish 20 profitable strategies in 2023; indicatior not one of them,
let‘s witness it together!
Hope this indicator will be useful for you :)
enjoy! 🚀🚀🚀

Multi-Timeframe MA Based Zigzag[liwei666]🎲 Overview
🎯 This Zigzag indicator build based on different MA such as EMA/HMA/RMA/SMA, support multi-timeframe setting .
you can get customer zigzag indicator by change short/long ma length and high-timeframe config(5m/15m/30m/1h/2h) in any symbol.
🎲 Indicator design logic
🎯 entired logic is simple and code looks complex, I‘ll explain core logic here, code already equipped with detailed comments.
1. use close-in EMA's highest/lowest value mark as SWING High/Low when EMA crossover/under, not use func ta.pivothigh()/ta.pivotlow()
2. when EMA crossover/under plot a char as signal like ●/❄/▲, crossover get blue char crossunder get red char
3. latest zigzag line is not drawn until EMA is turned (crossover/under), but signal is realtime
4. you can see diff zigzag structure when you open high-timeframe config, then find regular pattern benefit your trading.
🎲 Settings
🎯 there are 3 group properties in script, just focus on 5 properties in 'GRP1' ,
'GRP2' and 'GRP3' are display config.
'GRP1':
MA_Type: MA type you can choose(EMA/RMA/SMA/HMA/WMA), default is EMA
short_ma_len: short MA length of your current timeframe on chart
long_ma_len: long MA length of your current timeframe on chart
htf_ma_len: MA length of high timeframe, MA type same as 'MA_Type' config
htf_ma_tf: high timeframe ma length, 15/30/60/120 minute
'GRP2':
• show_short_zz • show_long_zz • show_htf_zz:
'GRP3':
• show_short_ma_line • show_short_ma_signal
• show_long_ma_line • show_long_ma_signal
• show_htf_ma_line • show_htf_ma_signal
🎲 Usage
🎯 As we know, MA based signal usually worked fine in trend market , low volatility is unprofitable.
🎯 One of pattern as the chart show below.
1. success example : after a blue ▲ signal, entry long when blue ● signal appear, marked with green box.
2. failed example: after a blue ▲ signal, a red ▼ signal appear, marked with white box.
🎯 BoS(Break of Structure) based on ma zigzag is a good idea I'm implementing, it will be published in next script.
Additionally, I plan to publish 20 profitable strategies in 2023; this indicatior not one of them,
let‘s witness it together!
Hope this indicator will be useful for you :)
enjoy! 🚀🚀🚀

Trading BehnamI've read around here various definitions for engulfs along the lines of "an engulf consumes all orders at a level to allow price to easily pass through it." . That doesn't make much sense to me, if the guys with billions of dollars want to break a level, they will break it and price will run off very often. We've seen it time and time again, they don't need to engulf levels to give us a nice opportunity to get into the trade with them, if they want to blast through a level, they will do so and price will run off. If they want an opportunity to accumulate more orders before price runs away, then it doesn't make sense to engulf the level, better to let price bounce from that level and then fill more orders, if the level breaks then they have to deliberately stop the market running away and move it back to the pre-engulf area as the market momentum would naturally make it run off after an engulf. Other ideas about it being a secret signal between the institutions don't make sense to me either. To be honest, I think any secret signals between competing institutions come in the form of them in a heavily encrypted chatroom telling each other what to do. This collusion has been reported on previously as traders align their activities at important moments.
So I think we can all agree something along the lines of:
Fakeout:
Fakeout is an engulf of an obvious swing high/low in order to stop out traders and induce breakout traders to trade in the wrong direction, thus generating liquidity for the move in the opposite direction.
What's not so clear is the definition of the engulf, I'd like to try to give some ideas on the purpose of the engulf and it's definition and see what others think.
Engulf:
An engulf is the consumption of orders at an important level, not necessarily a swing/high low but an area where we expect to see supply or demand. Taking out of the orders tells us that the supply or demand which was or should have been present is now not present and tells us the intent direction of the market. If price runs off as is often the case, this is not tradeable and is effectively just a "breakout", although breakouts are usually considered to be breaks of swing high and lows which are obvious to the average trader. For an engulf to be tradeable there must be a retrace following the engulf back in the original direction. This adds confusion as it initially resembles a fakeout. So the question is, why does price retrace after the engulf? If an engulf to the short side is a genuine engulf and not a fakeout to generate long liquidity, why does it not travel immediately south if market momentum is ultimately south.
A small pocket of demand beneath the engulfed level may make it retrace north as price moves between areas of liquidity, this pocket of demand may give price enough momentum to make it back up to the supply which broke the demand level if key market participants do not favour an immediate market drop.
Alternatively key market participants may step in and drive the market back upwards.
Price moving north back to supply after the engulf may occur or be favourable for various reasons:
1) We often talk about FO generating liquidity because of breakout trading, but an engulf can also generate liquidity from breakout traders. Short breakout traders would place their stop losses a small distance above the engulf (breakout). If key players absorb this selling or allow a demand level to push price back up, they can run price back up to supply taking out the stops of the breakout short traders and make quick profit and/or generate more liquidity for their own shorts.
2) To confuse traders, the ITs don't want the puzzle that is Forex to be easy to solve, if price never retraced after an engulf then engulfs of all levels would be FOs. Price would either break and immediately runoff or it would turn and runoff in the other direction. In order to keep people confused about whether price is faking out or breaking out, sometimes price should whipsaw by breaking out, briefly faking out and then continuing in the direction of the breakout. This whipsaw pattern is to us a tradeable engulf.
3) Market momentum may be mixed, key players are indecisive or inactive or the market is behaving erratically.
4) As previously mentioned there may be a small pocket of supply/demand just past the engulf which is causing a reaction. This could also be viewed as a FO on a different timeframe. If the market engulfs an H1 demand level, then retraces for 30 mins upwards to supply, this engulf would be a valid and very profitable FO for an M1 trader looking to get long.

Strategy Myth-Busting #20 - HalfTrend+HullButterfly - [MYN]#20 on the Myth-Busting bench, we are automating the " I Found Super Easy 1 Minute Scalping System And Backtest It 100 Times " strategy from " Jessy Trading " who claims 30.58% net profit over 100 trades in a couple of weeks with a 51% win rate and profit factor of 1.56 on EURUSD .
This one surprised us quite a bit. Despite the title of this strategy indicating this is on the 1 min timeframe, the author demonstrates the backtesting manually on the 5 minute timeframe. Given the simplicity of this strategy only incorporating a couple of indicators, it's robustness being able to be profitable in both low and high timeframes and on multiple symbols was quite refreshing.
The 3 settings which we need to pay most attention to here is the Hull Butterfly length, HalfTrend amplitude and the Max Number Of Bars Between Hull and HalfTrend Trigger. Depending on the timeframe and symbol, these settings greatly impact the performance outcomes of the strategy. I've listed a couple of these below.
And as always, If you know of or have a strategy you want to see myth-busted or just have an idea for one, please feel free to message me.
This strategy uses a combination of 3 open-source public indicators:
Hull Butterfly Oscillator by LuxAlgo
HalfTrend by Everget
Trading Rules
5 min candles but higher / lower candles work too.
Stop loss at swing high/low
Take Profit 1.5x the risk
Long
Hull Butterfly gives us green column, Wait for HalfTrend to present an up arrow and enter trade.
Short
Hull Butterfly gives us a red column , Wait for HalfTrend to present a down arrow and enter trade.
Alternative Trading Settings for different time frames
1 Minute Timeframe
Move the Hull Butterfly length from the default 11 to 9
Move the HalfTrend Amplitude from the default 2 to 1
Enabling ADX Filter with a 25 threshold
2 Hour Timeframe
Move the HalfTrend Amplitude from the default 2 to 1
Laddered Take Profits from 14.5% to 19% with an 8% SL

HeikinAshi / MS-Signal (HA-MS)Hello?
Traders, welcome.
If you "Follow", you can always get new information quickly.
Please also click "Boost".
Have a good day.
-------------------------------------
I would like to take the time to explain the indicators needed for trading among the two indicator formulas previously disclosed.
The HA-MS indicator is an indicator created using the Heikin Ashi formula and the MACD formula.
Therefore, the reliability of the indicator is considered to be high.
If you want a comprehensive indicator, you can share the chart being published as an idea and use the MRHAB-T indicator.
The shared indicators can be used without any restrictions if you are a paid member of TradingView.
(Free members have many restrictions on sharing charts.)
The MS-Signal indicator using MACD is an indicator composed of M-Signal and S-Signal lines.
I made it possible to display the M-Signal line of the 1D, 1W, and 1M charts separately so that the trend can be checked on other timeframe charts.
Therefore, by looking at the 15m chart or 1h chart to check the overall trend when trading, we prevented getting caught up in temporary volatility, that is, a whipsaw, and made this M-Signal line to be used as support and resistance.
If you touch these M-Signal lines when a surge or plunge occurs, it means that there is a high possibility of indicating support or resistance.
If the 5EMA line on the 1D chart rises above the 5EMA line enough to be called a soaring moving average, it means that there is a high possibility of a sudden movement.
Therefore, the 5EMA line of the 1D chart is displayed separately so that it can be checked in time frames other than 1D (15m, 1h charts, etc.).
This 5EMA line can also be used as support and resistance like the M-Signal line of the 1D, 1W, and 1M charts described above.
The MS-Signal indicator is for viewing trends.
So, if the price stays above the MS-Signal indicator and the MS-Signal indicator turns into a bullish sign, it means that the uptrend is likely to continue.
Conversely, if the price stays below the MS-Signal indicator and the MS-Signal indicator turns to a bearish sign, then the downtrend is likely to continue.
Therefore, even if it temporarily rises above the MS-Signal indicator, it cannot be said that it will show an uptrend unless it is converted to an uptrend.
So, when the price surges and rises above the MS-Signal indicator, it is important to hold the price until the MS-Signal indicator turns into an uptrend.
If the HA-Low line or HA-High line is passing through these movements, you should respond by looking at whether you are supported or resisted on these lines.
The HA-Low line and the HA-High line are lines created for trading using Heikin Ashi candles.
Therefore, it can be interpreted that if it is supported by the HA-Low or HA-High line, it is highly likely to show an uptrend.
However, since the HA-Low and HA-High lines are calculated together with the RSI indicator, they are displayed on the chart as interactions.
The HA-Low line is a line created near the low point,
The HA-High line is a line created near the high point.
Therefore, if it shows support at the HA-Low line, it is time to buy.
And, if the price rises and rises above the HA-High line, it is likely to show a sharp movement.
Because of this movement, the HA-Low line is called the buy line, and the HA-High line is called the soaring line.
Since the HA-High line is a soaring line, if it is resisted by the HA-High line, it also means that there is a high possibility of a sharp decline.
If you see support at the HA-High line, you can buy it, but as I said, it is a sharp rise line, so you have to respond from a short-term perspective.
The Heikin Ashi body indicator is significant as it marks the first trend reversal.
So, you can see the first reversal move, either when the price first makes a move from a downtrend to an uptrend, or when the price first makes a move from an uptrend to a downtrend.
For example, if the price is in a downtrend and stops falling and moves sideways or rises slightly, the Heikin Ashi body indicator is likely to turn into an uptrend.
If this turns into a bullish sign, aggressive buying is possible.
However, since there is a high possibility that it will not rise higher and fall immediately, it is better to think of a trading strategy when it shows support by rising above the 5EMA line, HA-Low line, and MS-Signal indicator.
Let's assume that from an uptrend in price, the Heikin Ashi body indicator turns to a downtrend.
Then, if you touch the 5EMA line, the HA-High line, and the MS_Signal indicator, I think you can buy some time to think about a selling strategy.
-------------------------------------------------- -
It doesn't matter how you trade and what tools you use.
What matters is whether you can create a trading strategy.
We tend to spend more time on analysis like chart analysis, economic analysis.
Also, many analytical techniques are studied to do this kind of analysis.
I have spent a lot of time studying various analysis techniques and putting a lot of effort into using them in trading.
However, I realized that acquiring all of these things did not make me a good trader.
The indicators released today also do not mean much in reality.
It merely provides minimal information for creating a trading strategy.
I think it is better to put aside the idea of investing a lot of time in chart analysis and economic analysis and proceeding with trading.
Instead, I recommend spending a lot of time thinking about how to buy at the point or section you are trading, how to sell if the price rises, and how to stop loss if the price falls.
Quickly learn that learning difficult analytical techniques doesn't make you profitable on your trades.
I hope you understand.
An analytical technique or tool that allows you to earn a steady income is the best technique.
Creating a trading strategy is not difficult.
It's just that it feels difficult because I haven't organized my thoughts until now.
trading strategy
1. Investment period
2. Investment scale
3. Trading method and profit realization method
You just need to think in order and then start trading.
The most important thing in this trading strategy is the investment period.
The most important thing is whether to trade the coin (token) you want to trade by investing for a period such as the same day, short term, mid term, or long term.
This is because even though this first button is not connected properly, the following fund management and trading methods are all wrong.
I hope the day will come soon when you can play with the movement of the chart and get away from wrestling with the chart.
thank you.
---------------------------------

kNNLibrary "kNN"
Collection of experimental kNN functions. This is a work in progress, an improvement upon my original kNN script:
The script can be recreated with this library. Unlike the original script, that used multiple arrays, this has been reworked with the new Pine Script matrix features.
To make a kNN prediction, the following data should be supplied to the wrapper:
kNN : filter type. Right now either Binary or Percent . Binary works like in the original script: the system stores whether the price has increased (+1) or decreased (-1) since the previous knnStore event (called when either long or short condition is supplied). Percent works the same, but the values stored are the difference of prices in percents. That way larger differences in prices would give higher scores.
k : number k. This is how many nearest neighbors are to be selected (and summed up to get the result).
skew : kNN minimum difference. Normally, the prediction is done with a simple majority of the neighbor votes. If skew is given, then more than a simple majority is needed for a prediction. This also means that there are inputs for which no prediction would be given (if the majority votes are between -skew and +skew). Note that in Percent mode more profitable trades will have higher voting power.
depth : kNN matrix size limit. Originally, the whole available history of trades was used to make a prediction. This not only requires more computational power, but also neglects the fact that the market conditions are changing. This setting restricts the memory matrix to a finite number of past trades.
price : price series
long : long condition. True if the long conditions are met, but filters are not yet applied. For example, in my original script, trades are only made on crossings of fast and slow MAs. So, whenever it is possible to go long, this value is set true. False otherwise.
short : short condition. Same as long , but for short condition.
store : whether the inputs should be stored. Additional filters may be applied to prevent bad trades (for example, trend-based filters), so if you only need to consult kNN without storing the trade, this should be set to false.
feature1 : current value of feature 1. A feature in this case is some kind of data derived from the price. Different features may be used to analyse the price series. For example, oscillator values. Not all of them may be used for kNN prediction. As the current kNN implementation is 2-dimensional, only two features can be used.
feature2 : current value of feature 2.
The wrapper returns a tuple: [ longOK, shortOK ]. This is a pair of filters. When longOK is true, then kNN predicts a long trade may be taken. When shortOK is true, then kNN predicts a short trade may be taken. The kNN filters are returned whenever long or short conditions are met. The trade is supposed to happen when long or short conditions are met and when the kNN filter for the desired direction is true.
Exported functions :
knnStore(knn, p1, p2, src, maxrows)
Store the previous trade; buffer the current one until results are in. Results are binary: up/down
Parameters:
knn : knn matrix
p1 : feature 1 value
p2 : feature 2 value
src : current price
maxrows : limit the matrix size to this number of rows (0 of no limit)
Returns: modified knn matrix
knnStorePercent(knn, p1, p2, src, maxrows)
Store the previous trade; buffer the current one until results are in. Results are in percents
Parameters:
knn : knn matrix
p1 : feature 1 value
p2 : feature 2 value
src : current price
maxrows : limit the matrix size to this number of rows (0 of no limit)
Returns: modified knn matrix
knnGet(distance, result)
Get neighbours by getting k results with the smallest distances
Parameters:
distance : distance array
result : result array
Returns: array slice of k results
knnDistance(knn, p1, p2)
Create a distance array from the two given parameters
Parameters:
knn : knn matrix
p1 : feature 1 value
p2 : feature 2 value
Returns: distance array
knnSum(knn, p1, p2, k)
Make a prediction, finding k nearest neighbours and summing them up
Parameters:
knn : knn matrix
p1 : feature 1 value
p2 : feature 2 value
k : sum k nearest neighbors
Returns: sum of k nearest neighbors
doKNN(kNN, k, skew, depth, price, long, short, store, feature1, feature2)
execute kNN filter
Parameters:
kNN : filter type
k : number k
skew : kNN minimum difference
depth : kNN matrix size limit
price : series
long : long condition
short : short condition
store : store the supplied features (if false, only checks the results without storage)
feature1 : feature 1 value
feature2 : feature 2 value
Returns: filter output

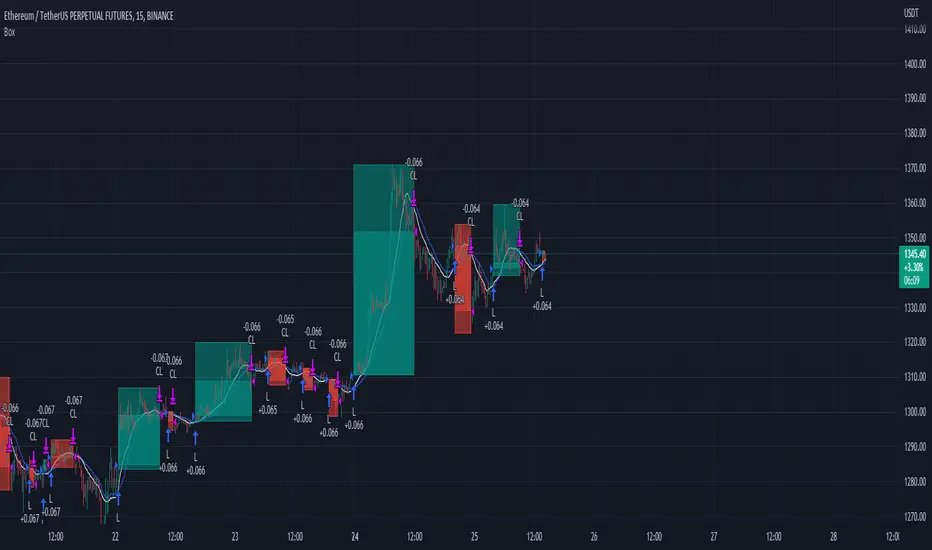
Trading range display with BoxThis script is just for reference to see the trading range.
Do not use this strategy logic, it is just Test strategy.
The trading range is colored depending on whether it is profitable or not.
You can change the color if you want.
When you declare the strategy, put (process_orders_on_close=true,calc_on_every_tick=true, max_boxes_count=500) in your script.
Then it can show you current open trading as well.
If you use switching strategy (e.g longposition to shortposition right away), it may not show you the range properly.
In that case, reduse the test period.
IT IS Repainting Reference.
If you want to see your strategy result visually,
Just copy and paste from line 22 in my script.
Good Luck everyone.
전략 거래 기간 동안을 보여주는 지표입니다.
이 지표에 쓰인 전략은 단순 테스트용 입니다. 절대 사용하지 마세요.
각 거래기간은 수익이냐 아니냐에 따라 색깔이 정해 집니다.
색깔은 여러분이 변경하실 수 있습니다.
전략을 선언부에 process_orders_on_close=true,calc_on_every_tick=true, max_boxes_count=500 을 넣으시면 현재 오픈 거래도 보실 수 있습니다.
스위칭 전략(롱에서 숏으로 바로 전환하는 전략)을 쓰시는 분들은 아마 테스트 기간을 줄이라는 경고를 받으실 수 있습니다.
이 지표는 리페이팅이 될 수 있습니다.
전략 결과를 눈으로 보고 싶으신 분들은 22번째 줄 부터 카피하시면 됩니다.
행운이 있길..
---strategy set---
default_qty_value=10
commission_value=0.04
slippage=2
Supertrend, MA 44|6, EMA FIBS 13|21|34I have this indicator based on my strategy. This indicator is based on existing functions available in the system. I haven't added anything new. This indicator uses Supertrend, MA44|6, EMA fibs 13|21|34 combining to find a profitable trade.
- Supertrend : Indicator uses supertrend strategy with default ATR period of 10 and Factor value 3. These values can be customized based on your preferences. Uptrend is denoted by green color and downtrend by red color. You can change the colors based on your preferences.
- MA 44|6: Indicator plots moving averages of 44 and 6. These values can be customized based on your preferences. Although it is highly recommended to keep 44 as is. Value 6 can be adjusted based on your preference. Default color for uptrend is green and for downtrend is red. You can change the colors based on your preferences.
- FIBS EMA 13|21|34: Indicator plots EMA of fibbonacci numbers 13, 21,34 to identify consolidation and breakout. The periods can be adjusted but it is highly recommended not to do so. Default colors for 13,21 and 34 is Aqua, Blue and Navy respectively. You can change the colors based on your preferences.
When to take trade?
To take a trade all conditions needs to be fulfilled.
Supertrend : Always take a trade in the direction of Supertrend. It is always advisable to take trade if the trend is changing or price is taking support of resistance.
MA 44|6: Moving average 44 indicates average price of 44 last candles and 6 for last 6 candles. Price crossing MA 44 indicates change in trend. It is advisable to take trade at crossing the line above or below. If many candles closing near MA 44 then it indicates consolidation. The more far the candle closes from MA44 the better. MA 6 is used to identify when to enter or exit the trade. If candle closes away from MA 6 then you can wait for candle to start near the MA 6 line. If candle closes above/below MA 6 you can exit your trade.
Fibonacci 13|21|34: When all lines are closed it indicates consolidation. When price breakouts to either direction you can take a trade in that direction with following conditions.
Bullish Trade:
When to enter?
If candle closed above MA 44, Supertrend is uptrend and EMA Fibs are moving away and are above MA 44. The price is near to MA 6 line then you can enter into bullish trade. If price is away from MA 6 then you should wait until the price/line comes near to avoid loss.
When to exit?
Price moving in opposite direction:
You should set a stop loss when you enter the trade. The stop loss can be set below the low of the previous candle or any other strategy you have. But it is really important to set the stop loss. If price moves in opposite direction then your stop loss will hit and you will be out of the trade.
Price moving in same direction:
Once you enter the trade you can exit based on two conditions whichever suits you.
1. Exit the trade if candle closes below MA6. The drawback is you may exit too early. You can also adjust the period based on your preferences.
2. Exit the trade if candle closed below low of previous candle. The drawback is you may book less profit but you can capture the movement very well.
Bearish Trade:
When to enter?
If candle closed below MA 44, Supertrend is downtrend and EMA Fibs are moving away and are below MA 44. The price is near to MA 6 line then you can enter into bearish trade. If price is away from MA 6 then you should wait until the price/line comes near to avoid loss.
When to exit?
Price moving in opposite direction:
You should set a stop loss when you enter the trade. The stop loss can be set below the low of the previous candle or any other strategy you have. But it is really important to set the stop loss. If price moves in opposite direction then your stop loss will hit and you will be out of the trade.
Price moving in same direction:
Once you enter the trade you can exit based on two conditions whichever suits you.
1. Exit the trade if candle closes below MA6. The drawback is you may exit too early. You can also adjust the period based on your preferences.
2. Exit the trade if candle closed below low of previous candle. The drawback is you may book less profit but you can capture the movement very well.
When not to take trade?
1. If MA 44 is completely horizontal and EMA Fibs are very close to each other. This indicates that the market is consolidated and if you enter the trade you may hit stop loss very often.
Note: Please note that I am not expert and I don't take any responsibility of your profits or losses. I have created this indicator based on my knowledge and it is for study purpose. Use of this indicator is totally your responsibility. Use all your knowledge and expertise and don't totally depend on the indicator. Don't forget to use stop loss and do money management.
Happy Trading!

Benjamin Graham Net-Net AnalyserA simple indicator that displayers as a table, telling you whether or not the stock you have selected has a current price that is less than 67% of the company's net current asset value per share (NCAVPS) at its last reporting period (FQ, FY, TTM).
Benjamin Graham uses this 67% rule to decide whether or not a stock is significantly undervalued, and studies have shown that investing in companies whose share prices are less than 67% of their NCAVPS can be highly profitable, and will beat markets in the long run.
Feel free to use as you please or repurpose the code for your own projects.

Bollinger BandsThis strategy is inspired from Power of Stock aka Subhasish Panni.
Target is minimum 1:3 when you get this setup right.
Buy when:
1) Low is greater than upper band of BB and next candle breaks high of that candle, SL is Low of previous candle which is has low above upper band.
2) High is lower than lower band of BB and next candle breaks high of that candle, SL is low of previous candle which has high lower than lower band.
Sell when:
1) Low is greater than upper band of BB and next candle breaks low of that candle, SL is high of previous candle which is has low above upper band.
2) High is lower than lower band of BB and next candle breaks high of that candle, SL is high of previous candle which has high lower than lower band.
Disclaimer: this setup will cause many small stoploss hit, you have to accept that loss but you will be profitable because of R:R.

Adaptive Parabolic SAR (APSAR) - [MYN]We took the code that we wrote in Myth Busting Strategy #6 to make it more profitable, specifically the timeframe adaptive Parabolic SAR logic and published this as a separate indicator to make it easier for others to use and adopt.
There really is no magic to this. This indicator basically just evaluates the timeframe and derives a multiplier that is applied to the PSAR Max attribute.

Delta Volume Channels [LucF]█ OVERVIEW
This indicator displays on-chart visuals aimed at making the most of delta volume information. It can color bars and display two channels: one for delta volume, another calculated from the price levels of bars where delta volume divergences occur. Markers and alerts can also be configured using key conditions, and filtered in many different ways. The indicator caters to traders who prefer chart visuals over raw values. It will work on historical bars and in real time, using intrabar analysis to calculate delta volume in both conditions.
█ CONCEPTS
Delta Volume
The volume delta concept divides a bar's volume in "up" and "down" volumes. The delta is calculated by subtracting down volume from up volume. Many calculation techniques exist to isolate up and down volume within a bar. The simplest techniques use the polarity of interbar price changes to assign their volume to up or down slots, e.g., On Balance Volume or the Klinger Oscillator . Others such as Chaikin Money Flow use assumptions based on a bar's OHLC values. The most precise calculation method uses tick data and assigns the volume of each tick to the up or down slot depending on whether the transaction occurs at the bid or ask price. While this technique is ideal, it requires huge amounts of data on historical bars, which usually limits the historical depth of charts and the number of symbols for which tick data is available.
This indicator uses intrabar analysis to achieve a compromise between the simplest and most precise methods of calculating volume delta. In the context where historical tick data is not yet available on TradingView, intrabar analysis is the most precise technique to calculate volume delta on historical bars on our charts. TradingView's Volume Profile built-in indicators use it, as do the CVD - Cumulative Volume Delta Candles and CVD - Cumulative Volume Delta (Chart) indicators published from the TradingView account . My Volume Delta Columns Pro indicator also uses intrabar analysis. Other volume delta indicators such as my Realtime 5D Profile use realtime chart updates to achieve more precise volume delta calculations. Indicators of that type cannot be used on historical bars however; they only work in real time.
This is the logic I use to assign intrabar volume to up or down slots:
• If the intrabar's open and close values are different, their relative position is used.
• If the intrabar's open and close values are the same, the difference between the intrabar's close and the previous intrabar's close is used.
• As a last resort, when there is no movement during an intrabar and it closes at the same price as the previous intrabar, the last known polarity is used.
Once all intrabars making up a chart bar have been analyzed and the up or down property of each intrabar's volume determined, the up volumes are added and the down volumes subtracted. The resulting value is volume delta for that chart bar, which can be used as an estimate of the buying/selling pressure on an instrument.
Delta Volume Percent (DV%)
This value is the proportion that delta volume represents of the total intrabar volume in the chart bar. Note that on some symbols/timeframes, the total intrabar volume may differ from the chart's volume for a bar, but that will not affect our calculations since we use the total intrabar volume.
Delta Volume Channel
The DV channel is the space between two moving averages: the reference line and a DV%-weighted version of that reference. The reference line is a moving average of a type, source and length which you select. The DV%-weighted line uses the same settings, but it averages the DV%-weighted price source.
The weight applied to the source of the reference line is calculated from two values, which are multiplied: DV% and the relative size of the bar's volume in relation to previous bars. The effect of this is that DV% values on bars with higher total volume will carry greater weight than those with lesser volume.
The DV channel can be in one of four states, each having its corresponding color:
• Bull (teal): The DV%-weighted line is above the reference line.
• Strong bull (lime): The bull condition is fulfilled and the bar's close is above the reference line and both the reference and the DV%-weighted lines are rising.
• Bear (maroon): The DV%-weighted line is below the reference line.
• Strong bear (pink): The bear condition is fulfilled and the bar's close is below the reference line and both the reference and the DV%-weighted lines are falling.
Divergences
In the context of this indicator, a divergence is any bar where the slope of the reference line does not match that of the DV%-weighted line. No directional bias is assigned to divergences when they occur.
Divergence Channel
The divergence channel is the space between two levels (by default, the bar's low and high ) saved when divergences occur. When price has breached a channel and a new divergence occurs, a new channel is created. Until that new channel is breached, bars where additional divergences occur will expand the channel's levels if the bar's price points are outside the channel.
Prices breaches of the divergence channel will change its state. Divergence channels can be in one of five different states:
• Bull (teal): Price has breached the channel to the upside.
• Strong bull (lime): The bull condition is fulfilled and the DV channel is in the strong bull state.
• Bear (maroon): Price has breached the channel to the downside.
• Strong bear (pink): The bear condition is fulfilled and the DV channel is in the strong bear state.
• Neutral (gray): The channel has not been breached.
█ HOW TO USE THE INDICATOR
Load the indicator on an active chart (see here if you don't know how).
The default configuration displays:
• The DV channel, without the reference or DV%-weighted lines.
• The Divergence channel, without its level lines.
• Bar colors using the state of the DV channel.
The default settings use an Arnaud-Legoux moving average on the close and a length of 20 bars. The DV%-weighted version of it uses a combination of DV% and relative volume to calculate the ultimate weight applied to the reference. The DV%-weighted line is capped to 5 standard deviations of the reference. The lower timeframe used to access intrabars automatically adjusts to the chart's timeframe and achieves optimal balance between the number of intrabars inspected in each chart bar, and the number of chart bars covered by the script's calculations.
The Divergence channel's levels are determined using the high and low of the bars where divergences occur. Breaches of the channel require a bar's low to move above the top of the channel, and the bar's high to move below the channel's bottom.
No markers appear on the chart; if you want to create alerts from this script, you will need first to define the conditions that will trigger the markers, then create the alert, which will trigger on those same conditions.
To learn more about how to use this indicator, you must understand the concepts it uses and the information it displays, which requires reading this description. There are no videos to explain it.
█ FEATURES
The script's inputs are divided in four sections: "DV channel", "Divergence channel", "Other Visuals" and "Marker/Alert Conditions". The first setting is the selection method used to determine the intrabar precision, i.e., how many lower timeframe bars (intrabars) are examined in each chart bar. The more intrabars you analyze, the more precise the calculation of DV% results will be, but the less chart coverage can be covered by the script's calculations.
DV Channel
Here, you control the visibility and colors of the reference line, its weighted version, and the DV channel between them.
You also specify what type of moving average you want to use as a reference line, its source and length. This acts as the DV channel's baseline. The DV%-weighted line is also a moving average of the same type and length as the reference line, except that it will be calculated from the DV%-weighted source used in the reference line. By default, the DV%-weighted line is capped to five standard deviations of the reference line. You can change that value here. This section is also where you can disable the relative volume component of the weight.
Divergence Channel
This is where you control the appearance of the divergence channel and the key price values used in determining the channel's levels and breaching conditions. These choices have an impact on the behavior of the channel. More generous level prices like the default low and high selection will produce more conservative channels, as will the default choice for breach prices.
In this section, you can also enable a mode where an attempt is made to estimate the channel's bias before price breaches the channel. When it is enabled, successive increases/decreases of the channel's top and bottom levels are counted as new divergences occur. When one count is greater than the other, a bull/bear bias is inferred from it.
Other Visuals
You specify here:
• The method used to color chart bars, if you choose to do so.
• The display of a mark appearing above or below bars when a divergence occurs.
• If you want raw values to appear in tooltips when you hover above chart bars. The default setting does not display them, which makes the script faster.
• If you want to display an information box which by default appears in the lower left of the chart.
It shows which lower timeframe is used for intrabars, and the average number of intrabars per chart bar.
Marker/Alert Conditions
Here, you specify the conditions that will trigger up or down markers. The trigger conditions can include a combination of state transitions of the DV and the divergence channels. The triggering conditions can be filtered using a variety of conditions.
Configuring the marker conditions is necessary before creating an alert from this script, as the alert will use the marker conditions to trigger.
Markers only appear on bar closes, so they will not repaint. Keep in mind, when looking at markers on historical bars, that they are positioned on the bar when it closes — NOT when it opens.
Raw values
The raw values calculated by this script can be inspected using a tooltip and the Data Window. The tooltip is visible when you hover over the top of chart bars. It will display on the last 500 bars of the chart, and shows the values of DV, DV%, the combined weight, and the intermediary values used to calculate them.
█ INTERPRETATION
The aim of the DV channel is to provide a visual representation of the buying/selling pressure calculated using delta volume. The simplest characteristic of the channel is its bull/bear state. One can then distinguish between its bull and strong bull states, as transitions from strong bull to bull states will generally happen when buyers are losing steam. While one should not infer a reversal from such transitions, they can be a good place to tighten stops. Only time will tell if a reversal will occur. One or more divergences will often occur before reversals.
The nature of the divergence channel's design makes it particularly adept at identifying consolidation areas if its settings are kept on the conservative side. A gray divergence channel should usually be considered a no-trade zone. More adventurous traders can use the DV channel to orient their trade entries if they accept the risk of trading in a neutral divergence channel, which by definition will not have been breached by price.
If your charts are already busy with other stuff you want to hold on to, you could consider using only the chart bar coloring component of this indicator:
At its simplest, one way to use this indicator would be to look for overlaps of the strong bull/bear colors in both the DV channel and a divergence channel, as these identify points where price is breaching the divergence channel when buy/sell pressure is consistent with the direction of the breach. I have highlighted all those points in the chart below. Not all of them would have produced profitable trades, but nothing is perfect in the markets. Also, keep in mind that the circles identify the visual you would be looking for — not the trade's entry level.
█ LIMITATIONS
• The script will not work on symbols where no volume is available. An error will appear when that is the case.
• Because a maximum of 100K intrabars can be analyzed by a script, a compromise is necessary between the number of intrabars analyzed per chart bar
and chart coverage. The more intrabars you analyze per chart bar, the less coverage you will obtain.
The setting of the "Intrabar precision" field in the "DV channel" section of the script's inputs
is where you control how the lower timeframe is calculated from the chart's timeframe.
█ NOTES
Volume Quality
If you use volume, it's important to understand its nature and quality, as it varies with sectors and instruments. My Volume X-ray indicator is one way you can appraise the quality of an instrument's intraday volume.
For Pine Script™ Coders
• This script uses the new overload of the fill() function which now makes it possible to do vertical gradients in Pine. I use it for both channels displayed by this script.
• I use the new arguments for plot() 's `display` parameter to control where the script plots some of its values,
namely those I only want to appear in the script's status line and in the Data Window.
• I wrote my script using the revised recommendations in the Style Guide from the Pine v5 User Manual.
█ THANKS
To PineCoders . I have used their lower_tf library in this script, to manage the calculation of the LTF and intrabar stats, and their Time library to convert a timeframe in seconds to a printable form for its display in the Information box.
To TradingView's Pine Script™ team. Their innovations and improvements, big and small, constantly expand the boundaries of the language. What this script does would not have been possible just a few months back.
And finally, thanks to all the users of my scripts who take the time to comment on my publications and suggest improvements. I do not reply to all but I do read your comments and do my best to implement your suggestions with the limited time that I have.

SUPPORT RESISTANCE STRATEGY [5MIN TF]A SUPPORT RESISTANCE BREAKOUT STRATEGY for 5 minute Time-Frame , that has the time condition for Indian Markets
The Timing can be changed to fit other markets, scroll down to "TIME CONDITION" to know more.
The commission is also included in the strategy .
The basic idea is when ,
1) Price crosses above Resistance Level ,indicated by Red Line, is a Long condition.
2) Price crosses below Support Level ,indicated by Green Line , is a Short condition.
3) Candle high crosses above ema1, is a part of the Long condition .
4) Candle low crosses below ema1, is a part of the Short condition .
5) Volume Threshold is an added confirmation for long/short positions.
6) Maximum Risk per trade for the intraday trade can be changed .
7) Default qty size is set to 50 contracts , which can be changed under settings → properties → order size.
8) ATR is used for trailing after entry, as mentioned in the inputs below.
// ═════════════════════════//
// ————————> INPUTS <————————— //
// ═════════════════════════//
→ L_Bars ———————————> Length of Resistance / Support Levels.
→ R_Bars ———————————> Length of Resistance / Support Levels.
→ Volume Break ———————> Volume Breakout from range to confirm Long/Short position.
→ Price Cross Ema —————> Added condition as explained above (3) and (4).
→ ATR LONG —————————> ATR stoploss trail for Long positions.
→ ATR SHORT ————————> ATR stoploss trail for Short positions.
→ RISK ————————————> Maximum Risk per trade intraday.
The strategy was back-tested on TCS ,the input values and the results are mentioned under "BACKTEST RESULTS" below.
// ═════════════════════════ //
// ————————> PROPERTIES<——————— //
// ═════════════════════════ //
Default_qty_size ————> 50 contracts , which can be changed under
Settings
↓
Properties
↓
Order size
// ═══════════════════════════════//
// ————————> TIME CONDITION <————————— //
// ═══════════════════════════════//
The time can be changed in the script , Add it → click on ' { } ' → Pine editor→ making it a copy [right top corner} → Edit the line 27.
The Indian Markets open at 9:15am and closes at 3:30pm.
The 'time_cond' specifies the time at which Entries should happen .
"Close All" function closes all the trades at 3pm , at the open of the next candle.
To change the time to close all trades , Go to Pine Editor → Edit the line 92 .
All open trades get closed at 3pm , because some brokers don't allow you to place fresh intraday orders after 3pm .
// ═══════════════════════════════════════════════ //
// ————————> BACKTEST RESULTS ( 100 CLOSED TRADES )<————————— //
// ═══════════════════════════════════════════════ //
INPUTS can be changed for better Back-Test results.
The strategy applied to NSE:TCS ( 5 min Time-Frame and contract size 50) gives us 60% profitability , as shown below
It was tested for a period a 6 months with a Profit Factor of 1.8 ,net Profit of 30,000 Rs profit .
Sharpe Ratio : 0.49
Sortino Ratio : 1.4
The graph has a Linear Curve with Consistent Profits.
The INPUTS are as follows,
1) L_Bars —————————> 4
2) R_Bars —————————> 4
3) Volume Break ————> 5
4) Price Cross Ema ——> 100
5) ATR LONG ——————> 2.4
6) ATR SHORT —————> 2.6
7) RISK —————————> 2000
8) Default qty size ——> 50
NSE:TCS
Save it to favorites.
Apply it to your charts Now !!
Thank You ☺ NSE:TCS

PIVOT STRATEGY [INDIAN MARKET TIMING]
A Back-tested Profitable Strategy for Free!!
A PIVOT INTRADAY STRATEGY for 5 minute Time-Frame , that also explains the time condition for Indian Markets
The Timing can be changed to fit other markets, scroll down to "TIME CONDITION" to know more.
The commission is also included in the strategy .
The basic idea is when ,
1) Price crosses above ema1 ,indicated by pivot highest line in green color .
2) Price crosses below ema1 ,indicated by pivot lowest line in red color .
3) Candle high crosses above pivot highest , is the Long condition .
4) Candle low crosses below pivot lowest , is the Short condition .
5) Maximum Risk per trade for the intraday trade can be changed .
6) Default_qty_size is set to 60 contracts , which can be changed under settings → properties → order size .
7) ATR is used for trailing after entry, as mentioned in the inputs below.
// ═════════════════════════//
// ————————> INPUTS <————————— //
// ═════════════════════════//
Leftbars —————> Length of pivot highs and lows
Rightbars —————> Length of pivot highs and lows
Price Cross Ema —————> Added condition
ATR LONG —————> ATR stoploss trail for Long positions
ATR SHORT —————> ATR stoploss trail for Short positions
RISK —————> Maximum Risk per trade for the day
The strategy was back-tested on RELIANCE ,the input values and the results are mentioned under "BACKTEST RESULTS" below .
// ═════════════════════════ //
// ————————> PROPERTIES<——————— //
// ═════════════════════════ //
Default_qty_size ————> 60 contracts , which can be changed under settings
↓
properties
↓
order size
// ═══════════════════════════════//
// ————————> TIME CONDITION <————————— //
// ═══════════════════════════════//
The time can be changed in the script , Add it → click on ' { } ' → Pine editor→ making it a copy [right top corner} → Edit the line 25 .
The Indian Markets open at 9:15am and closes at 3:30pm .
The 'time_cond' specifies the time at which Entries should happen .
"Close All" function closes all the trades at 3pm, at the open of the next candle.
To change the time to close all trades , Go to Pine Editor → Edit the line 103 .
All open trades get closed at 3pm , because some brokers don't allow you to place fresh intraday orders after 3pm .
NSE:RELIANCE
// ═══════════════════════════════════════════════ //
// ————————> BACKTEST RESULTS ( 128 CLOSED TRADES )<————————— //
// ═══════════════════════════════════════════════ //
INPUTS can be changed for better back-test results.
The strategy applied to NIFTY ( 5 min Time-Frame and contract size 60 ) gives us 60% profitability y , as shown below
It was tested for a period a 6 months with a Profit Factor of 1.45 ,net Profit of 21,500Rs profit .
Sharpe Ratio : 0.311
Sortino Ratio : 0.727
The graph has a Linear Curve with consistent profits .
The INPUTS are as follows,
1) Leftbars ————————> 3
2) Rightbars ————————> 5
3) Price Cross Ema ——————> 150
4) ATR LONG ————————> 2.7
5) ATR SHORT ———————> 2.9
6) RISK —————————> 2500
7) Default qty size ——————> 60
NSE:RELIANCE
Save it to favorites.
Apply it to your charts Now !!
↓
FOLLOW US FOR MORE !
Thank me later ;)

[blackcat] L3 Banker Fund AttackLevel 3
Background
This indicator is used to capture the movement of the banker fund. The buying and selling point is determined according to whether the momentum of the banker fund and the price momentum resonate.
How to use the indicator:
The red column line indicates that the banker fund accumulation signal appears, and the following 2 conditions are all satisfied to buy; (both above the green line of the banker fund attack threshold)
1. The yellow line and the purple line all cross the red accumulation histogram signal;
2. The yellow and purple trend lines are up
Key point: If the yellow line crosses the green line of the banker fund attack threshold, it will be pulled up or the big market will open! The main thing is to see the red accumulation histogram signal, or the green line that crosses the banker fund attack threshold. If there is a red accumulation histogram signal, it means that there are main low-acquisition chips, and start trading on the left to open a position. The area above the green line of the banker fund attack threshold belongs to the main force pulling stage. When the green line of the banker fund attack threshold is not broken upwards, there is still a lot of profit space, but if it can be effectively broken through, it is highly profitable!
Remarks
This indicator only effective for instruments that contains banker fund. If there is no obvious large fund inside, the indicator is not as meaningful as it is called.
I verified it worked well for > 4H or 1D timeframe. For the other time frames, you may need to check and verify by yourself.
Feedbacks are appreciated.

Step-MA Filtered Stochastic [Loxx]Step-MA Filtered Stochastic is a stochastic indicator with step moving average filtering. This smooths the signal by filtering out noise.
What is the Stochastic Indicator?
The stochastic oscillator, also known as stochastic indicator, is a popular trading indicator that is useful for predicting trend reversals. It also focuses on price momentum and can be used to identify overbought and oversold levels in shares, indices, currencies and many other investment assets.
The stochastic oscillator measures the momentum of price movements. Momentum is the rate of acceleration in price movement. The idea behind the stochastic indicator is that the momentum of an instrument’s price will often change before the price movement of the instrument actually changes direction. As a result, the indicator can be used to predict trend reversals.
The stochastic indicator can be used by experienced traders and those learning technical analysis. With the help of other technical analysis tools such as moving averages, trendlines and support and resistance levels, the stochastic oscillator can help to improve trading accuracy and identify profitable entry and exit points.
Included:
Bar coloring
3 signal variations w/ alerts
Loxx's Expanded Source Types
