Average True Range with Price MAATR with Price Moving Average Indicator
This custom indicator combines the Average True Range (ATR) with a Price Moving Average (MA) to help traders analyze market volatility in percent to the price.
Key Components:
Average True Range (ATR)
Price Moving Average (MA)
ATR/Price in Percent
ATR/Price in Percent
Purpose: This ratio helps traders understand the relative size of the ATR compared to the current price, providing a clearer sense of how significant the volatility is in proportion to the price level.
Calculation: ATR is divided by the current closing price and multiplied by 100 to express it as a percentage. This makes it easier to compare volatility across assets with different price ranges.
Plot: This is plotted as a percentage, making it easier to gauge whether the volatility is proportionally high or low compared to the asset's price.
Usage:
This indicator is designed to help identify the most volatile tokens, making it ideal for configuring a Grid Bot to maximize profit. By focusing on high-volatility assets, traders can capitalize on larger price swings within the grid, increasing the potential for more profitable trades.
Features:
Customizable Smoothing Method: Choose from RMA (Relative Moving Average), SMA (Simple Moving Average), EMA (Exponential Moving Average), or WMA (Weighted Moving Average) for both ATR and the Price Moving Average.
Dual Perspective: The indicator provides both volatility analysis (ATR) and trend analysis (Price MA) in a single view.
Proportional Volatility: The ATR/Price (%) ratio adds a layer of context by showing how volatile the asset is relative to its current price.
Cerca negli script per "profitable"

Fundamental AnalysisThis indicator compiles a wide range of essential financial metrics directly onto your chart, providing a quick and easy reference to the financial condition of any listed company. Instead of diving into lengthy financial reports, you get an at-a-glance overview of the most critical financial ratios and figures.
Key Metrics Included:
Interest Coverage Ratio: Helps assess a company’s ability to pay interest on its debt. Higher values suggest greater financial stability and lower default risk.
Gross Profit Margin: Shows how much profit a company makes after covering its production costs. A higher margin indicates better efficiency and profitability in managing costs.
Dividend Yield: Reflects the annual dividend payout as a percentage of the current stock price. A moderate dividend yield may indicate a balance between income generation and growth potential.
Enterprise Value (EV): A comprehensive measure of a company's total value, including debt. Useful for comparing companies with different capital structures.
Free Cash Flow to Equity (FCFE): Reveals how much cash is available to shareholders after accounting for capital expenditures and debt repayments, indicating the company’s ability to reward investors.
Price-to-Book Ratio (P/B): Compares a company's market value to its book value. Lower values might indicate undervaluation, while higher values can suggest overvaluation.
Price-to-Cash Flow Ratio (P/CF): Helps identify companies that generate a significant amount of cash relative to their price, a key metric for assessing liquidity and sustainability.
Price-to-Free Cash Flow Ratio: Shows how much investors are paying for the company's free cash flow, which is crucial for assessing value, especially in capital-intensive sectors.
Price Earnings Ratio (P/E): The classic metric for valuing a company based on its earnings. Useful for comparing valuations across companies and industries.
Debt-to-Equity Ratio: Indicates the proportion of company financing that comes from debt and equity. A lower ratio typically signifies a less risky investment.
Return on Equity (ROE): Measures how effectively a company uses equity capital to generate profit. A higher ROE can indicate a profitable, well-managed company.
Quick Ratio: Assesses a company’s short-term liquidity by comparing its liquid assets to its current liabilities. Higher values indicate better liquidity.
Operating Margin: Reflects the percentage of revenue left after covering operating expenses. Higher margins suggest greater operational efficiency.
How to Use This Indicator:
Use this indicator as part of your due diligence when analyzing potential investments. Each metric is color-coded to quickly highlight whether the value is within a favorable range, making it easy to identify strong or weak aspects of a company’s financial position.
Green indicates favorable metrics, suggesting financial strength or value.
Red highlights areas of concern, pointing to potential risks or weaknesses.
This tool can help you compare different companies, spot trends over time, and make more informed decisions based on solid financial analysis. Whether you’re a value investor looking for undervalued stocks, a dividend seeker searching for sustainable payouts, or a growth investor focused on profitability and efficiency, this indicator can be tailored to your strategy.

Lsma For Loop | viResearchLsma For Loop | viResearch
Conceptual Foundation and Innovation
The "Lsma For Loop" indicator offers a unique combination of the Least Squares Moving Average (LSMA) with a dynamic scoring system based on a loop function. By comparing the current LSMA value with historical values over a user-defined range, this indicator generates a detailed score that helps detect trend strength and potential reversals. This approach provides traders with a more nuanced analysis of price action, allowing them to identify trends earlier and with more accuracy.
The LSMA, which minimizes lag compared to traditional moving averages, is ideal for detecting trends as it provides a smooth and quick-to-respond line. When combined with the loop-based scoring system, traders can benefit from a powerful tool for analyzing market momentum and capturing profitable trends.
Technical Composition and Calculation
The "Lsma For Loop" script features two essential components:
Least Squares Moving Average (LSMA): The LSMA is calculated over a user-defined length using a linear regression model. It provides a smooth line that follows price trends more closely, reducing the noise that is often present in simple moving averages.
For Loop Scoring System: This system evaluates the LSMA over a range of previous values, generating a score based on whether the current LSMA is higher or lower than its previous values within the specified range. The resulting score reflects the strength of the trend, with higher scores indicating a stronger uptrend and lower scores signaling a downtrend.
Key Calculations:
LSMA Calculation: The LSMA is derived from the closing price over the selected period (len), providing a smooth moving average that fits the price data closely.
For Loop Scoring:
The loop iterates over a range of previous LSMA values, comparing the current LSMA to each past value.
If the current LSMA is higher than a previous value, a positive score is added; if it is lower, a negative score is added. The sum of these comparisons forms the overall score.
Features and User Inputs
The "Lsma For Loop" script offers a range of customization options, allowing traders to tailor the indicator to their specific trading strategies and market conditions:
LSMA Length: Adjust the length of the LSMA, controlling the smoothness of the indicator and how quickly it reacts to price changes.
Loop Range (From and To): Define the range over which the for loop evaluates LSMA values. This provides flexibility in assessing momentum over different timeframes.
Thresholds: Customizable threshold levels are used to define when the score indicates an uptrend or downtrend. This allows traders to fine-tune the sensitivity of the indicator to market movements.
Practical Applications
The "Lsma For Loop" is a versatile tool for traders who want to leverage the advantages of LSMA smoothing while gaining a more detailed view of trend strength. This indicator is particularly useful for:
Identifying Trend Reversals: The loop-based scoring system provides an early indication of potential trend reversals, allowing traders to react before major market movements.
Confirming Trend Strength: By evaluating the LSMA against a range of previous values, the script helps confirm whether a trend is strengthening or weakening.
Enhanced Market Positioning: The customizable range and thresholds enable traders to adapt the script to different market conditions, whether they are day trading or swing trading.
Advantages and Strategic Value
The primary advantage of the "Lsma For Loop" script lies in its ability to provide a more granular analysis of LSMA behavior through the use of the for loop. This dynamic approach reduces the likelihood of false signals and offers greater accuracy in detecting trends. The indicator’s versatility makes it a valuable tool for both short-term and long-term trading strategies.
Alerts and Visual Cues
The script includes built-in alert conditions to notify traders of key trend changes:
Lsma For Loop Long: Indicates a potential upward trend when the score exceeds the upper threshold.
Lsma For Loop Short: Signals a potential downward trend when the score falls below the lower threshold.
Additionally, visual cues such as background color changes highlight when the score crosses certain key levels, providing an easy-to-read representation of market trends directly on the chart.
Summary and Usage Tips
The "Lsma For Loop | viResearch" indicator provides traders with a powerful tool that combines LSMA smoothing with a dynamic loop-based scoring system for trend detection. Incorporating this script into your trading strategy can help improve trend identification and enhance decision-making around entries and exits. Whether you are trading in trending markets or looking for early reversal signals, this script offers a reliable and flexible solution.
Note: Backtests are based on past results and are not indicative of future performance.

Dema Vstop | viResearchTitle: Dema Vstop | viResearch
Conceptual Foundation and Innovation
The "Dema Vstop" indicator combines the Double Exponential Moving Average (DEMA) with the Volatility Stop (Vstop) concept to improve trend-following and trend-reversal signals. This script provides a more responsive and dynamic approach to identifying trends and capturing market movements by integrating these two powerful tools. It is particularly effective for traders who seek a balance between smoothing out price action and quickly adapting to volatile changes in the market.
The DEMA smooths the price action more effectively than a traditional moving average, while the Vstop introduces a volatility-adjusted stop-loss mechanism, allowing traders to adapt to the market's changing conditions. The result is a robust system that captures both trend direction and potential reversal points with improved precision.
Technical Composition and Calculation
At the core of the "Dema Vstop" script are two primary components:
Double Exponential Moving Average (DEMA): This is used to smooth the source price over a user-defined period (dema_len), making it ideal for trend identification.
Volatility Stop (Vstop): The Vstop mechanism uses the Average True Range (ATR) to adjust stop-loss levels based on market volatility, allowing the indicator to account for changes in market conditions.
Key Calculations:
DEMA Calculation: Based on the selected length and source, the DEMA smooths the price data.
Vstop Calculation: The ATR (with customizable length) is used to adjust the stop distance, and the Vstop level is calculated based on whether the price is trending up or down.
Features and User Inputs
The "Dema Vstop" script offers a high degree of customization:
DEMA Length and Source: Control the smoothness of the DEMA and the price data being smoothed.
Vstop Length: Customize the length of the ATR calculation to control how reactive the Vstop is to price volatility.
Multiplier: Adjust the sensitivity of the Vstop to market volatility. A higher multiplier results in a wider stop, while a lower multiplier tightens the stop, making it more sensitive to price changes.
Practical Applications
The "Dema Vstop" is designed for traders looking for a hybrid trend-following system that is both smooth and responsive. It can be particularly useful for:
Identifying Trends: The combination of DEMA and Vstop makes trend-following easier, helping traders stay in profitable positions longer.
Volatility Protection: The Vstop dynamically adjusts based on market volatility, providing a built-in risk management tool that reduces exposure to volatile markets.
Reversals and Entries: The Vstop helps identify potential reversals by flipping its stop level when the trend direction changes, making it effective for signaling entries and exits with improved accuracy.
Advantages and Strategic Value
The key advantage of the "Dema Vstop" script lies in its ability to offer smoother trend detection through the DEMA while dynamically adapting to volatility using the Vstop. This combination reduces false signals, providing traders with a more stable and reliable tool for trend trading. Additionally, the customizable parameters allow traders to fine-tune the indicator to suit different trading styles and market conditions.
Alerts and Visual Cues
The script comes with built-in alert conditions that trigger when a trend shift is detected:
- Dema Vstop Long: Signals a potential upward trend.
- Dema Vstop Short: Signals a potential downward trend.
These alerts ensure that traders can stay informed about critical market changes without constantly monitoring the chart.
Summary and Usage Tips
The "Dema Vstop | viResearch" script is an innovative trend-following tool that combines the smoothness of DEMA with the adaptive qualities of Vstop. By offering a customizable and dynamic system, this indicator helps traders navigate the complexities of volatile markets while reducing noise and false signals. Incorporating this script into your trading strategy can improve trend analysis and increase the accuracy of entries and exits.
Note: Backtests are based on past results and are not indicative of future performance.

Uptrick: RSI Histogram
1. **Introduction to the RSI and Moving Averages**
2. **Detailed Breakdown of the Uptrick: RSI Histogram**
3. **Calculation and Formula**
4. **Visual Representation**
5. **Customization and User Settings**
6. **Trading Strategies and Applications**
7. **Risk Management**
8. **Case Studies and Examples**
9. **Comparison with Other Indicators**
10. **Advanced Usage and Tips**
---
## 1. Introduction to the RSI and Moving Averages
### **1.1 Relative Strength Index (RSI)**
The Relative Strength Index (RSI) is a momentum oscillator developed by J. Welles Wilder and introduced in his 1978 book "New Concepts in Technical Trading Systems." It is widely used in technical analysis to measure the speed and change of price movements.
**Purpose of RSI:**
- **Identify Overbought/Oversold Conditions:** RSI values range from 0 to 100. Traditionally, values above 70 are considered overbought, while values below 30 are considered oversold. These thresholds help traders identify potential reversal points in the market.
- **Trend Strength Measurement:** RSI also indicates the strength of a trend. High RSI values suggest strong bullish momentum, while low values indicate bearish momentum.
**Calculation of RSI:**
1. **Calculate the Average Gain and Loss:** Over a specified period (e.g., 14 days), calculate the average gain and loss.
2. **Compute the Relative Strength (RS):** RS is the ratio of average gain to average loss.
3. **RSI Formula:** RSI = 100 - (100 / (1 + RS))
### **1.2 Moving Averages (MA)**
Moving Averages are used to smooth out price data and identify trends by filtering out short-term fluctuations. Two common types are:
**Simple Moving Average (SMA):** The average of prices over a specified number of periods.
**Exponential Moving Average (EMA):** A type of moving average that gives more weight to recent prices, making it more responsive to recent price changes.
**Smoothed Moving Average (SMA):** Used to reduce the impact of volatility and provide a clearer view of the underlying trend. The RMA, or Running Moving Average, used in the USH script is similar to an EMA but based on the average of RSI values.
## 2. Detailed Breakdown of the Uptrick: RSI Histogram
### **2.1 Indicator Overview**
The Uptrick: RSI Histogram (USH) is a technical analysis tool that combines the RSI with a moving average to create a histogram that reflects momentum and trend strength.
**Key Components:**
- **RSI Calculation:** Determines the relative strength of price movements.
- **Moving Average Application:** Smooths the RSI values to provide a clearer trend indication.
- **Histogram Plotting:** Visualizes the deviation of the smoothed RSI from a neutral level.
### **2.2 Indicator Purpose**
The primary purpose of the USH is to provide a clear visual representation of the market's momentum and trend strength. It helps traders identify:
- **Bullish and Bearish Trends:** By showing how far the smoothed RSI is from the neutral 50 level.
- **Potential Reversal Points:** By highlighting changes in momentum.
### **2.3 Indicator Design**
**RSI Moving Average (RSI MA):** The RSI MA is a smoothed version of the RSI, calculated using a running moving average. This smooths out short-term fluctuations and provides a clearer indication of the underlying trend.
**Histogram Calculation:**
- **Neutral Level:** The histogram is plotted relative to the neutral level of 50. This level represents a balanced market where neither bulls nor bears have dominance.
- **Histogram Values:** The histogram bars show the difference between the RSI MA and the neutral level. Positive values indicate bullish momentum, while negative values indicate bearish momentum.
## 3. Calculation and Formula
### **3.1 RSI Calculation**
The RSI calculation involves:
1. **Average Gain and Loss:** Calculated over the specified length (e.g., 14 periods).
2. **Relative Strength (RS):** RS = Average Gain / Average Loss.
3. **RSI Formula:** RSI = 100 - (100 / (1 + RS)).
### **3.2 Moving Average Calculation**
For the USH indicator, the RSI is smoothed using a running moving average (RMA). The RMA formula is similar to that of the EMA but is based on averaging RSI values over the specified length.
### **3.3 Histogram Calculation**
The histogram value is calculated as:
- **Histogram Value = RSI MA - 50**
**Plotting the Histogram:**
- **Positive Histogram Values:** Indicate that the RSI MA is above the neutral level, suggesting bullish momentum.
- **Negative Histogram Values:** Indicate that the RSI MA is below the neutral level, suggesting bearish momentum.
## 4. Visual Representation
### **4.1 Histogram Bars**
The histogram is plotted as bars on the chart:
- **Bullish Bars:** Colored green when the RSI MA is above 50.
- **Bearish Bars:** Colored red when the RSI MA is below 50.
### **4.2 Customization Options**
Traders can customize:
- **RSI Length:** Adjust the length of the RSI calculation to match their trading style.
- **Bull and Bear Colors:** Choose colors for histogram bars to enhance visual clarity.
### **4.3 Interpretation**
**Bullish Signal:** A histogram bar that moves from red to green indicates a potential shift to a bullish trend.
**Bearish Signal:** A histogram bar that moves from green to red indicates a potential shift to a bearish trend.
## 5. Customization and User Settings
### **5.1 Adjusting RSI Length**
The length parameter determines the number of periods over which the RSI is calculated and smoothed. Shorter lengths make the RSI more sensitive to price changes, while longer lengths provide a smoother view of trends.
### **5.2 Color Settings**
Traders can adjust:
- **Bull Color:** Color of histogram bars indicating bullish momentum.
- **Bear Color:** Color of histogram bars indicating bearish momentum.
**Customization Benefits:**
- **Visual Clarity:** Traders can choose colors that stand out against their chart’s background.
- **Personal Preference:** Adjust settings to match individual trading styles and preferences.
## 6. Trading Strategies and Applications
### **6.1 Trend Following**
**Identifying Entry Points:**
- **Bullish Entry:** When the histogram changes from red to green, it signals a potential entry point for long positions.
- **Bearish Entry:** When the histogram changes from green to red, it signals a potential entry point for short positions.
**Trend Confirmation:** The histogram helps confirm the strength of a trend. Strong, consistent green bars indicate robust bullish momentum, while strong, consistent red bars indicate robust bearish momentum.
### **6.2 Swing Trading**
**Momentum Analysis:**
- **Entry Signals:** Look for significant shifts in the histogram to time entries. A shift from bearish to bullish (red to green) indicates potential for upward movement.
- **Exit Signals:** A shift from bullish to bearish (green to red) suggests a potential weakening of the trend, signaling an exit or reversal point.
### **6.3 Range Trading**
**Market Conditions:**
- **Consolidation:** The histogram close to zero suggests a range-bound market. Traders can use this information to identify support and resistance levels.
- **Breakout Potential:** A significant move away from the neutral level may indicate a potential breakout from the range.
### **6.4 Risk Management**
**Stop-Loss Placement:**
- **Bullish Positions:** Place stop-loss orders below recent support levels when the histogram is green.
- **Bearish Positions:** Place stop-loss orders above recent resistance levels when the histogram is red.
**Position Sizing:** Adjust position sizes based on the strength of the histogram signals. Strong trends (indicated by larger histogram bars) may warrant larger positions, while weaker signals suggest smaller positions.
## 7. Risk Management
### **7.1 Importance of Risk Management**
Effective risk management is crucial for long-term trading success. It involves protecting capital, managing losses, and optimizing trade setups.
### **7.2 Using USH for Risk Management**
**Stop-Loss and Take-Profit Levels:**
- **Stop-Loss Orders:** Use the histogram to set stop-loss levels based on trend strength. For instance, place stops below support levels in bullish trends and above resistance levels in bearish trends.
- **Take-Profit Targets:** Adjust take-profit levels based on histogram changes. For example, lock in profits as the histogram starts to shift from green to red.
**Position Sizing:**
- **Trend Strength:** Scale position sizes based on the strength of histogram signals. Larger histogram bars indicate stronger trends, which may justify larger positions.
- **Volatility:** Consider market volatility and adjust position sizes to mitigate risk.
## 8. Case Studies and Examples
### **8.1 Example 1: Bullish Trend**
**Scenario:** A trader notices a transition from red to green histogram bars.
**Analysis:**
- **Entry Point:** The transition indicates a potential bullish trend. The trader decides to enter a long position.
- **Stop-Loss:** Set stop-loss below recent support levels.
- **Take-Profit:** Consider taking profits as the histogram moves back towards zero or turns red.
**Outcome:** The bullish trend continues, and the histogram remains green, providing a profitable trade setup.
### **8.2 Example 2: Bearish Trend**
**Scenario:** A trader observes a transition from green to red histogram bars.
**Analysis:**
- **Entry Point:** The transition suggests a potential
bearish trend. The trader decides to enter a short position.
- **Stop-Loss:** Set stop-loss above recent resistance levels.
- **Take-Profit:** Consider taking profits as the histogram approaches zero or shifts to green.
**Outcome:** The bearish trend continues, and the histogram remains red, resulting in a successful trade.
## 9. Comparison with Other Indicators
### **9.1 RSI vs. USH**
**RSI:** Measures momentum and identifies overbought/oversold conditions.
**USH:** Builds on RSI by incorporating a moving average and histogram to provide a clearer view of trend strength and momentum.
### **9.2 RSI vs. MACD**
**MACD (Moving Average Convergence Divergence):** A trend-following momentum indicator that uses moving averages to identify changes in trend direction.
**Comparison:**
- **USH:** Provides a smoothed RSI perspective and visual histogram for trend strength.
- **MACD:** Offers signals based on the convergence and divergence of moving averages.
### **9.3 RSI vs. Stochastic Oscillator**
**Stochastic Oscillator:** Measures the level of the closing price relative to the high-low range over a specified period.
**Comparison:**
- **USH:** Focuses on smoothed RSI values and histogram representation.
- **Stochastic Oscillator:** Provides overbought/oversold signals and potential reversals based on price levels.
## 10. Advanced Usage and Tips
### **10.1 Combining Indicators**
**Multi-Indicator Strategies:** Combine the USH with other technical indicators (e.g., Moving Averages, Bollinger Bands) for a comprehensive trading strategy.
**Confirmation Signals:** Use the USH to confirm signals from other indicators. For instance, a bullish histogram combined with a moving average crossover may provide a stronger buy signal.
### **10.2 Customization Tips**
**Adjust RSI Length:** Experiment with different RSI lengths to match various market conditions and trading styles.
**Color Preferences:** Choose histogram colors that enhance visibility and align with personal preferences.
### **10.3 Continuous Learning**
**Backtesting:** Regularly backtest the USH with historical data to refine strategies and improve accuracy.
**Education:** Stay updated with trading education and adapt strategies based on market changes and personal experiences.

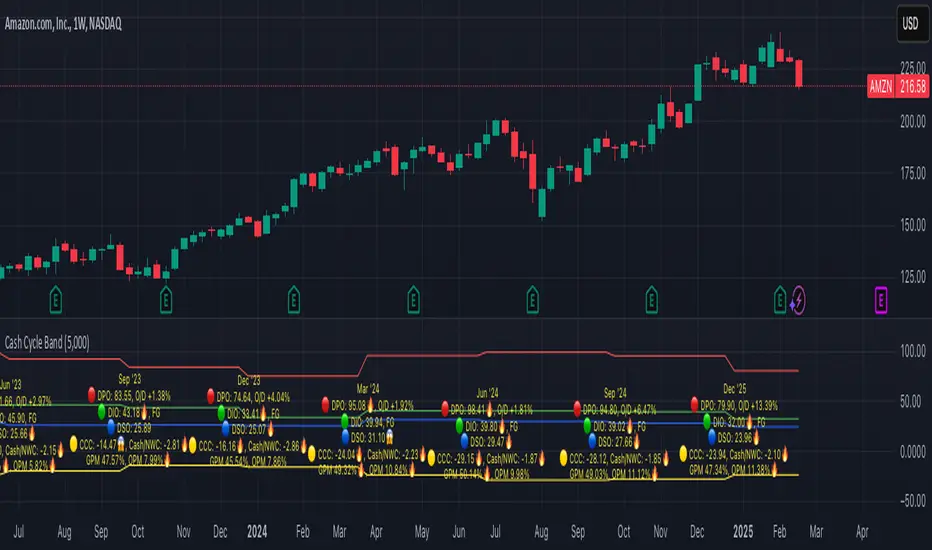
Cash Cycle BandCash cycle band shows the number of days and the profit margin compared to the previous period (it does not indicate how profitable the company is, but how well it is managed).
Cash cycle band consists of 6 sections:
1. DPO is the days payables outstanding in the "red" followed by O/D which is overdraft or short-term debt (if any) .
2. DIO is the days inventory outstanding in the "green" followed by classified inventory (if any) consists of finished goods. work in process and raw materials.
3. DSO is days sales outstanding in "blue".
4. DWC is days converting working capital to revenue in "orange".
5. CCC is days converting inventory and resources to cash flow in "yellow".
6. GPM is gross profit margin and OPM is operating profit margin.
The "😱" emoji indicates a value if it increases by more than or decreases by less than 20%, e.g.
- DPO, finished goods, work in process, raw materials, GPM, OPM is decreasing.
- O/D, DIO, DSO, DWC, CCC is increasing.
The "🔥" emoji indicates a value if it increases by more than or decreases, e.g.
- DPO, finished goods, work in process, raw materials, GPM, OPM is increasing.
- O/D, DIO, DSO, DWC, CCC is decreasing.
The order of the list depends on the day of each item, the more days more high.
Machine Learning Signal FilterIntroducing the "Machine Learning Signal Filter," an innovative trading indicator designed to leverage the power of machine learning to enhance trading strategies. This tool combines advanced data processing capabilities with user-friendly customization options, offering traders a sophisticated yet accessible means to optimize their market analysis and decision-making processes. Importantly, this indicator does not repaint, ensuring that signals remain consistent and reliable after they are generated.
Machine Learning Integration
The "Machine Learning Signal Filter" employs machine learning algorithms to analyze historical price data and identify patterns that may not be immediately apparent through traditional technical analysis. By utilizing techniques such as regression analysis and neural networks, the indicator continuously learns from new data, refining its predictive capabilities over time. This dynamic adaptability allows the indicator to adjust to changing market conditions, potentially improving the accuracy of trading signals.
Key Features and Benefits
Dynamic Signal Generation: The indicator uses machine learning to generate buy and sell signals based on complex data patterns. This approach enables it to adapt to evolving market trends, offering traders timely and relevant insights. Crucially, the indicator does not repaint, providing reliable signals that traders can trust.
Customizable Parameters: Users can fine-tune the indicator to suit their specific trading styles by adjusting settings such as the temporal synchronization and neural pulse rate. This flexibility ensures that the indicator can be tailored to different market environments.
Visual Clarity and Usability: The indicator provides clear visual cues on the chart, including color-coded signals and optional display of signal curves. Users can also customize the table's position and text size, enhancing readability and ease of use.
Comprehensive Performance Metrics: The indicator includes a detailed metrics table that displays key performance indicators such as return rates, trade counts, and win/loss ratios. This feature helps traders assess the effectiveness of their strategies and make data-driven decisions.
How It Works
The core of the "Machine Learning Signal Filter" is its ability to process and learn from large datasets. By applying machine learning models, the indicator identifies potential trading opportunities based on historical data patterns. It uses regression techniques to predict future price movements and neural networks to enhance pattern recognition. As new data is introduced, the indicator refines its algorithms, improving its accuracy and reliability over time.
Use Cases
Trend Following: Ideal for traders seeking to capitalize on market trends, the indicator helps identify the direction and strength of price movements.
Scalping: With its ability to provide quick signals, the indicator is suitable for scalpers aiming for rapid profits in volatile markets.
Risk Management: By offering insights into trade performance, the indicator aids in managing risk and optimizing trade setups.
In summary, the "Machine Learning Signal Filter" is a powerful tool that combines the analytical strength of machine learning with the practical needs of traders. Its ability to adapt and provide actionable insights makes it an invaluable asset for navigating the complexities of financial markets.
The "Machine Learning Signal Filter" is a tool designed to assist traders by providing insights based on historical data and machine learning techniques. It does not guarantee profitable trades and should be used as part of a comprehensive trading strategy. Users are encouraged to conduct their own research and consider their financial situation before making trading decisions. Trading involves significant risk, and it is possible to lose more than the initial investment. Always trade responsibly and be aware of the risks involved.

Price & Volume Breakout Fibonacci Probability [TradeDots]📝 OVERVIEW
The "Price & Volume Breakout Fibonacci Probability" indicator is designed to detect the probability of the maximum run-up and drawdown of each breakout trade on an asset, assisting traders in optimizing their take profit and stop loss strategies.
🧮 CALCULATIONS
The algorithm detects price and volume breakouts to activate the Fibonacci levels displayed on the chart. It calculates these levels using the period pivot high and low, with the close price of the breakout bar as the reference price.
The indicator then forward-tests within an user-selected number of bars, detecting the maximum run-up and drawdown during that period. Consequently, it calculates the probability of the price hitting either side of the Fibonacci levels, showing the likelihood of reaching take profit and stop loss targets for each breakout trade.
📊 EXAMPLE
The above example shows two breakout trades, circled within the yellow rectangle zone.
The first trade has a maximum run-up above the +0.382 Fibonacci level zone and a maximum drawdown below the -0.618 Fibonacci level zone.
When the price reaches the maximum run-up, it only has a ~45% probability of moving further upward into the last two zones (25% + 19.44%). This indicates that setting a take profit at a higher level may have less than a 50% chance of success.
Conversely, when the price reaches its maximum drawdown, there is only an ~8% probability of moving further downward into the last drawdown zone. This could indicate a potential reversal.
⚙️ SETTINGS
Breakout Condition: Determines the type of breakout condition to track: "Price", "Volume", "Price & Volume".
Backtest Period: The maximum run-up and drawdown are detected within this bar period.
Price Breakout Period: Specifies the number of bars the price needs to break out from.
Volume Breakout Period: Specifies the number of bars the volume needs to break out from.
Trendline Confirmation: Confirms that the close price needs to be above the trendline.
📈 HOW TO USE
By understanding the probabilities of price movements to both the upside and downside, traders can set take profit and stop loss targets with greater accuracy.
For instance, placing a stop loss order below the zone with the highest probability minimizes the chances of being stopped out of a profitable trade. Conversely, setting a take profit target at the zone with the highest probability increases the win rate.
Additionally, if the price breaches multiple Fibonacci levels during the breakout period, it may indicate an abnormal state, signaling a potential reversal or pullback. This can help traders exit trades in a timely manner.
Traders can adjust their take profit and stop loss levels based on their individual risk tolerance.
RISK DISCLAIMER
Trading entails substantial risk, and most day traders incur losses. All content, tools, scripts, articles, and education provided by TradeDots serve purely informational and educational purposes. Past performances are not definitive predictors of future results.

Gabriel's Relative Unrealized Profit with Dynamic MVRV Histogram
Certainly! Here’s an enhanced description of the Gabriel's Relative Unrealized Profit with Dynamic MVRV Histogram indicator with detailed usage instructions and explanations of why it's effective:
Gabriel's Relative Unrealized Profit with Dynamic MVRV Histogram
Description:
The Gabriel's Relative Unrealized Profit with Dynamic MVRV Histogram is an advanced trading indicator designed to offer in-depth insights into asset profitability and market valuation. By integrating Relative Unrealized Profit (RUP) and the Market Value to Realized Value (MVRV) Ratio, this indicator provides a nuanced view of an asset's performance and potential trading signals.
Key Components:
SMA Length and Volume Indicator:
SMA Length: Defines the period for the Simple Moving Average (SMA) used to calculate the entry price, defaulted to 14 periods. This smoothing technique helps estimate the average historical price at which the asset was acquired.
Volume Indicator: Allows selection between "volume" and "vwap" (Volume-Weighted Average Price) for calculating entry volume. The choice impacts the calculation of entry volume, either based on standard trading volume or a weighted average price.
Realized Price Calculation:
Computes the average price over a specified period (default of 30 periods) to establish the realized price. This serves as a benchmark for evaluating the cost basis of the asset.
MVRV Calculation:
Current Price: The most recent closing price of the asset, representing its market value.
Total Cost: Calculated as the product of the entry price and entry volume, reflecting the total investment made.
Unrealized Profit: The difference between the current price and the entry price, multiplied by entry volume, indicating profit or loss that has yet to be realized.
Relative Unrealized Profit: Expressed as a percentage of the total cost, showing how much profit or loss exists relative to the initial investment.
Market Value and Realized Value: Market Value is the current price multiplied by entry volume, while Realized Value is the realized price multiplied by entry volume. The MVRV Ratio is obtained by dividing Market Value by Realized Value.
Normalization:
Normalizes both Relative Unrealized Profit and MVRV Ratio to a standardized range of -100 to 100. This involves calculating the minimum and maximum values over a 100-period window to ensure comparability and relevance.
Histogram Calculation:
The histogram is derived from the difference between the normalized Relative Unrealized Profit and the normalized MVRV Ratio. It visually represents the disparity between the two metrics, highlighting potential trading signals.
Plotting and Alerts:
Plots:
Normalized Relative Unrealized Profit (Blue Line): Plotted in blue, this line shows the scaled measure of unrealized profit. Positive values indicate potential gains, while negative values suggest potential losses.
Normalized MVRV Ratio (Red Line): Plotted in red, this line represents the scaled MVRV Ratio. Higher values suggest that the asset’s market value significantly exceeds its realized value, indicating potential overvaluation, while lower values suggest potential undervaluation.
Histogram (Green Bars): Plotted in green, this histogram displays the difference between the normalized Relative Unrealized Profit and the normalized MVRV Ratio. Positive bars indicate that the asset’s profitability is exceeding its market valuation, while negative bars suggest the opposite.
Alerts:
High Histogram Alert: Activated when the histogram value exceeds 50. This condition signals a strong positive divergence, indicating that the asset's profitability is outperforming its market valuation. It may suggest a buying opportunity or indicate that the asset is undervalued relative to its potential profitability.
Low Histogram Alert: Triggered when the histogram value falls below -50. This condition signals a strong negative divergence, indicating that the asset's profitability is lagging behind its market valuation. It may suggest a selling opportunity or indicate that the asset is overvalued relative to its profitability.
How to Use the Indicator:
Setup: Customize the SMA Length, Volume Indicator, and Realized Price Length based on your trading strategy and asset volatility. These parameters allow you to tailor the indicator to different market conditions and asset types.
Interpretation:
Blue Line (Normalized Relative Unrealized Profit): Monitor this line to gauge the profitability of holding the asset. Significant positive values suggest that the asset is currently in a profitable position relative to its purchase price.
Red Line (Normalized MVRV Ratio): Use this line to assess whether the asset is trading at a premium or discount relative to its cost basis. Higher values may indicate overvaluation, while lower values suggest undervaluation.
Green Bars (Histogram): Observe the histogram for deviations between RUP and MVRV Ratio. Large positive bars indicate that the asset's profitability is strong relative to its valuation, signaling potential buying opportunities. Large negative bars suggest that the asset's profitability is weak relative to its valuation, signaling potential selling opportunities.
Trading Strategy:
Bullish Conditions: When the histogram shows large positive values, it suggests that the asset’s profitability is strong compared to its valuation. Consider this as a potential buying signal, especially if the histogram remains consistently positive.
Bearish Conditions: When the histogram displays large negative values, it indicates that the asset’s profitability is weak compared to its valuation. This may signal a potential selling opportunity or caution, particularly if the histogram remains consistently negative.
Why This Indicator is Effective:
Integrated Metrics: Combining Relative Unrealized Profit and MVRV Ratio provides a comprehensive view of asset performance. This integration allows traders to evaluate both profitability and market valuation in one cohesive tool.

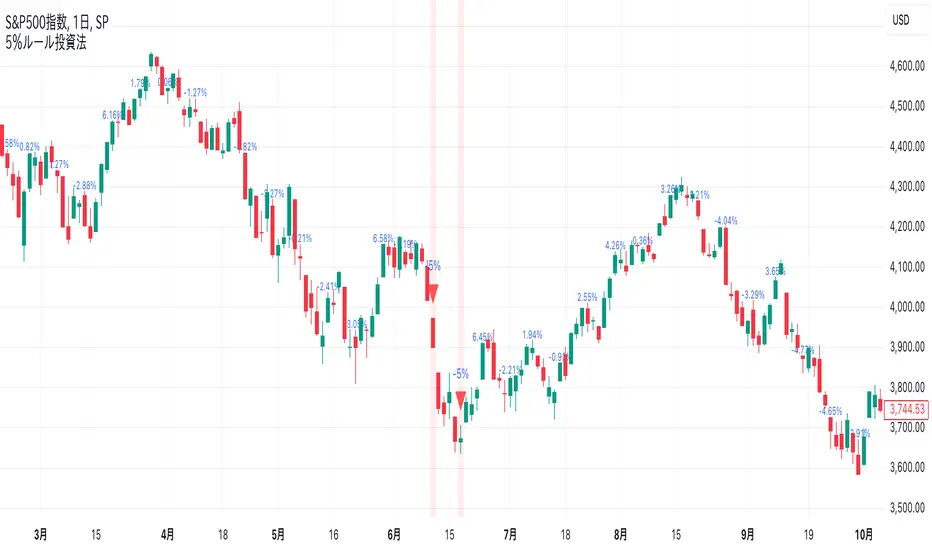
-5% Rule Investment Method @Ray_SP500NISASigns are displayed on the chart when the price drops more than 5% from the previous week. Otherwise, the previous week's change is displayed in a smaller size.
Buy if it falls 5% or more from the previous week, and do not buy if it does not fall. The sign is for the sole purpose of making it easier to understand.
This method is expected to be more effective and profitable than this method alone when used in conjunction with accumulation investing.
Details of the 5% Rule Investment Method
It is basically designed to be applied to the S&P 500.
The sign to follow is a simple rule: buy only when the S&P 500 has fallen 5% or more from the previous week. This makes this investment method easy for beginners.
Combined with accumulation: This method, when used in conjunction with accumulation, can be expected to produce higher returns than when used alone.
As an added bonus, we also provide a sign when the market rises 10% or more from the previous week, which is something to keep in mind.
Supertrend with Extreme SignalsOriginality and Usefulness
The "Supertrend with Extreme Signals" indicator is an innovative tool I've developed to combine the strengths of the Supertrend indicator with the RSI (Relative Strength Index). This combination enhances the accuracy of entry and exit signals, making it more useful for traders looking to gain a comprehensive understanding of market conditions.
Justification for Mashup:
Supertrend: This is a trend-following indicator that identifies the current market trend and potential reversal points by adjusting dynamically based on market volatility.
RSI: A momentum oscillator that measures the speed and change of price movements. It helps pinpoint overbought and oversold conditions, adding an extra layer of confirmation to trend signals.
By merging these two indicators, the script filters out false signals and improves the precision of trade entries and exits. The Supertrend identifies the trend direction, while the RSI confirms the strength and potential reversals within that trend.
Description
Overview
The "Supertrend with Extreme Signals" indicator is a powerful hybrid tool that brings together the trend-following capability of the Supertrend and the momentum analysis of RSI. This integration provides clear buy and sell signals, helping traders make more informed decisions.
What It Does
Trend Identification: Utilizes the Supertrend to determine the prevailing market trend.
Signal Confirmation: Uses RSI to confirm signals by identifying overbought and oversold conditions.
Buy and Sell Signals: Generates buy signals when the price crosses above the Supertrend line and RSI indicates oversold conditions. Generates sell signals when the price crosses below the Supertrend line and RSI indicates overbought conditions.
How It Works
Supertrend Calculation:
Calculates the Average True Range (ATR) to assess market volatility.
Computes upper and lower levels based on the mid-price and ATR.
Determines trend direction by smoothing these levels over a specified period.
Dynamically adjusts the Supertrend value based on market conditions.
RSI Calculation:
Calculates the RSI over a defined period to measure price momentum.
Uses RSI levels to identify overbought (above 70) and oversold (below 30) conditions.
Signal Generation:
Buy Signal: Triggered when the price crosses above the Supertrend line and RSI is below the oversold threshold.
Sell Signal: Triggered when the price crosses below the Supertrend line and RSI is above the overbought threshold.
How to Use It
Trend Following: Use the Supertrend color to identify the current trend (green for uptrend, red for downtrend).
Entry Signals: Look for buy signals (green label) when the price crosses above the Supertrend line and RSI is in the oversold zone.
Exit Signals: Look for sell signals (red label) when the price crosses below the Supertrend line and RSI is in the overbought zone.
Visual Confirmation: The background color changes based on the trend direction, providing a quick visual cue for the current market state.
This script is especially useful for traders who combine trend-following strategies with momentum indicators. It helps filter out false signals and provides a robust framework for identifying profitable trading opportunities.
Concepts Underlying Calculations
ATR (Average True Range): Measures market volatility by calculating the average range of price movements over a specified period.
Supertrend: A trend-following indicator that adjusts dynamically based on market volatility.
RSI (Relative Strength Index): A momentum oscillator that measures the speed and change of price movements, helping to identify overbought and oversold conditions.
By combining these concepts, the "Supertrend with Extreme Signals" indicator offers a balanced approach to trading. It considers both trend direction and market momentum, making it a powerful tool for improving trading performance through informed market analysis.

NOVO ALGO - Starry SkyGeneral Description:
This indicator provides the possible buy and sell entry with the estimated risk and its corresponding Stop Loss (SL) value.
It has originally developed for 1-min chart and works the best on this time-frame. It may work on the other time-frames, but its profitability has not been checked. So, I would rather recommend to use and apply it only on 1-min chart.
Novelty of the indicator:
Trading in 1-min chart consists of dealing with so many small swings and price variations which are very local and does not affect the general trend even in the 5-min time frame.
We call these small price variations and swings 'Noise'.
The novelty of the indicator is in a parameter which we call the Noise Level and filtering length.
It has been widely used in the Fluid Dynamics and in the Large Eddy Simulations where small noises of flow is removed by a dynamic filter.
In this indicator, we have tried to incorporate the same idea but in the price trend detection.
For the current version, we have used a less tolerance for noise level which results in much less signals compared to the full capacity of the indicator. It roughly sends out around 10-15% of the total confirmed positions.
How it detects the entry positions
To define the entry point, 5 main properties are considered and checked at 3 main time frames including 1-min, 5-min, and 15-min.
These time-frames are selected based on the fact that the target chart is in 1-min.
The 5 properties evaluated are:
1- Smooth Moving Average
2- Bollinger Band
3- Price Regression
4- Candle Pattern
5- Volume
Detailed Description:
Detect a possible entry by Smooth Moving Average:
- At each time frame, 3 lengths are considered to calculate the price moving average values; i.e. short, medium and long lengths.
- The interaction of these MAs, of course, defines the local trend of the price generally. It also provides an idea about the strength of the trend.
- The information calculated at 1-min time frame triggers the possible buy/sell. However, it waits until getting confirmation from the upper time frame (5-min).
- We use the MAs of 15-min time frame to define the general dominant price trend and stop reverse signals when the trend is fully dominant in one direction.
When a possible entry position is triggered by the MAs, at that very price bar we calculate the noise level.
If the noise level is higher than a certain predefined value, then the signal is rejected. Otherwise the signal gets out.
The threshold we use to define if a signal is noisy or not is normalized so it can be used without any concern at different markets.
We believe the calculations and ideas behind the Noise Level is what makes this indicator unique and practical.
We define the noise level parameter based on the following properties:
1- Smooth Moving Average at upper time frame (basically 15-min):
If a possible signal is against the trend of the upper time-frame, the noise level is increased.
If it is in the direction of the upper time-frame trend, then the noise level is untouched.
As already mentioned, different lengths are used. So, as the length of MA is larger its impact on the noise level is considered higher.
2- Bollinger Band of upper time frames (5-min and 15-min)
We employ bollinger bands to define 4 regions.
1. Above the upper band
2. Between middle and upper band
3. Between Lower and middle bands
4. Below the lower band
Then use these 4 regions along with the candle position and price regression.
For example, if the price regression line and candle position are on the same region of BB, then we assume less possibility for reverse or strong trend.
Consequently, we increase the noise level parameter. On the other hand, if they belong to two different region, we assume more possibility for big price change, and so we lower the noise level.
3- Price Regression
We use average price regression line to filter out very small swings in the price. We have also set a criterion of continuity for the regression line that ensures small price variation and swings are left out and filtered.
This will come with the sot of delay in the confirmation of signal, but we found it very important to remove very small swings of price that, for example, consists of only few bars in 1-min chart.
We have also used the position of the regression line along with the regions defied by BBs to evaluate the strength of a newly detected trend.
As candles will always reach to the regression at some point, if a possible entry is detected and the regression line and candles belong to two different region, we assume a strong price change. But if they belong to the same region, we increase the noise level and will assume that it might be a small swing.
4- Candle Pattern
We assumed several rules for candles shape and prices to define if a price movement is strong or it is just a small swing. For example we expect the price to be increase in the last 2-3 candles if we should call a entry for long position.
These set of self-made rules have been extracted by using the visual inspections of the price movement. This has been done much more advanced for long entry position which has resulted in more long signals by the indicator.
5- Volume
We use volume of trades in 1-min, 5-min, and 15-min to evaluate the strength of the trend. We use both absolute and what we call directional volume! The directional volume is the volume with the sign of the candle. This helps us to know if the reverse trend supported by enough volume or it is just a small swing.
For example, if the directional volume of 1-min can surpass the 5-min directional volume, this indicates to us that the importance of 5-min data and its validity is less. So, more focus will be put on the 1-min volume data and the direction it indicates.
Money Management:
Profit calculation: the profit is calculated based on the user defined leverage (default 100x). The user has the option to change the buy/sell leverages to the desired values.
Risk assessment: The user has the option to adjust the risk of the trades. Then the SL value will be calculated for each trade according to the defined risk value.
If a value of zero is set for the risk, then the indicator will define the local SL of each trade based on the pivot point.
As in 1-min trading, the prices are noise and include several small swings and consequently several minor pivot points, we filtered the pivot points that belong to the super small swings detected by our noise level indicator.
Suggestion
I found it more profitable to make the trades risk-free when their profits passes 10% (with leverage 100x). Then, readjust the TP of trades if the trend is in the direction of the position.
I would recommend to observe the performance of the indicator for a day or two, before actually trading with its signals. This will help to have a better understanding of the leverage and risk you may apply.

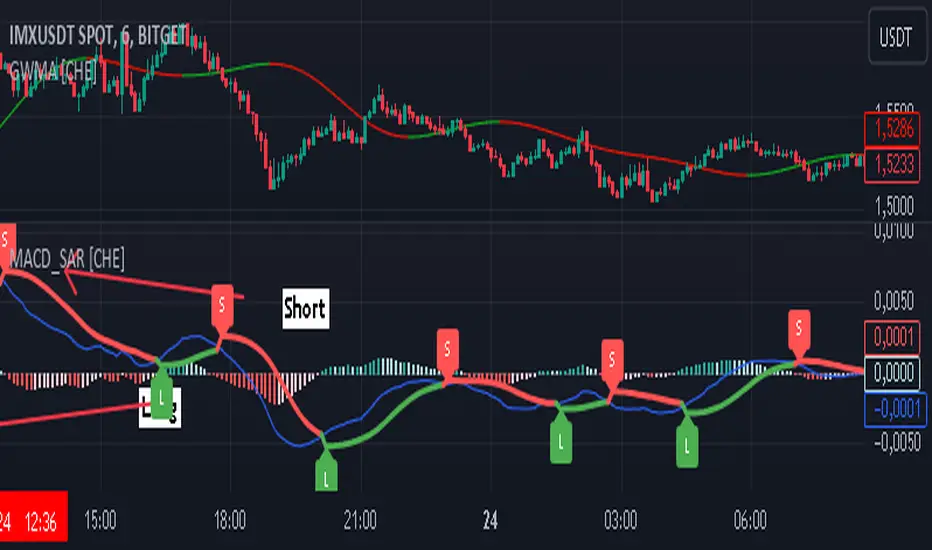
MACD with SAR Indicator [CHE] MACD with SAR Indicator
Introduction
"The whole is greater than the sum of its parts. " The "MACD with SAR Indicator" is an innovative technical analysis tool that combines the strengths of the Moving Average Convergence Divergence (MACD) indicator with the Parabolic Stop and Reverse (SAR) indicator. This indicator provides traders with an enhanced method to detect trend changes and determine optimal entry and exit points in the market by using the SAR based on the MACD line to better identify reversal points. The combination generates clear trend reversal signals, which are visually represented through long (L) and short (S) signals on the chart.
Originality and Usefulness
This indicator differs from traditional MACD or SAR indicators by combining the trend-following calculations of the SAR with the trend strength and momentum calculations of the MACD. This enables a more precise identification of trend changes and provides clear buy and sell signals, which is particularly useful for manual traders.
Key Features and Functionality
1. Combination of MACD and SAR
- Why this Combination?: The MACD is known for its ability to measure the strength and direction of a trend, while the SAR is specifically designed to identify reversal points. By combining these two indicators, traders can better understand both the trend strength and potential turning points in the market.
- How Components Work Together: The MACD measures the difference between fast and slow moving averages, indicating market momentum. The SAR follows the MACD line instead of the price and marks potential reversal points more accurately. When the MACD signals a new trend and the SAR confirms it, the indicator provides reliable trading opportunities.
2. Adjustable Parameters
- MACD Settings: Users can adjust the lengths of the fast and slow moving averages (default: 28 and 38 periods) and the signal smoothing (default: 9 periods) to tailor the indicator to different market conditions.
- SAR Settings: Users can adjust the start value (default: 0.01), increment (default: 0.01), and maximum value (default: 0.18) of the SAR to control sensitivity and responsiveness.
3. Visual Representation and Signals
- Color-Coded Histograms: The histogram shows the difference between the MACD and signal line and is color-coded to highlight the direction of the trend.
- Signal Labels: The indicator automatically adds "L" (Long) and "S" (Short) labels on the chart to show the current positions to traders.
4. Alert Settings
- Custom Alerts: Alerts can be set to notify traders when the MACD and SAR experience significant state changes, such as when the histogram switches from rising to falling or vice versa.
5. Toggle Display
- Display Mode: Users can toggle the display of the MACD_SAR oscillator and MACD to focus on the information most relevant to their trading strategy.
Application and Benefits
- Versatility: This indicator can be used in various market conditions and for different trading strategies, including trend following and reversal trading.
- Ease of Interpretation: The clear visual representation and automatic signals make it easier for traders to identify trading opportunities and track trends.
- Customizability: With numerous settings options, the indicator can be tailored to individual preferences and specific market conditions.
Conclusion
The "MACD with SAR Indicator" is a valuable tool for traders seeking precise and reliable signals to identify market trends and make profitable trading decisions. With its extensive customization options, powerful features, and the ability to toggle displays, this indicator provides excellent support for technical analysis.
By emphasizing the synergy between the MACD and SAR indicators, highlighting the default settings, and clarifying that the SAR is based on the MACD line and generates clear trend reversal signals through long and short labels, this revised description should help users understand the functionalities and advantages of your indicator while meeting TradingView's publication requirements.
Best regards Chervolino
GG Short & Long IndicatorGG Short & Long Indicator is a powerful signal indicator with AI
How do indicator signals work?
The main purpose of the indicator is to give a signal that is most likely to bring profit based on historical data. This ORIGINAL trend algorithm gives SHORT and LONG signals when several conditions coincide: 1) Breakout of the average value of the modernized VWAP (this VWAP takes data only from certain time periods and trading sessions, as a result, its breakout most often coincides with the beginning of a strong trend); 2) The previous condition must be confirmed by volumes. I noticed that on some crypto exchanges, depending on whether the breakout is false or true, the volumes are different relative to each other. I applied this knowledge for additional filtering of signals (this point works only on crypto assets, on other assets the algorithm works without taking it into account, maybe later I will refine it); 3) When some of my original formulas to determine overbought (similar in principle to RSI, but more designed to work with the trader algorithm), should not show overbought - so that the entry into the transaction was not at too unfavorable values. To summarize, the algorithm tries to find a balance to determine a true breakout, during which the price will not go too far (for an acceptable RR).
But the most important thing is that the parameters to customize the algorithm are governed by our original AI algorithm. It can adjust the indicator in two modes: 1) Settings are selected based on the most profitable historical settings. 2) The settings are selected based not only on historical profitability, but also on winrate, frequency of trades, and a few other items that we will not disclose (so the code is closed) - we consider this approach as a priority, because according to our observations, it gives the highest performance compared to manual tuning. In addition, AI simply simplifies the work with the indicator - you do not need to adjust the settings manually for different trading pairs or timeframes, AI will do it all by itself and immediately give the ready result (backtest) on the table.
How to trade?
After the signal is issued, the indicator determines the recommended levels to close the trade (green dots). Stop loss should be placed behind the corresponding gray SL mark. Levels for closing a deal (TP) and the level of stop loss setting (SL) are also determined automatically for the selected pair and TF, based on volatility and selected indicator settings
To make a trade, you can also use the built-in “Support and Resistance Zones” tool, which displays ranges on the chart based on the modernized ATR, from which the price is more likely to rebound (here I also used my own approach, where in addition to the classic ATR formula, I also used volumes from certain crypto exchanges to determine more accurate price rebound zones)
These zones are also adjusted by AI - the algorithm compares several dozens of variations of these zones (with different settings) and chooses the one that best fits the current settings of the signal algorithm. For example, if the indicator is set up for frequent trades - the zones will be updated faster and will be less deep than if the indicator is set up for medium-term trading
If desired, you can customize the indicator manually using the corresponding section of the settings. Each paramater has a tooltip describing how and what it affects.
Statistisc panel
The panel can be divided into 2 conditional parts:
1) Statistics for each individual TP for the selected strategy. It shows the winrate and gross profit, if you fix a trade on a single target completely
2) Total trading result, if you trade clearly according to the strategy and fix the position by equal hours on 4 TPs. The total trading result is displayed for the current indicator settings, it also shows the best, worst and optimal of the possible indicator settings and the trading result of these settings on the side.
How do setup the indicator?
The indicator has preset settings for several major pairs and timeframes. These are fixed settings specifically selected for individual pairs and timeframes. You can use these presets, or you can choose one of the adaptive settings, which will AUTOMATICALLY select the best/optimal indicator settings.
I recommend choosing the “Adaptive Optimal” preset, as it uses more data to determine the optimal indicator settings and according to my observations this method works better in comparison to manual indicator settings or the “Adaptive Best” preset
Or you can use the manual settings, as mentioned earlier.

ICSM (Impulse-Correction & SCOB Mapper) [WinWorld]DESCRIPTION
ICSM (Impulse-Correction SCOB Mapper) is the indicator that analyzes the price movement and identifies valid impulses, corrections and SCOBs. It is a powerful tool that can be used with any type of technical analysis because it's flexible, informative, easy to use and it does substantially improve trader's awareness of the most liquid zones of interest.
SETTINGS
General | Visuals
Colour theme — defines the colour theme of the ICSM.
SCOB | Visuals
Show SCOB — enables/disables SCOB;
Mark SCOB with — represents a list of style options for SCOB representation;
SCOB colour — defines the colour of the SCOB;
ICM | Visuals
Show ICM lines — enables/disables ICM (Impulse-Correction Mapper) lines;
Show IC trend — enables/disables visualization of impulse-correction trend via coloured divider at the bottom of the chart;
Line colour — defines the colour of the ICM lines;
Line style — defines the style of the ICM lines;
Alerts
ICM — enables/disables alert for breaking ICM lines;
SCOB — enables/disables alert for SCOB creation;
ICM+SCOB — enables/disables alert for SCOB occurance at the end of the single impulse/correction, which grabs ICM line's liquidity.
ICM+SCOB (same candle) — enables/disables alert for SCOB occurance at the candle, which grabs ICM line's liquidity.
IMPORTANT CONCEPTS
In order to fully understand what ICSM can do, let's do a quick overview of the most important concepts that this indicator is built on.
By ICM we mean the liquidity grabbing of Impulse-Correction Mapper's lines (ICM lines; represented as dashed horizontal lines on the chart ). Saying shortly, liquidity grabs of ICM lines posses great opportunities for finding great entries.
SCOB (Single Candle Order Block) builds up by 3 simple rules:
Previous candle's liquidity is grabbed;
Current candle closes inside previous candle;
Imbalance occurs on the next candle.
SCOB is a quite useful zone of interest, from which the price usually reverses. You can also use SCOB as POI* on HTF** or as entry zone on LTF***.
* POI — Point Of Interest
* HTF — Higher TimeFrame
* LTF — Lower TimeFrame
"ICM+SCOB" is a short name that we use for event, at which price first grabs the liquidity from ICM line and then creates a SCOB at the same impulse/correction movement ( on the same ICM line, that does the liquidity grab ). Usually the SCOB that occurs after this event represents a highly liquid zone of interest , which should be considered when choosing entry level.
"ICM+SCOB (same candle)" is basically the same as "ICM+SCOB" event but with one major difference — the candle, which grabs the liquidity of ICM line, is also the candle at which the SCOB occurs, making such SCOB an even better zone of interest than a regular SCOB from ICM+SCOB event.
BIGGEST ADVANTAGES
ICSM precisely identifies impulses and corrections. Huge load of indicators on the TradingView does only show the simplest zones of interests, while ICSM uses our team's signature algorithms to precisely identify true impulses and corrections in the market, allowing traders to see both local and global price direction better and at the same time providing traders with the most liquid zones of interest;
ICSM shows points of interest and liquidity. The indicator identifies the nearest points of interest and zones, where the liquidity is concentrated, allowing you to find great entry and exit points for your trades;
ICSM has SCOB (Single Candle Order Block) detection function. ICM is packed with the extremely useful in SMC trading SCOB detetction feature, which allows you find even more solid points of interest;
ICSM has super minimalistic design, which contains only the things you really need. Your chart will not be overloaded with unnecessary information. You will only see clear points of interest, liquidity and price movement.
WHY SHOULD YOU USE IT?
As was said above, ICSM allows you to see the most profitable points and zones of interest, which professional SMC traders consider as one of the best in the market, because they are historically the areas from which the price bounces the most, allowing the smartest traders to get quick an clean profits with low drawdown.
In the ICSM indicator these zones are SCOB and ICM line liquidity grabs. By using these zones of interest to find entry points, you increase the chance to open a trade at the most lucrative price and reduce trading risks.
Considering what was said above, this indicator can help traders reduce drawdown risks and increase potential profits simply by showing the most liquid zones of interest, which are perfect for opening a trading position.
Here are some of the examples of how you leverage ICSM in your trading process:
Example of the short trade:
Price shows overall short trend. Trend liquidity is being formed.
Price grabs liduiqity from three ICM lines in a row and then creates a long SCOB at the end of 3rd liquidity grab.
SCOB, which occured at the end of ICM line, represents much stronger zone of interest than a regular SCOB. In this case it represents a zone, which we will use to find an entry.
The entry for the trade will be SCOB candle's low, stop-loss target should be put above SCOB candle's high. Our take-profit target is trend liquidity. See the screenshot above for better understanding.
▼ Now let's see the long trade example. ▼
Example of the long trade:
Price creates trend liquidity by showing equal highs ( EQH ).
Price grabs liduiqity from four ICM lines in a row and then creates a long SCOB at the end of 4th liquidity grab.
Again: SCOB, which occured at the end of ICM line, represents much stronger zone of interest than a regular SCOB. In this case it represents a zone, which we will use to find an entry.
The entry for the trade will be SCOB candle's high, stop-loss target should be put below SCOB candle's low. Our take-profit target is EQH. See the screenshot above for better understanding.
ALERTS
ICSM provides simple and easy alert customization, allwoing to choose only the alerts you want to receive. You can choose from the following alert options:
ICM — impulse or correction liquidity grab;
SCOB — SCOB is formed, wether or not the liquidity is grabbed from the impulse or correction;
SCOB+ICM — SCOB is formed after grabbing the liquidity of the ICM line;
SCOB+ICM (same candle) — SCOB is formed in the liquidity area of the impulse or correction.
HOW CAN I GET THE MOST OUT OF IT?
ICSM displays only the first liquidity of an impulse or correction, which matches the IDM (Inducement) in the Advanced SMC strategy . This strategy is completely covered in the World Class SMC indicator and is available for free for PDF in three parts.
You can also ICSM with any other strategy, because ICSM is a very flexible indicator and will help anyone improve their trading by making one aware of the high-quality liquidity on the chart.
Let's see how you can leverage ICSM with our World Class SMC indicator and other different strategies:
Example of the long & short trades with World Class SMC.
Long (1-3):
Price reached previous OB-EXT . This is the first sign for the potential price reversal;
ICM+SCOB happened after price reached OB-EXT;
After that, you can need to look for an entry on LTF. If you don't know how to do it, you can refer to our education materials.
Short (4-6):
Price reached OB-IDM , which is also a great sign for a potential upcoming price reversal;
ICM+SCOB occured after liquidity grab of the previous SCOB. This fact does strengthen the probability of the potential upcoming price reversal;
Now you need to switch to LTF and find an entry there.
Example of the short trade with simple Fibonacci retracement strategy.
Price grabs the liquidity of the ICM lines three times in a row, forming SCOB after the 3rd grab;
Price performs correctional move down without testing the SCOB, leaving no entry opportunity by our initial strategy, so we can add another strategy — Fibonacci retracement from 0.618 level — to our analysis in order to find an entry ;
We use Fibonacci grid with our initial strategy to find the best POI, that will align with the trend direction and will eventually become our entry point.
SUMMARY
ICSM is a unique indicator that indentifies zones and points of interests with high-quiality liquidity and can be both a stand-alone tool and can be integrated into any other strategy to increase the efficiency of analysis, accuracy of trading entries and reduce trading risks.
If you want to learn the SMC strategies that our team uses in our products, you can refer to our educational materials.
We hope that you will find a great use of ICSM and it will help you improve your perfomance as a trader. Best of luck, traders!
— with love, WinWorld Team

Fractalyst Moving Average [Adaptive] | FractalystWhat's the indicator purpose and functionality?
Moving averages are widely used technical indicators in trading.
Typically, they provide reliable entry signals in trending markets but can falter during consolidation periods.
Now, imagine a moving average that adjusts to market conditions.
The Fractalyst Moving Average does just that by adapting to the market's noise level, which is the erratic price movement within trends or consolidation phases.
This indicator incorporates market structure into moving averages to more effectively identify potential market trends.
By dynamically calculating moving averages based on external swing highs and lows, it offers robust trend identification and adapts to different market conditions, giving traders valuable insights into current market condition.
------
How does FRMA react in a trending and consolidating market?
When the market trends, the FRMA adjusts quickly to price movements, closely tracking the trend and positioning itself close to prices. This responsiveness allows it to provide timely signals and effectively capture trends.
However, in consolidating markets where there is little net change in price over time, the FRMA reacts slowly. As consolidation prolongs, the FRMA may even cease to move significantly, appearing non-reactive. This characteristic helps minimize false signals and unnecessary trades during periods of market indecision.
Notice how the FRMA tracks prices closely when the market is trending. When the market begins to consolidate, however, the FRMA becomes relatively unresponsive and stays horizontal.
------
What are the underlying calculations behind FRMA?
Identifying Swing Highs and Lows: FRMA begins by identifying the most recent external swing highs and lows, which are key pivot points in the market's price structure.
Defining Market Structure: It calculates the distance between these external swing levels. When price remains confined between these levels, indicating a horizontal market, it signifies minor intermediate ranges or a lack of clear trend direction.
Adapting to Breaks of Structure: When a new break of structure occurs—such as a significant price movement above a previous swing high or below a swing low—the FRMA updates dynamically.
It adjusts its values to reflect the midpoint (50%) of the distance between the external swing highs and lows.
This adjustment helps the FRMA react promptly to changes in different market environments.
------
How to use the FRMA in trading?
In a trend-following context, the FRMA provides clear signals for trading:
Buying Signal: Look to buy when the FRMA is rising. This indicates that the market is in an uptrend, with prices consistently moving higher. Buying at these points aligns with the trend momentum and increases the likelihood of capturing profitable movements.
Selling Signal: Consider selling when the FRMA is falling. A declining FRMA suggests that the market is in a downtrend, where prices are consistently decreasing. Selling during these periods helps capitalize on downward movements and potential profit-taking opportunities.
Avoiding Trades: Avoid trading when the FRMA appears horizontal and the market is consolidating. This indicates a lack of clear trend direction or significant price movement, which can lead to choppy price action and increased risk of false signals. Waiting for the FRMA to resume a clear trend direction can help avoid unnecessary losses in consolidating markets.
Note: These rules are just examples and may generate numerous false signals. Even when the FRMA is less responsive, it can exhibit frequent changes in direction.
Traders should apply additional filters or confirmatory indicators to refine their trading decisions and mitigate the impact of false signals.
Depending on whether they're employing mean-reversion or trend-following trading styles, traders need to adjust other market filters accordingly.
It's crucial to conduct thorough backtesting using various market conditions and filters to validate and optimize their trading strategies effectively.
This process helps traders identify the settings that best align with their trading goals and market conditions.
------
What makes this moving average unique compared to others?
Yes, it's another moving average, but the Fractalyst Adaptive Moving Average stands out for a compelling reason.
Its calculation is more sophisticated, leveraging market structure to identify potential consolidation and trending environments, similar to conventional moving averages such as SMA and EMA.
------
How does the FRMA's stack up against the other moving averages?
Since markets are always evolving, using adaptive strategy elements like the FRMA certainly makes a whole lot of sense.
However, from a practical standpoint, the only way to find out would be to exhaustively backtest the various moving averages across all markets of interest.
Establishing equivalency between the FRMA and other moving averages may be a little challenging, since the FRMA does not use a single integer value for its lookback period.
Assuming the backtests produced roughly equal results, I’d personally prefer to use the FRMA. Its adaptive qualities give me confidence that the strategy can weather changing market conditions.
------
User-inputs and customizations
------
Terms and Conditions | Disclaimer
Our charting tools are provided for informational and educational purposes only and should not be construed as financial, investment, or trading advice. They are not intended to forecast market movements or offer specific recommendations. Users should understand that past performance does not guarantee future results and should not base financial decisions solely on historical data.
Built-in components, features, and functionalities of our charting tools are the intellectual property of @Fractalyst Unauthorized use, reproduction, or distribution of these proprietary elements is prohibited.
By continuing to use our charting tools, the user acknowledges and accepts the Terms and Conditions outlined in this legal disclaimer and agrees to respect our intellectual property rights and comply with all applicable laws and regulations.

20-day High BreakoutOverview:
The 20-day High Breakout Indicator is a very simple yet powerful tool designed for traders seeking to capitalize on significant price movements in the stock market. This indicator identifies potential buy and sell signals based on a stock's 20-day high breakout levels, making it an essential addition to your trading strategy.
Key Features:
Swing Period Input: Customize the swing period to your preferred number of days, with a default of 20 days, allowing flexibility based on your trading style.
Trailing Stop Level: Automatically calculates the trailing stop level based on the highest high and lowest low within the defined swing period, helping to manage risk and lock in profits.
Buy and Sell Signals: Generates clear buy signals when the price crosses above the trailing stop level and sell signals when the price crosses below, enabling timely entries and exits.
Visual Indicators: Plots buy signals as green upward triangles below the bars and sell signals as red downward triangles above the bars, providing easy-to-interpret visual cues directly on the chart.
How It Works:
Resistance and Support Levels: The indicator calculates the highest high (resistance) and lowest low (support) over the defined swing period.
Swing Direction: It determines the market direction by comparing the current closing price to the previous resistance and support levels.
Trailing Stop Calculation: Depending on the market direction, the trailing stop level is set to either the support or resistance level.
Signal Generation: Buy and sell signals are generated based on the crossover of the closing price and the trailing stop level, filtered to ensure only valid signals are displayed.
Visual Representation: The trailing stop level is plotted as a line, and buy/sell signals are marked with respective shapes for easy identification.
Usage:
Trend Following: Ideal for traders looking to follow trends and catch significant breakouts in the stock price.
Risk Management: Helps in managing risk by providing a trailing stop level that adjusts with market movements.
Visual Clarity: The clear visual signals make it easy for traders to interpret and act upon the indicator's signals.
Add the 20-day High Breakout Indicator to your TradingView charts to enhance your trading strategy and gain an edge in identifying profitable trading opportunities.

Bitcoin Logarithmic Regression
This indicator displays logarithmic regression channels for Bitcoin. A logarithmic regression is a function that increases or decreases rapidly at first, but then steadily slows as time moves. The original version of this indicator/model was created as an open source script by a user called Owain but is not available on TradingView anymore. So I decided to update the code to the latest version of pinescript and fine tune some of the parameters.
How to read and use the logarithmic regression:
There are 3 different regression lines or channels visible:
Green Channel: These lines represent different levels of support derived from the logarithmic regression model.
Purpose: The green channel is used to identify potential support levels where the price might find a bottom or bounce back upwards.
Interpretation:
If the price is approaching or touching the lower green lines, it might indicate a buying opportunity or an area where the price is considered undervalued.
------------------------------------------------
Red Channel: These lines represent different levels of resistance derived from the logarithmic regression model.
Purpose: The red channel is used to identify potential resistance levels where the price might encounter selling pressure or face difficulty moving higher.
Interpretation:
If the price is approaching or touching the upper red lines, it might indicate a selling opportunity or an area where the price is considered overvalued.
-------------------------------------------------
Purple Line This line represents to so-called "fair price" of Bitcoin according to the regression model.
Purpose: The purple line can be used to identify if the current price of Bitcoin is under- or overvalued.
Interpretation: A simple interpretation here would be that over time the price will have the tendency to always return to its "fair price", so starting to DCA more when price is under the line and less when it is over the line could be a suitable investment strategy.
----------------------------------------------------
Practical Application:
You can use this regression channel to build your own, long term, trading strategies. Notice how Bitcoin seems to always act in kind of the same 4 year cycle:
- Price likes to trade around the purple line at the time of the halvings
- After the halvings we see an extended sideways range for up to 300 days
- After the sideways range Bitcoin goes into a bull market frenzy (the area between the green and red channel)
- The price tops out at the upper red channel and then enters a prolonged bear market.
Buying around the purple line or lower line of the green channel and selling once the price reaches the red channel can be a suitable and very profitable strategy.
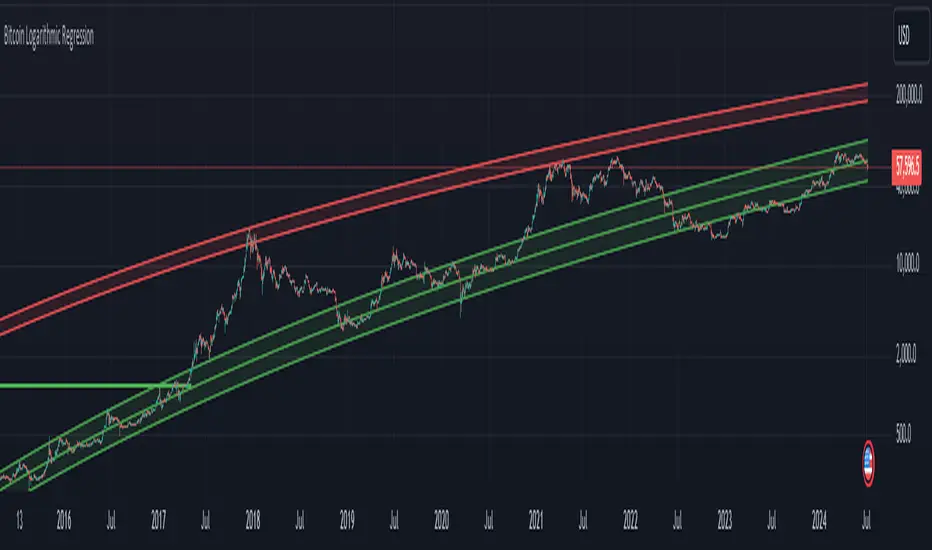
Averaging PriceA calculator that will help to survive in market storms and even to increase your deposit. This script will not help you to find the perfect price to buy, but will allow to buy more and more when the market will go down. But please, don't forget to sell some parts when position will be profitable (or close to that), so you will be able to buy more and more even on a bear market. Please, take a look at the market stress situations to correctly plan your strategy there.
How to use?
1. Define amount to want to gain to position (e.g. $1000), this amount of money you will lose in case of liquidation (for isolation mode) or entire futures deposit in case of cross mode.
2. Configure existing position (price where you entered and amount of coins you already in), if no any - it's even better. Calculator will help with the right amount for a first purchase.
3. Configure futures, closs/isolation margin mode and other things. By default it will use liquidations for isolation margin mode to buy more a slightly above. You can use these levels even for cross mode (buy by calculations for isolation mode, but really have cross configured). If you want to use other levels to buy – please use Concrete Prices field to enter them split by comma, and the script will use it for calculations.
4. A table and lines will help to see more details of how to deal with market. Play around and find a best strategy for you. But please, don't forget to CHECK THE ACCURACY OF CALCULATIONS. This script gives only preliminary number and will never be able to show exact numbers, the REAL LIQUIDATIONS MAY BE MUCH HIGHER then it shows!!!
P.S. I, as an author, do not have any responsibility on your possible losses due to following these ideas. I am using it just like idea and recheck every number. There might be any issues, and you will pay for it with your own money. So please, be mindful while using it.
Hope it will help to make your trading better and way more comfort.
Take care and good luck!
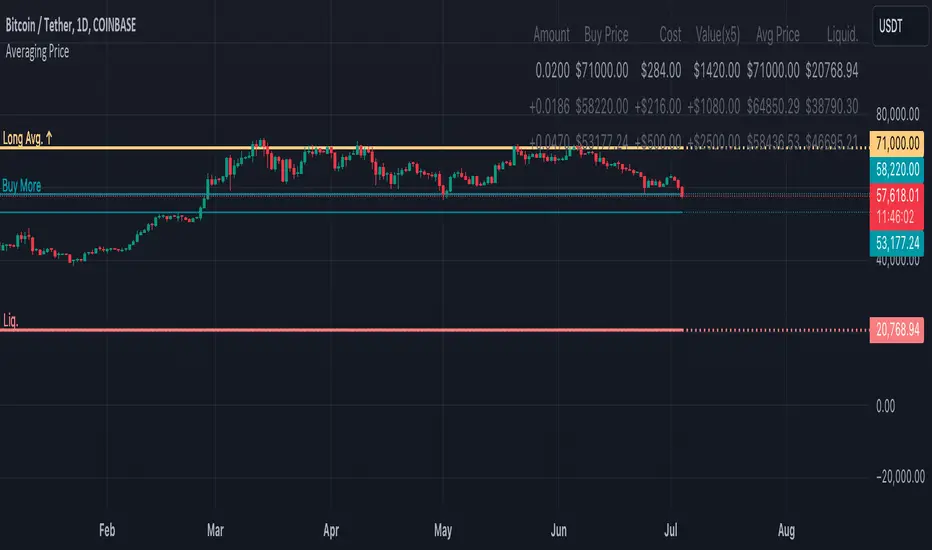
Symbols Correlation, built for pair tradingOverview:
This script is designed for pairs trading. If you are not familiar with pairs trading, I suggest learning about it, as it can be a profitable strategy in neutral markets (or neutral trends between two assets). The correlation between two assets is the foundation of pairs trading, and without it, the chances of making a profit are low.
Correlation can be described in two opposite ways:
1: Absolute positive correlation (meaning the asset prices move together).
-1: Absolute negative correlation (meaning the asset prices move in opposite directions).
Any value between 1 and -1 indicates some degree of correlation, but generally, values higher than 0.7 or lower than -0.7 are considered significant.
Features:
Typically, correlation is measured using the closing prices. This script adds three more correlation studies based on open, high, and low prices. By using all four lines, we can get a better understanding of the pair's correlation.
How to Read This Indicator:
To use this indicator effectively, you need to input your pair as a ratio. For example, if your pair is TSN and ZBH, enter it in the symbol search as: TSN/ZBH
Gray Area : This area indicates "no high correlation" (default is between -0.8 and 0.8, adjustable in the settings).
Gray Line : This represents the close correlation within the "no high correlation" range.
Green Line : This represents the close correlation within the "high correlation" range.
Dot Lines : These represent the open, high, and low correlations.
Example Interpretations:
A : All four lines are close together & the line is green – very good correlation!
B : The line is gray, and the dot lines are apart – not a strong correlation.
C : When the close correlation remains green for a long time, it signals a strong correlation.
Application in Pairs Trading:
In pairs trading, aim for the highest possible correlation, and it is important to have a sustained correlation over a long period. Pairs that correlate only part of the year but not consistently are less reliable for pairs trading.
This is an example for good correlation for pairs trading:
This is an example for bad correlation for pairs trading:
Here is a view of my full indicators when doing pairs trading:

TrendFireOverview
They say "Trend is your Friend". In my short trading timeline, I've realized the difficult part is making this friendship to happen. Although, not impossible.
Trend Fire is one of the trend following strategy amongst many strategies out there. But the unique part of Trend Fire lies in the implementation and its accuracy to identify healthy Trends. Trend Fire is a purely Mathematical Indicator and aims for generating more successful trade signals. It has a unique strategy to avoid sideways market, false signals, and calculation to find entry for Trends, hence, more quality of trades.
I started my trading journey by observing the market movement for a long time as a beginner trader. Over time, I've realized that profit maximization can happen only if I can properly identify long trend. The reason why I was fascinated with trend following strategies and keen to solve the problems that trend following has.
Approach
In most typical trend following strategy setup, Trend identification starts by using fast and long period moving average crossovers. The fact that, moving averages are lagging in nature, it fails to identify good trends and produce many false signals. Although, it generates signals for trend also along with the false signals.
My aim was to reduce the false signals that occurs during consolidation and gain more accuracy on detecting healthy trends. The reason why I've obtained several approaches -
1. Moving Average Gap - during a consolidation period where lots of false signal generates in a crossover system, we can see that the distance/gap between the moving averages is very small, and in long trend the distance is large. So, a simple implementation was to limit the distance/gap by using a threshold to generate signals for trend outside the false signal threshold. This way, signals for long trend generates a few candles away but reduces false signal generation. For this Gap to work, a gap threshold of 20 works great to identify large trends and it is also a good entry point.
3. Volatility Adaptive moving average - As, this system is based on calculating distance/gap between MA's, the distance also doesn't always indicate proper momentum during a trend. The reason behind is that, 200 Moving average is also moving along the price during a trend and the distance/gap between moving averages vary according to the price. This also leads to generate false signals. So, it is more appropriate to replace 200 moving average with volatility adaptive moving average with a period of 1000, because adaptive moving average always reacts to the price and creates a larger distance/gap with price when there’s a trend in the market. Otherwise, it moves close with price in a sideways market. This nature of adaptability helps to reduce more false signals and gain more chances to take profitable trends.
This is also should be considered that no indicator system alone in trading is purely accurate. So, Trend Fire also is not an exception. There will be false signals, but the probability of getting false signal is less than the overall profits compared to any other moving average crossover system. The idea here is, maximizing your equity gradually over time rather than in a day and trade only when market is tradeable. Exactly how trading should be.
Usage
The usage of the indicator is simple. Once the indicator is applied in the mentioned currency pairs, it will show Buy/Sell signals along with Exit points in the chart.
The yellow line is the volatility adaptive moving average line which create distance during a trend and moves close to price when there is no trend. It is also used for trade exit indication, where the line meets with the price at the end of the trend and shows total pips gains/loss in a popup.
As, the indicator have built in adaptive and ATR base stop loss system, a good approach is to enable this in settings. So that, the loss will be minimum. The reason behind, by default the trades closed when a certain trend is over (When yellow line reaches close to the price after a gap) and this closing point not necessarily closes above/below signal. This is why Adaptive and ATR stop loss together make sure when trend reverses during a trend to take profit. Although, settings for Stop loss have been configured in the indicator, but if needed, settings can be changed for optimized results. It is also advisable to not to trade during a news alert as there are chances to generate false signal for high movement of the market.
Down-Sides
The indicator is dependent on the 1-minute time frame, larger time frames resulting in a signal overfitting condition. The indicator is set for only some selective currencies and commodities. So, its behavior might also change if the currency pair is out of scope. Below is the list of currencies which will work for now.
• EURUSD – FXCM
• GBPUSD – FXCM
• AUDUSD – OANDA
• USDCAD – OANDA
• GBPCAD – FXCM
• USDJPY – FXCM
• GBPJPY – OANDA
• EURJPY – OANDA
• CADJPY – FXCM
• AUDJPY – OANDA
• CHFJPY – OANDA
• EURAUD – FXCM
• GBPAUD – FXCM
• AUDCAD – OANDA
• EURGBP – FXCM
• EURCAD – OANDA
• XAUUSD – OANDA
• XAGUSD – OANDA
• USOIL – TVC
• BTCUSDT.P – BYBIT
More currency pair will be added in the future.
Settings
• Fast MA : Fast Moving Average
• Trend MA : Trend line Ema for determining Exit point
• Trend Threshold : Gap threshold between VAMA and Fast EMA
• VAMA : Volatility Adaptive Moving Average Length for calculation
• Enable Trend Coloring : Enable trend coloring on adaptive moving average line
• Enable Trailing Stop : Enable Adaptive and ATR trailing stop to exit trades
• Show Dashboard : Enable Trend and Signal value dashboard
• Position : Position of Dashboard in Chart
Alerts
Alert conditions are set for trade Entry and Exit scopes only and it does not mention Buy/Sell trade specifically in alerts for now. For that, you need to follow the chart after an alert as indicator shows Buy/Sell/Exit on chart. To create an alert based on the indicator follow these steps:
Go to the alert section (the alarm clock) -> create new alert -> select TrendFire in condition -> Below select TRADE ALERT and select date duration. In option select “once per bar close”, By default the message is set with ticker ID. Change the message if you want a personalized message.
Conclusion
As a programmer and problem solver, I have invested over a year to understand the market and tried to solve the problem that I faced as a trader. I wanted to develop an indicator that make sense and works logically in market. Also, the aim is to trade smartly with a strategy rather than biting in the bush randomly. Trade Fire is a result of countless failures and losses. I hope future contributions will grow this indicator to be more efficient down the line.
Thanks for reading…Happy Trading!
ICT KillZones + Pivot Points [TradingFinder] Support/Resistance 🟣 Introduction
Pivot Points are critical levels on a price chart where trading activity is notably high. These points are derived from the prior day's price data and serve as key reference markers for traders' decision-making processes.
Types of Pivot Points :
Floor
Woodie
Camarilla
Fibonacci
🔵 Floor Pivot Points
Widely utilized in technical analysis, floor pivot points are essential in identifying support and resistance levels. The central pivot point (PP) acts as the primary level, suggesting the trend's likely direction.
The additional resistance levels (R1, R2, R3) and support levels (S1, S2, S3) offer further insight into potential trend reversals or continuations.
🔵 Camarilla Pivot Points
Featuring eight distinct levels, Camarilla pivot points closely correspond with support and resistance, making them highly effective for setting stop-loss orders and profit targets.
🔵 Woodie Pivot Points
Similar to floor pivot points, Woodie pivot points differ by placing greater emphasis on the closing price, often resulting in different pivot levels compared to the floor method.
🔵 Fibonacci Pivot Points
Fibonacci pivot points combine the standard floor pivot points with Fibonacci retracement levels applied to the previous trading period's range. Common retracement levels used are 38.2%, 61.8%, and 100%.
🟣 Sessions
Financial markets are divided into specific time segments, known as sessions, each with unique characteristics and activity levels. These sessions are active at different times throughout the day.
The primary sessions in financial markets include :
Asian Session
European Session
New York Session
The timing of these major sessions in UTC is as follows :
Asian Session: 23:00 to 06:00
European Session: 07:00 to 14:25
New York Session: 14:30 to 22:55
🟣 Kill Zones
Kill zones are periods within a session marked by heightened trading activity. During these times, trading volume surges and price movements become more pronounced.
The timing of the major kill zones in UTC is :
Asian Kill Zone: 23:00 to 03:55
European Kill Zone: 07:00 to 09:55
New York Kill Zone: 14:30 to 16:55
Combining kill zones and pivot points in financial market analysis provides several advantages :
Enhanced Market Sentiment Analysis : Aligns key price levels with high-activity periods for a clearer market sentiment.
Improved Timing for Trade Entries and Exits : Helps better time trades based on when price movements are most likely.
Higher Probability of Successful Trades : Increases the accuracy of predicting market movements and placing profitable trades.
Strategic Stop-Loss and Profit Target Placement : Allows for precise risk management by strategically setting stop-loss and profit targets.
Versatility Across Different Time Frames : Effective in both short and long time frames, suitable for various trading strategies.
Enhanced Trend Identification and Confirmation : Confirms trends using both pivot levels and high-activity periods, ensuring stronger trend validation.
In essence, this integrated approach enhances decision-making, optimizes trading performance, and improves risk management.
🟣 How to Use
🔵 Two Approaches to Trading Pivot Points
There are two main strategies for trading pivot points: utilizing "pivot point breakouts" and "price reversals."
🔵 Pivot Point Breakout
When the price breaks through pivot lines, it signals a shift in market sentiment to the trader. In the case of an upward breakout, where the price crosses these pivot lines, a trader might enter a long position, placing their stop-loss just below the pivot point (P).
Conversely, if the price breaks downward, a short position can be initiated below the pivot point. When using the pivot point breakout strategy, the first and second support levels can serve as profit targets in an upward trend. In a downward trend, these roles are filled by the first and second resistance levels.
🔵 Price Reversal
An alternative method involves waiting for the price to reverse at the support and resistance levels. To implement this strategy, traders should take positions opposite to the prevailing trend as the price rebounds from the pivot point.
While this tool is commonly used in higher time frames, it tends to produce better results in shorter time frames, such as 1-hour, 30-minute, and 15-minute intervals.
Three Strategies for Trading the Kill Zone
There are three principal strategies for trading within the kill zone :
Kill Zone Hunt
Breakout and Pullback to Kill Zone
Trading in the Trend of the Kill Zone
🔵 Kill Zone Hunt
This strategy involves waiting until the kill zone concludes and its high and low lines are established. If the price reaches one of these lines within the same session and is strongly rejected, a trade can be executed.
🔵 Breakout and Pullback to Kill Zone
In this approach, once the kill zone ends and its high and low lines stabilize, a trade can be made if the price breaks one of these lines decisively within the same session and then pulls back to that level.
🔵 Trading in the Trend of the Kill Zone
Kill zones are characterized by high trading volumes and strong trends. Therefore, trades can be placed in the direction of the prevailing trend. For instance, if an upward trend dominates this area, a buy trade can be entered when the price reaches a demand order block.

Ultimate UT Bot ScreenerWhat Does the Ultimate UT Bot Screener Do?
Ultimate UT Bot Screener will help you navigate UT Bot signals and backtest results for up to 40 instruments simultaneously. It scans the market for provided UT Bot indicator parameters, calculates essential metrics, and displays the information in 1 fully customizable table.
How Does It Work?
Market Scanning : The screener scans multiple instruments for the selected timeframe, ensuring you never miss an opportunity.
Customizable Parameters : Adjust the UT Bot parameters to fit your unique trading style and risk tolerance.
Filtering and Sorting : Use advanced filtering and sorting options to narrow down the results based on your specific criteria.
Alerts and Notifications : Set up custom alerts to stay updated on important market movements and potential trades.
Visual Customization : Tailor the screener's visual appearance to suit your preferences, making data interpretation effortless.
Currently, Ultimate UT Bot Screener Supports 13 columns:
Price - the last price of the instrument
UT Signal - last UT bot signal. Value in the square brackets ( for ex.) means how many bars ago the last signal fired.
Move To Revert —We have to observe the price move for the current bar to see the UT Bot signal change.
Revert Prob - probability estimation for UT Bot to revert for the current bar.
Trade History - the last five trade outcomes are coded as green(profit)/red(loss) squares.
Total Trades - total trades number for UT Bot strategy for the entire available history.
Current P&L - P&L for the open trade
Trade Avg P&L - Average P&L for the last X trades
Trade Prof - percent profitable trades from the last X trades
Profit Factor - profit factor the last X trades
Net Profit - total net Profit for the last X trades
Max DD - maximum drawdown for the last X trades Avg Bars in Trades - average trade duration for the last X trades
How to Use the Ultimate UT Bot Screener
Using the Ultimate UT Bot Screener is straightforward:
Set Up Your Screener : Choose the instruments you want to monitor and configure the columns to display the data most relevant to you.
Customize Parameters : Fine-tune the UT Bot parameters to align with your trading strategy. Filter and Sort: Apply filters to isolate the most promising trading opportunities and sort the results based on your priorities.
Monitor and Act: Keep an eye on the screener and act on the high-probability signals it generates. Set up alerts to ensure you never miss a critical trade.
Why Is the Ultimate UT Bot Screener Original and Worth Paying For?
Highly Customizable : our tool allows you to configure almost every element, from the set of columns and instruments to the UT Bot parameters and visual appearance.
User-Friendly Interface : Designed with traders in mind, the screener offers an intuitive interface that makes complex data easy to understand and act upon.
Time-Saving : By automating the market scanning and analysis process, it saves you valuable time and effort, allowing you to focus on executing your trades.
Real-Time Alerts : Stay ahead of the market with customizable alerts that notify you of important events and potential trades.
Disclaimer : Please remember that past performance may not be indicative of future results. Due to various factors, including changing market conditions, the strategy may no longer perform as well as in historical backtesting. This post and the script don't provide any financial advice.
