Uptrick: Trend Confirmation IndicatorIf you buy this indicator/strategy the code will be provided so in order to access it you will need to go to Tradingview and at the bottom click 'Pine Editor'. Then click 'Open' and then click on 'New strategy'. Here you can then paste the code and save it. Make sure to first delete all the code that there is before pasting it inside.
Description:
The "Uptrick: Trend Confirmation Indicator" stands as an exceptional tool for traders seeking reliable confirmation of market trends. This indicator integrates multiple technical analysis components to provide clear signals for trend direction, aiding traders in making well-informed trading decisions with confidence.
EMA and MACD Analysis:
The indicator leverages the Exponential Moving Average (EMA) to capture the long-term trend direction of the market. The EMA is calculated over a customizable period, allowing traders to adapt the indicator to various timeframes and market conditions.
Additionally, the Moving Average Convergence Divergence (MACD) is employed to further confirm trend direction. By analyzing the difference between two moving averages and their smoothing, the MACD component helps identify potential shifts in market momentum.
Trend Confirmation Mechanism:
The indicator confirms a trend when the closing price is above the EMA, and the MACD line shows a positive change, indicating upward momentum. This combined signal enhances the reliability of trend confirmation, reducing false signals and noise in the market.
To filter out short-term fluctuations, the indicator requires trend confirmation over multiple bars, ensuring a more robust assessment of market direction.
Background Color and Visualization:
The background color dynamically adjusts based on the direction of the EMA, providing visual cues for trend directionality. A green background signifies an upward trend, while a red background indicates a downward trend.
This visual representation enhances the clarity of trend identification, allowing traders to quickly assess market conditions at a glance.
Signal Generation and Execution:
The indicator generates long signals when the EMA crosses above its previous value, indicating a potential bullish reversal. Conversely, short signals are generated when the EMA crosses below its previous value, signaling a potential bearish reversal.
These signals are executed through automated buy and sell orders, streamlining the trading process and minimizing human error.
Utility and Potential Usage:
The "Uptrick: Trend Confirmation Indicator" is an indispensable tool for traders across various experience levels, offering clear and reliable signals for trend confirmation.
Short-term traders can benefit from its ability to filter out noise and provide accurate trend signals, enhancing their intraday trading strategies.
Long-term investors can leverage its robust trend confirmation mechanism to identify favorable entry and exit points, optimizing their portfolio management and risk mitigation strategies.
In conclusion, the "Uptrick: Trend Confirmation Indicator" stands out as an excellent trading tool, empowering traders with the confidence to navigate the markets effectively and capitalize on profitable opportunities with precision and clarity.
Cerca negli script per "profitable"

[InvestorUnknown] Performance MetricsOverview
The Performance Metrics indicator is a tool designed to help traders and investors understand and utilize key performance metrics in their strategies. This indicator is inspired by the Rolling Risk-Adjusted Performance Ratios created by @EliCobra, but it offers enhanced usability and additional features to provide a more user-friendly code for understanding the calculations.
Features
Rolling Lookback:
Dynamic Lookback Calculation: The indicator automatically calculates the number of bars from the start of the asset's price history, up to a maximum of 5000 bars due to TradingView platform restrictions.
Adjustable Lookback Period: Users can manually set a lookback period or choose to use the rolling lookback feature for dynamic calculations.
RollingLookback() =>
x = bar_index + 1
y = x > 4999 ? 5000 : x > 1 ? (x - 1) : x
y
Trend Analysis
The Trend Analysis section in this indicator helps traders identify the direction of the market trend based on the balance of positive and negative returns over time. This is achieved by calculating the sums of positive and negative returns and optionally smoothing these values to provide a clearer trend signal.
Configuration: Enable smoothing if you want to reduce noise in the trend analysis. Choose between EMA and SMA for smoothing. Set the length for smoothing according to your preference for sensitivity (shorter lengths are more sensitive to changes, longer lengths provide smoother signals).
Interpretation:
- A positive trend difference (filled with green) indicates a bullish trend, suggesting more positive returns.
- A negative trend difference (filled with red) indicates a bearish trend, suggesting more negative returns.
- Colored bars provide a quick visual cue on the trend direction, helping to make timely trading decisions.
// The Trend Analysis section calculates and optionally smooths the sums of positive and negative returns.
// This helps identify the trend direction based on the balance of positive and negative returns over time.
Ps = Smooth ? Smooth_type == "EMA" ? ta.ema(pos_sum, Smooth_len) : ta.sma(pos_sum, Smooth_len) : pos_sum
Ns = Smooth ? Smooth_type == "EMA" ? ta.ema(neg_sum, Smooth_len) : ta.sma(neg_sum, Smooth_len) : neg_sum
// Calculate the difference between smoothed positive and negative sums
dif = Ps + Ns
Performance Metrics Table
Visual Table Display: Option to display a table on the chart with calculated performance metrics. This table includes comprehensive metrics like Mean Return, Positive and Negative Mean Return, Standard Deviation, Sharpe Ratio, Sortino Ratio, and Omega Ratio.
Performance Metrics Calculated
Mean Return:
Description: The average return over the lookback period.
Purpose: Helps in understanding the overall performance of the asset by providing a simple average of returns.
Positive Mean Return:
Description: The average of all positive returns over the lookback period.
Purpose: Highlights the average gain during profitable periods, giving insight into the asset's potential upside.
Negative Mean Return:
Description: The average of all negative returns over the lookback period.
Purpose: Focuses on the average loss during unprofitable periods, helping to assess the downside risk.
Standard Deviation (STDEV):
Description: A measure of volatility that calculates the dispersion of returns from the mean.
Purpose: Indicates the risk associated with the asset. Higher standard deviation means higher volatility and risk.
Sharpe Ratio:
Description: A risk-adjusted return metric that divides the mean return by the standard deviation of returns. It can be annualized if selected.
Purpose: Provides a standardized way to compare the performance of different assets by considering both return and risk. A higher Sharpe Ratio indicates better risk-adjusted performance.
sharpe_ratio = mean_all / stddev_all * (Annualize ? math.sqrt(Lookback) : 1)
Sortino Ratio:
Description: Similar to the Sharpe Ratio but focuses only on downside volatility. It divides the mean return by the standard deviation of negative returns. It can be annualized if selected.
Purpose: Offers a better assessment of downside risk by ignoring upside volatility. A higher Sortino Ratio indicates a higher return per unit of downside risk.
sortino_ratio = mean_all / stddev_neg * (Annualize ? math.sqrt(Lookback) : 1)
Omega Ratio:
Description: The ratio of the probability-weighted average of positive returns to the probability-weighted average of negative returns.
Purpose: Measures the overall likelihood of positive returns compared to negative returns. An Omega Ratio greater than 1 indicates more frequent and/or larger positive returns compared to negative returns.
omega_ratio = (prob_pos * mean_pos) / (prob_neg * -mean_neg)
By calculating and displaying these metrics, the indicator provides a comprehensive view of the asset's performance, enabling traders and investors to make informed decisions based on both returns and risk-adjusted metrics.
Use Cases:
Performance Evaluation: Assesses an asset's performance by analyzing both returns and risk factors, giving a clear picture of profitability and volatility.
Risk Comparison: Compares the risk-adjusted returns of different assets or portfolios, aiding in identifying investments with superior risk-reward trade-offs.
Risk Management: Helps manage risk exposure by evaluating downside risks and overall volatility, enabling more informed and strategic investment decisions.

Luxmi AI Ultimate 1 Min Option ScalperThe Luxmi AI Ultimate 1 Min Option Scalper is a specialized trading indicator designed for use in options trading. This tool is particularly focused on providing actionable signals to option buyers within a one-minute timeframe, making it highly suitable for scalping—a trading strategy aimed at profiting from small price changes. Below is an elaboration on how this indicator functions and its significance in trading decisions:
### Key Features of Luxmi AI Ultimate 1 Min Option Scalper
1. **Enter and Don't Signals:**
- **Enter Signals:** These signals indicate the optimal moments to enter a trade, suggesting when to buy an option. They are typically based on sophisticated algorithms that analyze price movements, volume, volatility, and other relevant market data.
- **Don't Signals:** These signals advise traders to refrain from entering a trade. This could be due to market conditions that are not conducive to profitable trading, such as high volatility, low liquidity, or unclear directional trends.
2. **Directional Trading Strategy:**
- The Luxmi AI Ultimate 1 Min Option Scalper focuses on directional trading, which involves making trades based on the expected direction of the market. For option buyers, this means taking positions that profit from upward (call options) or downward (put options) movements in the price of the underlying asset.
3. **Scalping Approach:**
- Scalping is a short-term trading strategy that involves making numerous trades over the course of a trading session, aiming to capitalize on small price changes. The one-minute timeframe is particularly suited for scalping, as it allows traders to quickly enter and exit positions to capture minimal but frequent profits.
### Functionality and Benefits
1. **Real-Time Analysis:**
- The indicator provides real-time analysis and signals, ensuring that traders receive timely information to make quick trading decisions. This is crucial in the fast-paced environment of scalping, where delays can significantly impact profitability.
2. **Automated Decision-Making Support:**
- By automating the signal generation process, the Luxmi AI Ultimate 1 Min Option Scalper helps reduce the cognitive load on traders. This automation can lead to more consistent trading performance, as it mitigates the impact of emotional and psychological factors that often influence human decision-making.
3. **Market Adaptability:**
- The indicator is designed to adapt to changing market conditions, adjusting its signals based on the latest data. This adaptability enhances its effectiveness in various market environments, whether trending, ranging, or highly volatile.
4. **Risk Management:**
- Incorporating "Don't" signals as part of the strategy helps traders avoid entering trades in unfavorable conditions, thereby managing risk more effectively. This feature is particularly valuable in preventing losses and preserving capital.
5. **Educational Value:**
- For less experienced traders, using the Luxmi AI Ultimate 1 Min Option Scalper can provide a learning experience. By observing the signals and their outcomes, traders can develop a better understanding of market dynamics and refine their trading strategies.
### Practical Application
- **Setup:** Traders integrate the Luxmi AI Ultimate 1 Min Option Scalper into their trading platforms. This setup typically involves installing the indicator and configuring it to monitor the specific options and market data relevant to the trader's strategy.
- **Monitoring:** During trading hours, traders monitor the signals provided by the indicator. They prepare to act quickly on "Enter" signals and heed "Don't" signals to avoid unnecessary risks.
- **Execution:** When an "Enter" signal is generated, traders execute the recommended trade, buying the corresponding option. They then manage their positions closely, ready to exit based on their predetermined profit targets or stop-loss levels.
In summary, the Luxmi AI Ultimate 1 Min Option Scalper is a powerful tool for option buyers, providing critical buy and hold signals in a highly time-sensitive manner. Its primary benefits include enhancing decision-making speed, improving trading consistency, and managing risk, all of which are essential for successful scalping in options trading.

Vwap Z-Score with Signals [UAlgo]The "VWAP Z-Score with Signals " is a technical analysis tool designed to help traders identify potential buy and sell signals based on the Volume Weighted Average Price (VWAP) and its Z-Score. This indicator calculates the VWAP Z-Score to show how far the current price deviates from the VWAP in terms of standard deviations. It highlights overbought and oversold conditions with visual signals, aiding in the identification of potential market reversals. The tool is customizable, allowing users to adjust parameters for their specific trading needs.
🔶 Features
VWAP Z-Score Calculation: Measures the deviation of the current price from the VWAP using standard deviations.
Customizable Parameters: Allows users to set the length of the VWAP Z-Score calculation and define thresholds for overbought and oversold levels.
Reversal Signals: Provides visual signals when the Z-Score crosses the specified thresholds, indicating potential buy or sell opportunities.
🔶 Usage
Extreme Z-Score values (both positive and negative) highlight significant deviations from the VWAP, useful for identifying potential reversal points.
The indicator provides visual signals when the Z-Score crosses predefined thresholds:
A buy signal (🔼) appears when the Z-Score crosses above the lower threshold, suggesting the price may be oversold and a potential upward reversal.
A sell signal (🔽) appears when the Z-Score crosses below the upper threshold, suggesting the price may be overbought and a potential downward reversal.
These signals can help you identify potential entry and exit points in your trading strategy.
🔶 Disclaimer
The "VWAP Z-Score with Signals " indicator is designed for educational purposes and to assist traders in their technical analysis. It does not guarantee profitable trades and should not be considered as financial advice.
Users should conduct their own research and use this indicator in conjunction with other tools and strategies.
Trading involves significant risk, and it is possible to lose more than your initial investment.

Buffett Quality Score [Communication Services]Buffett Quality Score "Communication Services": Analyzing Communication Companies with Precision
The communication services sector encompasses a diverse range of companies involved in telecommunications, media, and entertainment. To assess the financial strength and performance of companies within this sector, the Buffett Quality Score employs a tailored set of financial metrics. This scoring system, inspired by the Piotroski F-Score methodology, assigns points based on specific financial criteria to provide a comprehensive quality assessment.
Scoring Methodology
The Buffett Quality Score is designed to evaluate the overall financial health and quality of companies operating within the communication services sector. Each selected financial metric is chosen for its relevance and importance in evaluating a company's performance and potential for sustainable growth. The score is computed by assigning points based on the achievement of specific thresholds for each indicator, with the total points determining the final score. This methodology ensures a nuanced analysis that captures the unique dynamics of the communication services industry.
Selected Financial Metrics and Criteria
1. Return on Invested Capital (ROIC) > 10.0%
Relevance: ROIC measures a company's efficiency in allocating capital to profitable investments. For communication companies, a ROIC above 10.0% indicates effective capital utilization, crucial for sustaining growth and innovation.
2. Return on Equity (ROE) > 15.0%
Relevance: ROE evaluates the return generated on shareholders' equity. A ROE exceeding 15.0% signifies robust profitability and effective management of shareholder funds, essential for investor confidence in communication companies.
3. Revenue One-Year Growth > 10.0%
Relevance: High revenue growth indicates strong market demand and successful business strategies. For communication services, where innovation and content delivery are paramount, growth exceeding 10.0% reflects market leadership and competitive positioning.
4. Gross Margin > 40.0%
Relevance: Gross margin measures profitability after accounting for production costs. In the communication services sector, a gross margin above 40.0% demonstrates efficient operations and high-value content offerings, critical for maintaining competitive advantage.
5. Net Margin > 10.0%
Relevance: Net margin assesses overall profitability after all expenses. A net margin exceeding 10.0% indicates effective cost management and operational efficiency, fundamental for sustained profitability in communication companies.
6. EPS One-Year Growth > 10.0%
Relevance: EPS growth reflects the company's ability to increase earnings per share. For communication firms, where content monetization and subscription models are prevalent, EPS growth above 10.0% signals successful business expansion and value creation.
7. Piotroski F-Score > 6.0
Relevance: The Piotroski F-Score evaluates fundamental strength across various financial metrics. A score above 6.0 suggests strong financial health and operational efficiency, crucial for navigating competitive pressures in the communication services industry.
8. Price/Earnings Ratio (Forward) < 25.0
Relevance: The forward P/E ratio compares current share price to expected future earnings. A ratio below 25.0 indicates reasonable valuation relative to growth prospects, important for investors seeking value opportunities in communication stocks.
9. Current Ratio > 1.5
Relevance: The current ratio assesses short-term liquidity by comparing current assets to current liabilities. In communication companies, a ratio above 1.5 ensures financial flexibility and the ability to meet short-term obligations, vital for operational stability.
10. Debt to Equity Ratio < 1.0
Relevance: A lower debt to equity ratio indicates prudent financial management and reduced reliance on debt financing. For communication firms, maintaining a ratio below 1.0 signifies a healthy balance sheet and lower financial risk.
Interpreting the Buffett Quality Score
0-4 Points: Indicates potential weaknesses across multiple financial areas, suggesting higher risk.
5 Points: Represents average performance, warranting further analysis to understand underlying factors.
6-10 Points: Reflects strong financial health and quality, positioning the company favorably within the competitive communication services industry.
Conclusion
The Buffett Quality Score provides a robust framework for evaluating communication companies, emphasizing critical financial indicators tailored to industry dynamics. By leveraging these insights, investors and analysts can make informed decisions, identifying companies poised for sustainable growth and performance in the ever-evolving communication services landscape.
Disclaimer: The Buffett Quality Score serves as a tool for financial analysis and should not replace professional advice or comprehensive due diligence. Investors should conduct thorough research and consult with financial experts based on individual investment objectives.

Buffett Quality Score [Information Technology]Buffett Quality Score 'Information Technology': Assessing Tech Companies with Precision
The information technology sector is characterized by rapid innovation, high growth potential, and significant competition. To evaluate the financial health and performance of companies within this dynamic industry, the Buffett Quality Score employs a tailored set of financial metrics. This scoring system, inspired by the Piotroski F-Score methodology, assigns points based on specific financial criteria to provide a comprehensive quality assessment.
Scoring Methodology
The Buffett Quality Score is designed to assess the overall financial strength and quality of companies within the tech sector. Each selected financial metric is chosen for its relevance and importance in evaluating a company's performance and potential for sustainable growth. The score is computed by assigning points based on the achievement of specific thresholds for each indicator, with the total points determining the final score. This methodology ensures a nuanced analysis that captures the unique dynamics of the information technology industry.
Selected Financial Metrics and Criteria
1. Return on Invested Capital (ROIC) > 10.0%
Relevance: ROIC measures a company's efficiency in allocating capital to profitable investments. For tech companies, a ROIC above 10.0% indicates effective use of investment capital to generate strong returns, crucial for sustaining innovation and growth.
2. Return on Assets (ROA) > 5.0%
Relevance: ROA assesses how efficiently a company utilizes its assets to generate earnings. A ROA above 5.0% signifies that the company is effectively leveraging its assets, which is vital in the capital-intensive tech sector.
3. Revenue One-Year Growth > 10.0%
Relevance: High revenue growth indicates robust market demand and successful product or service offerings. For tech companies, where rapid scalability is common, growth exceeding 10.0% demonstrates significant market traction and expansion potential.
4. Gross Margin > 40.0%
Relevance: Gross margin reflects the proportion of revenue remaining after accounting for the cost of goods sold. In the tech sector, a gross margin above 40.0% indicates efficient production and high-value offerings, essential for maintaining competitive advantage.
5. Net Margin > 15.0%
Relevance: Net margin measures overall profitability after all expenses. A net margin above 15.0% demonstrates strong financial health and the ability to convert revenue into profit, highlighting the company's operational efficiency.
6. EPS One-Year Growth > 10.0%
Relevance: Earnings per share (EPS) growth indicates the company's ability to increase profitability per share. For tech firms, EPS growth above 10.0% signals positive earnings momentum, reflecting successful business strategies and market adoption.
7. Piotroski F-Score > 6.0
Relevance: The Piotroski F-Score assesses fundamental strength, including profitability, leverage, liquidity, and operational efficiency. A score above 6.0 suggests solid financial fundamentals and resilience in the competitive tech landscape.
8. Price/Earnings Ratio (Forward) < 25.0
Relevance: The forward P/E ratio compares current share price to expected future earnings. A ratio below 25.0 indicates reasonable valuation relative to growth expectations, important for identifying undervalued opportunities in the fast-paced tech sector.
9. Current Ratio > 1.5
Relevance: The current ratio evaluates short-term liquidity by comparing current assets to current liabilities. In the tech industry, a ratio above 1.5 ensures the company can meet its short-term obligations, essential for operational stability.
10. Debt to Equity Ratio < 1.0
Relevance: A lower debt to equity ratio signifies prudent financial management and reduced reliance on debt. For tech companies, which often require significant investment in R&D, a ratio below 1.0 highlights a strong financial structure.
Interpreting the Buffett Quality Score
0-4 Points: Indicates potential weaknesses across multiple financial areas, suggesting higher risk.
5 Points: Represents average performance, warranting further analysis to understand underlying factors.
6-10 Points: Reflects strong financial health and quality, positioning the company favorably within the competitive tech industry.
Conclusion
The Buffett Quality Score provides a strategic framework for evaluating tech companies, emphasizing critical financial indicators tailored to industry dynamics. By leveraging these insights, investors and analysts can make informed decisions, identifying companies poised for sustainable growth and performance in the ever-evolving tech landscape.
Disclaimer: The Buffett Quality Score serves as a tool for financial analysis and should not replace professional advice or comprehensive due diligence. Investors should conduct thorough research and consult with financial experts based on individual investment objectives.

Buffett Quality Score [Consumer Discretionary]Evaluating Consumer Discretionary Companies with the Buffett Quality Score
The consumer discretionary sector, characterized by its sensitivity to economic cycles and consumer spending patterns, demands a robust framework for financial evaluation. The Buffett Quality Score offers a comprehensive assessment of financial health and performance specifically tailored to this dynamic industry. This scoring system combines critical financial ratios uniquely relevant to consumer discretionary companies, providing investors and analysts with a reliable tool for evaluation.
Selected Financial Metrics and Criteria
1. Altman Z-Score > 2.0
Relevance: The Altman Z-Score assesses bankruptcy risk, combining profitability, leverage, liquidity, solvency, and activity ratios. For consumer discretionary companies, which often face volatile market conditions, a score above 2.0 indicates financial stability and the ability to withstand economic downturns. This metric is particularly important in this sector due to the high variability in consumer spending.
2. Piotroski F-Score > 6.0
Relevance: The Piotroski F-Score evaluates fundamental strength based on profitability, leverage, liquidity, and operating efficiency. In the consumer discretionary sector, where rapid changes in consumer preferences can impact performance, a score above 6.0 highlights strong fundamental performance and resilience. This score is crucial for identifying companies with robust financial foundations in a highly competitive environment.
3. Asset Turnover > 1.0
Relevance: Asset Turnover measures the efficiency of asset use in generating sales. For consumer discretionary companies, a ratio above 1.0 signifies effective utilization of assets to drive revenue growth. Given the sector's reliance on high sales volumes and rapid inventory turnover, this metric is key to assessing operational efficiency.
4. Current Ratio > 1.5
Relevance: The Current Ratio assesses liquidity by comparing current assets to current liabilities. A ratio above 1.5 ensures that consumer discretionary companies can meet short-term obligations. This liquidity is essential for maintaining operational stability and flexibility to adapt to market changes, especially during economic fluctuations.
5. Debt to Equity Ratio < 1.0
Relevance: A lower Debt to Equity Ratio indicates prudent financial management and reduced reliance on debt. This is particularly important for consumer discretionary companies, which need to maintain financial flexibility to invest in new trends and innovations without overleveraging. Lower debt levels also reduce risk during economic downturns.
6. EBITDA Margin > 15.0%
Relevance: The EBITDA Margin measures operating profitability. A margin above 15.0% indicates efficient operations and the ability to generate sufficient earnings before interest, taxes, depreciation, and amortization. This is crucial for sustaining profitability in a competitive and fluctuating market, ensuring the company can reinvest in growth and innovation.
7. EPS One-Year Growth > 5.0%
Relevance: EPS growth reflects the company’s ability to increase earnings per share over the past year. For consumer discretionary companies, growth exceeding 5.0% signals positive earnings momentum, which is vital for investor confidence and the ability to fund future growth initiatives. This metric highlights companies that are successfully increasing profitability.
8. Gross Margin > 25.0%
Relevance: Gross Margin represents the profitability of sales after production costs. A margin exceeding 25.0% indicates strong pricing power and effective cost management, crucial for maintaining profitability while adapting to changing consumer demands. High gross margins are indicative of a company’s ability to control costs and price products competitively.
9. Net Margin > 10.0%
Relevance: Net Margin measures overall profitability after all expenses. A margin above 10.0% highlights the company’s ability to maintain strong profit levels, ensuring financial health and stability. This is essential for sustaining operations and investing in new opportunities, reflecting the company's efficiency in converting revenue into actual profit.
10.Return on Equity (ROE) > 15.0%
Relevance: ROE indicates how effectively a company uses equity to generate profits. An ROE above 15.0% signifies strong shareholder value creation. This metric is key for evaluating long-term performance in the consumer discretionary sector, where investor returns are closely tied to the company’s ability to innovate and grow. High ROE demonstrates effective management and profitable use of equity capital.
Interpreting the Buffett Quality Score
0-4 Points: Indicates potential weaknesses across multiple financial areas, warranting further investigation and risk assessment.
5 Points: Suggests average performance based on sector-specific criteria, indicating a need for cautious optimism.
6-10 Points: Signifies strong financial health and quality, meeting or exceeding most performance thresholds, making the company a potentially attractive investment.
Conclusion
The Buffett Quality Score provides a structured approach to evaluating financial health and performance. By focusing on these essential financial metrics, stakeholders can make informed decisions, identifying companies that are well-positioned to thrive in the competitive and economically sensitive consumer discretionary sector.
Disclaimer: The Buffett Quality Score serves as a tool for financial evaluation and analysis. It is not a substitute for professional financial advice or investment recommendations. Investors should conduct thorough research and seek personalized guidance based on individual circumstances.

Sniper BreakoutThis indicator is based on 3 indicator :=
1) Forex Market Session 2) Ema 200 3) Volume
This indicator is for Forex market ..in Forex market (ex- Eur/Usd ) price often (67%) do rotation in every session means example :let suppose a trade take trade in asian session and have 30 pips stop loss 67 % chance price will come back to entry price after London session or New York session so trade have less chance to make trade without hitting stop loss
in this indicator we are using Forex market session indicator to get session range start to end ..this indicator will only search opportunity in London And New York Session range and that can be customize from input section . user can select time zone and time of session from input section indicator and color of session .
next indicator using 200 length Exponential Moving Average for trend identification .if close price is above 200 Ema means trend is upside moving & if close price is below 200 Ema means price is moving downside .user can change length and source of Ema from input section .
Third and most important part is volume indicator when a session start (Example-London session it keep Look back 6 previous candle and compare volume imbalance between look back candle .look back candle can be customize from input section default look back candle input is (6).
next we are using trade range time to only show trade on certain time because often market convert into trading range so given specific input time it only take trade when volume and price is rising or falling .time range can be selected from input section .
Trade Entry Buy Signal -if price is either London or New York session and price is above 200 Ema and volume not in imbalance last number of candle it give Feb (first entry buy ) we keep save high price of every candle after Feb (label ) signal .if any candle break above Feb label it show a confirm buy signal ..Below in example as we can see
Example Image Buy Signal -
in this above example step -1 we searching imbalance of volume and price as we can see imbalance of volume and price on green candle .next we look price is above 200 ema .next step(2) we got Feb (first entry buy ) signal this is not a confirm buy signal .we save high of candle next candle high close above previous candle high we got confirm buy signal .
Trade Entry Sell Signal - if price is either London or New York session and price is below 200 Ema and volume not in imbalance last number of candle it give Feb (first entry Sell ) we keep save low price of every candle after Fes (label ) signal .if any candle break below Fes label it show a confirm sell signal ..Below in example as we can see
step-1 starting of london session we start getting imbalance between price and volume .price is getting rejected but volume is rising on green candle we got fes (first entry sell signal ).next we save low of fes candle but price close above that low of candle we dont get confirm sell entry next price break below low of previous candle so open a new sell signal ..
Example 3 - No Confirm buy/sell Signal
In this above Image example we did not get any confirm signal...we got first entry buy signal but price did not close high of candle in london session .so that day chance price can go any side ..
Example 4 -Feb signal and later confirm buy entry
in this above example we got imbalance of volume and feb(first entry buy signal) but we dont get any confirm buy signal price is just going high then previous candle ..later we see price crossover high of previous candle we got confirm buy signal
Use Of Indicator - This indicator helps traders identify potential trade setups by signaling the first entry points and confirming them later. It's particularly useful for avoiding getting caught in price rotations and aligning trades with significant volume and price movements. Traders should analyze price action and news before confirming a trade.

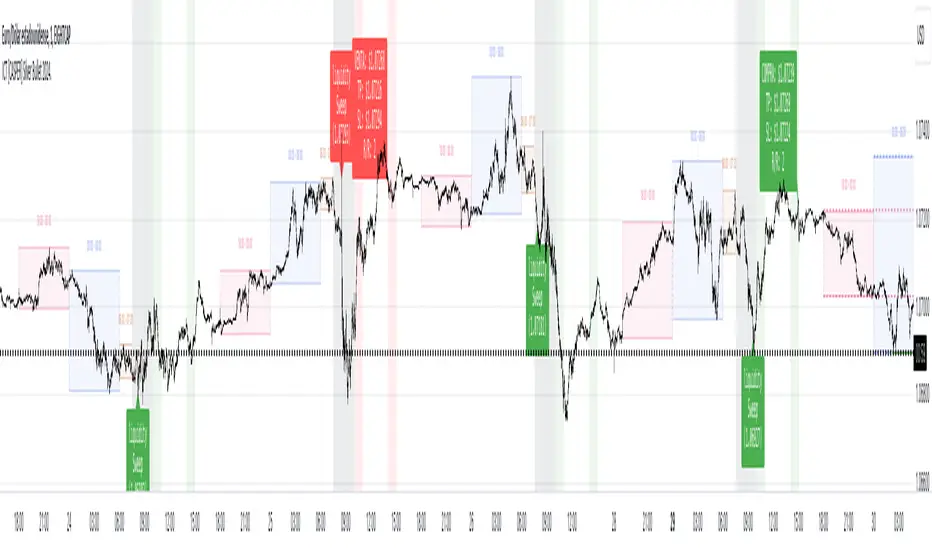
ICT [CASPER] Silver Bullet 2024.ENGLISH DESCRIPTION:
The "BOT SILVER BULLET 2024" indicator is a technical analysis tool tailored for active traders on the TradingView platform, combining market pattern study with quantitative trading intelligence. This sophisticated indicator overlays directly on the price chart and is designed to pinpoint and visualize critical liquidity zones, providing traders with a strategic edge in their decision-making process.
Its utility lies in identifying "Liquidity Zones," which are key areas where significant price movements are anticipated due to the accumulation or release of market orders. These zones are often levels where large market participants have placed unexecuted orders, which can lead to sharp and swift movements once those levels are reached. Foreseeing these points can be crucial for strategies aiming to capture volatility or find optimal entry and exit points.
The "BOT SILVER BULLET 2024" does not just focus on the present but also delivers historical analysis by identifying "Session Highs/Lows" and "Global Highs/Lows." These are the extreme points that have been reached during specific and broad timeframes, respectively. Knowing these levels can offer a deeper understanding of how the price has reacted in the past under certain market conditions, hinting at possible areas of support and resistance.
Furthermore, the indicator provides an in-depth analysis that delves beneath the surface. The "Analysis" function of this indicator scrutinizes price and volume patterns and correlates them with known market events, providing traders with a more informed perspective on the market's potential direction. This feature is invaluable for those looking to understand the underlying forces moving prices and how they might impact trading strategies.
To enhance usability and visual user experience, the "BOT SILVER BULLET 2024" allows users to "View Range Labels." This feature adds clear labels to price zones of particular interest, such as the aforementioned liquidity zones and historical highs and lows. These labels act as annotations that help traders keep track of significant developments without the need for constant manual analysis.
The indicator also highlights "Liquidity Grabs," moments when the price is anticipated to react significantly upon reaching levels previously identified with a high volume of pending orders. This information is pivotal for traders employing breakout or reversal strategies, as such price movements can provide profitable opportunities.
In summary, the "BOT SILVER BULLET 2024" indicator is a highly advanced tool and posits itself as one of the "most comprehensive market indicators." Its ability to provide an integrated view of the financial markets makes it indispensable for traders seeking to understand and anticipate price movements. Its amalgamation of historical data, alongside real-time visualization of market conditions, makes this tool not just comprehensive but also pertinent in today's dynamic trading environment. With its focus on liquidity and superior technical analysis, this indicator stands out as a true differentiator for serious traders looking to maximize their effectiveness in the financial markets.
DESCRIPCION EN ESPAÑOL:
El indicador "BOT SILVER BULLET 2024" es una herramienta de análisis técnico proyectada para operadores activos en la plataforma TradingView, con un diseño que fusiona el estudio de patrones de mercado y la inteligencia de trading cuantitativo. Este sofisticado indicador se integra directamente sobre el gráfico de precios y está diseñado para detectar y visualizar zonas críticas de liquidez, proporcionando a los operadores una ventaja estratégica en su toma de decisiones.
Su utilidad radica en la identificación de "Zonas de Liquidez", que son áreas clave donde se espera que ocurran movimientos significativos de precios debido a la acumulación o liberación de órdenes de mercado. Estas zonas son a menudo niveles donde los grandes participantes del mercado han colocado órdenes no ejecutadas, lo que puede dar lugar a movimientos rápidos y agudos una vez que se alcanzan esos niveles. La capacidad de prever estos puntos puede ser crucial para estrategias que buscan capturar volatilidad o encontrar puntos de entrada y salida óptimos.
El "BOT SILVER BULLET 2024" no sólo se enfoca en el presente, sino que también proporciona un análisis histórico mediante la identificación de "Altos/Bajos de Sesiones" y "Altos/Bajos Globales". Estos son los puntos extremos que han sido alcanzados durante períodos de tiempo específicos y generalizados, respectivamente. Conocer estos niveles puede ofrecer una comprensión más profunda de cómo el precio ha reaccionado en el pasado bajo ciertas condiciones de mercado, dando pistas sobre posibles áreas de soporte y resistencia.
Además, el indicador ofrece un análisis en profundidad que va más allá de la superficie. La función "Análisis" de este indicador examina patrones de precios y volúmenes, y los correlaciona con eventos de mercado conocidos, lo que proporciona a los traders una perspectiva más informada sobre la dirección potencial del mercado. Esta característica es invaluable para aquellos que buscan entender las fuerzas subyacentes que mueven los precios y cómo podrían afectar sus estrategias de trading.
Para mejorar la usabilidad y la experiencia visual del usuario, "BOT SILVER BULLET 2024" permite "Ver Etiquetas de Rangos". Esta función agrega etiquetas claras a las zonas de precio que son de particular interés, como las mencionadas zonas de liquidez, y los altos y bajos históricos. Estas etiquetas son una forma de anotación que ayuda a los operadores a mantenerse al tanto de los desarrollos significativos sin la necesidad de realizar un análisis manual constante.
El indicador también resalta las "Tomas de Liquidez", que son momentos en los que se espera que el precio reaccione de manera significativa al alcanzar niveles previamente identificados con un alto volumen de órdenes pendientes. Esta información es crucial para los traders que aplican estrategias de breakout o de reversión, ya que tales movimientos de precios pueden proporcionar oportunidades rentables.
Para resumir, el "BOT SILVER BULLET 2024" es un indicador altamente avanzado y se postula como uno de los "indicadores más completos del mercado". Su capacidad para proporcionar una vista integral de los mercados financieros lo hace indispensable para los traders que buscan comprender y anticipar movimientos de precios. Su integración de datos históricos, junto con la visualización en tiempo real de condiciones de mercado, hace que esta herramienta no solo sea completa sino también relevante en el dinámico entorno de trading actual. Con su enfoque en la liquidez y su análisis técnico superior, este indicador es un verdadero diferenciador para los traders serios que buscan maximizar su eficacia en los mercados financieros.
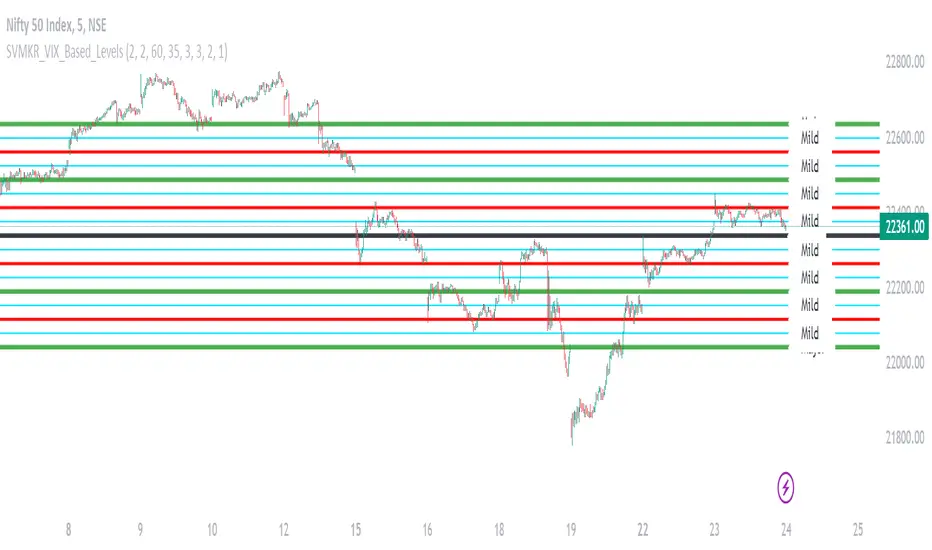
SVMKR_VIX_Based_LevelsThe "SVMKR_VIX_Based_Levels" script is a Pine Script indicator designed to assist intraday traders in identifying dynamic support and resistance levels based on the Volatility Index (VIX). Here's a breakdown of the script and its uses for intraday traders:
### Script Description:
1. **Data Retrieval**:
- The script fetches daily closing prices of the India VIX (volatility index) and a specified security using `request.security()`.
2. **Input Parameters**:
- Intraday traders can customize the indicator using input parameters such as the number of levels above and below the Pivot Day Close (PDC), line offset lengths, line extension options, and color and width settings for plotted lines.
3. **Plotting**:
- The script plots the PDC and VIX as hidden lines (`display=display.none`).
- Support and resistance levels are calculated based on the VIX and PDC, and plotted above and below the PDC with customizable colors and widths.
- Each level can be labeled with its corresponding price.
4. **Customization**:
- Intraday traders can choose to display or hide prices on the plotted lines.
- Colors and widths of plotted lines are customizable.
- Options to show minor and mild support levels provide additional flexibility.
5. **Labels**:
- Labels are added to indicate the PDC and the plotted levels, displaying corresponding prices if enabled.
### Uses for Intraday Traders:
1. **Dynamic Support and Resistance**: Intraday traders can benefit from dynamically adjusted support and resistance levels that respond to changes in market volatility, providing more accurate levels for trade planning.
2. **Market Sentiment Analysis**: By incorporating the VIX, a measure of market volatility and sentiment, the indicator provides insights into market sentiment, helping intraday traders gauge market mood and potential direction.
3. **Confirmation of Price Action**: The plotted support and resistance levels can serve as confirmation signals for intraday traders, helping validate trading decisions and enhance trading confidence.
4. **Adaptability to Changing Market Conditions**: Intraday traders often face rapidly changing market conditions. The indicator's ability to adapt to changes in volatility ensures that plotted levels remain relevant and responsive, aiding traders in adjusting their strategies accordingly.
5. **Trade Planning and Execution**: Intraday traders can use the plotted support and resistance levels to identify potential entry and exit points, set profit targets and stop-loss levels, and plan their trades more effectively.
Overall, the "SVMKR_VIX_Based_Levels" indicator provides intraday traders with a valuable tool for dynamic support and resistance identification, market sentiment analysis, confirmation of price action, and trade planning and execution, ultimately assisting them in making more informed and profitable trading decisions in the intraday timeframe.
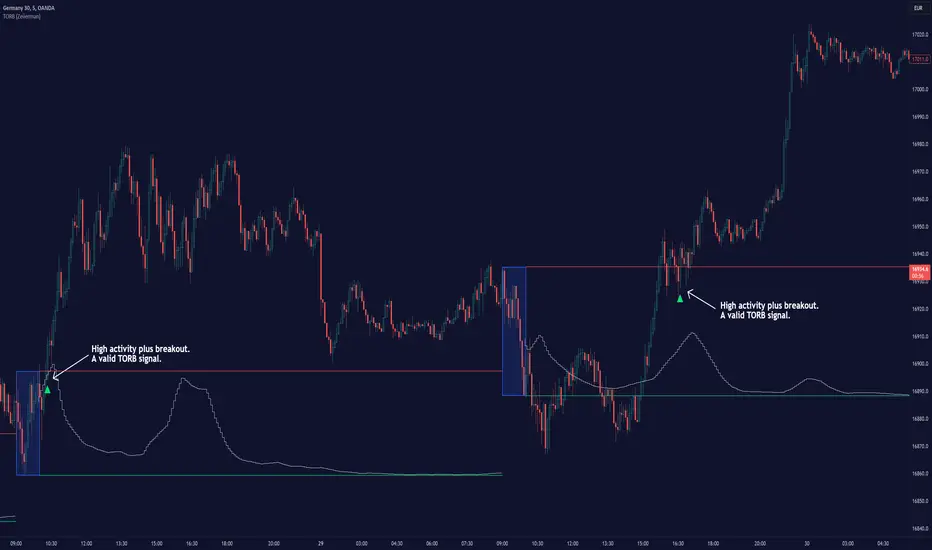
Bull Bear Trend IndicatorIntroduction: Origin of the Swing Point Indicator
In the quest for a reliable indicator that accurately predicts trend directions and identifies valid highs and lows, the genesis of the Swing Point Indicator emerged. Faced with the challenge of finding a tool that provided comprehensive market analysis and actionable insights, the need for a novel solution became evident. Combining insights gleaned from market analysis and innovative algorithmic approaches, the Swing Point Indicator was born.
Enhanced Feature: Highs and Lows Labeling in Trend Direction
In addition to its core functionalities, the Swing Point Indicator incorporates an advanced feature that enhances the visualization of trend direction. This feature provides further clarity by selectively labeling highs and lows based on the prevailing trend, reinforcing the identification of higher highs and lower lows in uptrends and downtrends, respectively. Overlapping labels on highs and lows signify a potential trend change, providing traders with valuable insight into market reversals.
Detailed Description:
1. Uptrend Labeling:
- Higher Highs (Green Label with Price): In an uptrend, where higher highs are observed, the indicator labels these points with vibrant green color and includes the corresponding price value. This visually highlights the significance of higher highs as pivotal points in the upward trajectory of prices.
- Higher Lows (Red Marker without Text or Diamond): To complement the identification of higher highs, higher lows are marked with a distinct red marker or diamond, devoid of any accompanying text. While these points are crucial in delineating the ascending trend, their emphasis lies in their role as support levels, providing a foundation for upward price movements.
2. Downtrend Labeling:
- Lower Lows (Red Label with Price): Conversely, in a downtrend characterized by lower lows, the indicator labels these points with conspicuous red color, accompanied by the corresponding price value. Lower lows signify critical levels of downward price momentum, acting as indicators of potential bearish continuation.
- Lower Highs (Green Marker without Text or Diamond): Lower highs, indicative of downward retracements in a downtrend, are marked by distinctive green markers or diamonds without accompanying text. While these points denote temporary pauses or pullbacks in the bearish trend, their emphasis lies in their role as resistance levels, impeding upward price movements.
Functionality and Utility:
- Customizable Lookback Candle Count: Traders have the option to adjust the lookback candle count, which is set by default at 108 candles in the settings. This flexibility allows traders to tailor the indicator to their specific trading preferences and timeframes.
- Equal Highs or Lows Option: When enabled, the Swing Point Indicator can identify equal highs or equal lows, providing traders with additional insight into market dynamics.
- Formation Confirmation: A new higher high along with its higher low or a new lower low along with its lower high is confirmed after two candles have closed following the swing point candle. This ensures the reliability of the identified trend direction.
Conclusion:
The incorporation of selective labeling for highs and lows based on trend direction, alongside the introduction of customizable settings and formation confirmation criteria, enhances the effectiveness of the Swing Point Indicator. This feature-rich tool empowers traders with a nuanced understanding of market dynamics, highlighting critical price levels and trend reversals. By offering enhanced visualization, customizable options, and confirmation criteria, the Swing Point Indicator equips traders with the confidence and precision needed to navigate the markets successfully, contributing to more informed and profitable trading strategies.

[FXAN] 77 Cygni Algorithm (Swing Trading)⚜️ FXAN CYGNI INDICATORS ORIGINALITY
Originality comes from proprietary formula we use to measure the relationship between Volume and Price Volatility in relation to overall current market positioning in developing Volume Profile and multiple custom period Volume Profiles. We combine that with our own approach to measure price velocity in correlation to average daily/weekly/monthly ranges of the given market.
The relationship between current volume and price volatility gives us information about how much the volume that is currently coming into the market affects the price movement (volatility) and which side is more dominant/involved in the market (Buyers/Sellers). We call this the "Volume Impact" factor.
This information is then compared in relation to the overall current market positioning in developing Volume Profile and Multiple custom period Volume Profiles. We have created a rating system based on current price positioning in relation to the Volume Profile. Volume profile consists of different volume nodes, high volume nodes where we consider market interest to be high (a lot of transactions - High Volume) and low volume nodes where we consider market interest to be low (not a lot of transactions - Low Volume). We call this the current "Market Interest" factor.
We combine this information with our own approach to measure price velocity in correlation to the higher-timeframe price ranges. Calculation is done by measuring current ranges of market movement in correlation to average daily/weekly/monthly ranges. We call this "Price Velocity" factor.
This approach was applied to develop key components of our Tradingview Indicators, we've simplified some of the calculations and made them easy to use by programming them to display buying/selling volume pressure with colors.
In addition to our own proprietary formulas and criterias to measure volume impact on price, we've also used an array of indicators that measure the percentage change in volume over custom specified periods of time, including custom period ranged Volume Profile, Developing VA, Accumulation/Distribution (A/D Line), Volume Rate of Change (VROC), Volume Price Trend (VPT) - all of them with of course fine-tuned settings to fit the purpose in the overall calculation.
Reasons for multiple indicator use:
Custom period ranged Volume Profiles: To determine current interest of market participants. Used for "Market Interest"
Developing VA: To determine current fair price of the market (value area). Used for "Market Interest".
Accumulation/Distribution (A/D Line): Helping to gauge the strength of buying and selling pressure. Used for "Volume Impact"
Volume Rate of Change (VROC): To give us information about percentage change in volume. Used for "Volume Impact"
Volume Price Trend (VPT): To help identify potential trends. Used for "Volume Impact".
Average True Range (ATR): Used for measuring volatility. Used for "Volume Impact" and "Price Velocity".
Average Daily Range (ADR): Used for measuring average market price movement. Used for "Price Velocity".
How it all works together:
"Volume Impact" factor tells us the influence of incoming market volume on price movement. This information alongside the overall market positioning information derived from "Market Interest" factor combined with information about speed and direction relative to higher-timeframe price ranges frin "Price Velocity.
This is the basis of our proprietary developed Volume Dynamics analysis approach
"Volume Impact" x "Market Interest" x "Price Velocity"
Combining this factors together gives a good overall understanding of which side is currently more involved in the market to gauge the direction ("Volume Impact"), where the market is currently positioned to gauge the context ("Market Interest") and what the current market's momentum to improve the timing of our trades ("Price Velocity"). This increases our probabilities for successful trades, executed with good timing.
To simplify - our indicators will always analyze the volume behind every price movement and rate those movements based on the relationship between movement distance and volume behind it through an array of criterias and rate them.
Colors displayed by the indicators will be a result of that, suggesting which side of the market (Buyers or sellers) is currently more involved in the market, aiming to increase the probabilities for profitable trades. With the help of our indicators you have deep volume analysis behind price movements done without looking at anything else then indicator components.
🔷 OVERVIEW
Cygni 77 Algorithm is a TradingView indicator designed to help determine higher timeframe market context and long-term market sentiment and trends. It analyzes the underlying volume behind market movements and colors the candles with the help of formulas that include technical analysis and market price action. It caters to traders looking for swing trading setups or additional perspectives for day trading sentiment.
🔷 KEY FEATURES
▊ Candle Coloring
▊ Dynamic Support & Resistance Lines
▊ Dots | Above and below the candles
▊ Colored Bar | on the bottom of the chart
🔷 HOW DOES IT WORK?
□ Candle colors will indicate the general market trend from the technical analysis perspective. The calculation for this component uses price action concepts and segments from technical analysis, for example, candle/price structural breaks. Volume is not used for calculations of this component.
□ Dynamic Support & Resistance Lines indicate the current market structure from the technical analysis perspective. The calculation uses pure price action and structural analysis of the current market movements.
□ Candle Dots show what are the mid-term volume dynamics in the market by referencing the daily average price weighted by volume with the periods ranging from days to weeks. Candle Dots suggest what is the likely direction of the market's trend from the mid-term perspective. If the market is bullish, you’ll see the green dots printed below the candles, and if the market is bearish, the dots will color red and print above the candles.
□ Colored Bar analyzes long-term volume dynamics and the market's price action for the past three to six weeks, referencing average price weighted by volume. This makes it much less sensitive than the Candle Dots, so the colors won't change that often. If the market is bullish, you’ll see the green bars, and if the market is bearish, the bars will color red.
🔷 HOW TO USE IT?
□ In general, we look for areas where all components are in sync. These are valid trading signals (refer to the usage example below).
□ If all components are not in sync, we should look for at least two of them to be in sync, while one of them must be the Colored Bar.
□ Candle Colors: Looking for longs when the candles are green and looking for shorts when the colors are red
□ Dynamic Support & Resistance Lines: Used for placing entries and stop-loss limits. Using retest of the line for entry and placing the stop-loss beyond it. Or if we're entering based on other components, we can use the line to place the stop-loss beyond it.
□ Candle Dots: Looking to trade in the direction of the color. If the market is bullish, you’ll see the green dots, and if the market is bearish, the dots will color red.
□ Colored Bar: Most important component of this indicator, we favor trading in the direction suggested by this component. Additional confirmation of other components is a bonus. Colors here don't change that often, but once they do - it usually signals a long-term trend shift. Green color suggests a bullish market, trading long. Red color suggests bearish market, trading short.
🔷 COMBINING THE COMPONENTS
Each component of the indicator serves its own purpose and analyzes the market from its own perspective and with its own custom settings and formulas. The calculation of the individual component is done independently from the calculation of the other components. Once all of them align, we can execute trades with an edge as it signals that different aspects of volume and price analysis line up for the trading opportunity.
-Candle Colors performs technical analysis for you by displaying the colors of a favorable market direction based on the market's current technical structure.
- Dynamic Support & Resistance Lines are used for placing your entry/exit limit orders.
-Candle Dots are used to determine the favorable direction of the market based on Daily Volume Dynamics, with custom timeframe settings ranging from a couple of days to a couple of weeks.
-The Colored Bar is used to gauge the overall favorable trading direction based on Daily Volume Dynamics with custom timeframe settings ranging from 3 to 6 weeks.
It's important to combine the components to increase the probability of success - here's how you should look for a trade:
1. Assess the current most favorable market direction by referencing the Colored Bar. Look for longs if it’s green and for shorts if it’s red
2. Look for the Candle Dots to align with the Colored Bar, look for longs if it’s green and for shorts if it’s red
3. Look for the Candle Colors to align with the Colored Bar. Look for longs if it’s green and for shorts if it’s red
4. Place your SL level beyond the currently developing Support/Resistance line to protect your positions and look for exits once the colors change.
A valid example of the trade would be:
- Colored Bar is green, indicating the favorable trading directions is long
- Candle Dots are green, indicating the favorable trading directions is long
- Candle Colors are green, indicating the market structure is favorable to enter your positions
📊 USAGE EXAMPLE

[FXAN] 75 Cygni Algorithm (Day Trading)⚜️ FXAN CYGNI INDICATORS ORIGINALITY
Originality comes from proprietary formula we use to measure the relationship between Volume and Price Volatility in relation to overall current market positioning in developing Volume Profile and multiple custom period Volume Profiles. We combine that with our own approach to measure price velocity in correlation to average daily/weekly/monthly ranges of the given market.
The relationship between current volume and price volatility gives us information about how much the volume that is currently coming into the market affects the price movement (volatility) and which side is more dominant/involved in the market (Buyers/Sellers). We call this the " Volume Impact " factor.
This information is then compared in relation to overall current market positioning in developing Volume Profile and Multiple custom period Volume Profiles. We have created a rating system based on current price positioning in relation to the Volume Profile. Volume profile consists of different volume nodes, high volume nodes where we consider market interest to be high (a lot of transactions - High Volume) and low volume nodes where we consider market interest to be low (not a lot of transactions - Low Volume). We call this the current " Market Interest " factor.
We combine this information with our own approach to measure price velocity in correlation to the higher-timeframe price ranges. Calculation is done by measuring current ranges of market movement in correlation to average daily/weekly/monthly ranges. We call this " Price Velocity " factor.
This approach was applied to develop key components of our Tradingview Indicators, we've simplified some of the calculations and made them easy to use by programming them to display buying/selling volume pressure with colors.
In addition to our own proprietary formulas and criterias to measure volume impact on price, we've also used an array of indicators that measure the percentage change in volume over custom specified periods of time, including custom period ranged Volume Profile, Developing VA, Accumulation/Distribution (A/D Line), Volume Rate of Change (VROC), Volume Price Trend (VPT) - all of them with of course fine-tuned settings to fit the purpose in the overall calculation.
Reasons for multiple indicator use:
Custom period ranged Volume Profiles: To determine current interest of market participants. Used for " Market Interest "
Developing VA: To determine current fair price of the market (value area). Used for " Market Interest ".
Accumulation/Distribution (A/D Line): Helping to gauge the strength of buying and selling pressure. Used for " Volume Impact "
Volume Rate of Change (VROC): To give us information about percentage change in volume. Used for " Volume Impact "
Volume Price Trend (VPT): To help identify potential trends. Used for " Volume Impact ".
Average True Range (ATR): Used for measuring volatility. Used for " Volume Impact " and " Price Velocity" .
Average Daily Range (ADR): Used for measuring average market price movement. Used for " Price Velocity ".
How it all works together:
"Volume Impact" factor tells us the influence of incoming market volume on price movement. This information alongside the overall market positioning information derived from "Market Interest" factor combined with information about speed and direction relative to higher-timeframe price ranges frin "Price Velocity.
This is the basis of our proprietary developed Volume Dynamics analysis approach
"Volume Impact" x "Market Interest" x "Price Velocity"
Combining this factors together gives a good overall understanding of which side is currently more involved in the market to gauge the direction ("Volume Impact"), where the market is currently positioned to gauge the context ("Market Interest") and what the current market's momentum to improve the timing of our trades ("Price Velocity"). This increases our probabilities for successful trades, executed with good timing.
To simplify - our indicators will always analyze the volume behind every price movement and rate those movements based on the relationship between movement distance and volume behind it through an array of criterias and rate them.
Colors displayed by the indicators will be a result of that, suggesting which side of the market (Buyers or sellers) is currently more involved in the market, aiming to increase the probabilities for profitable trades. With the help of our indicators you have deep volume analysis behind price movements done without looking at anything else then indicator components.
🔷 OVERVIEW
Cygni 75 Algorithm is a TradingView indicator crafted to refine your market analysis and assist in identifying potential entry and exit points by analyzing the underlying volume behind market movements. It helps you determine the overall daily context of the market and its conditions/trends by offering a suite of features tailored to provide insights to traders across various market conditions.
🔷 KEY FEATURES
▊ Candle Coloring
▊ Deviation Bands
▊ Momentum Bar | on the bottom of the chart
▊ Area of Interest (AOI) | Yellow rectangle
🔷 HOW DOES IT WORK?
□ Candles will color in reference to the dominance of buyers or sellers based on underlying volume calculated by a proprietary formula. The green color indicates that buyers are in control, and the red color indicates the selling volume is dominating the market. To simplify, green means there's more buying - red means there's more selling.
□ Deviation bands are used to determine potential trade entries and exits, derived by average price weighted by volume.
□ Momentum Bar shows market momentum by analyzing the differences between multiple moving averages. Green is bullish; red is bearish. The colors will lighten up when momentum is strong, and once the market slows down, they will get darker.
□ Area of Interest (AOI) is used for contextual reference, derived from the previous day's market movements. They remain static throughout the current day.
🔷 HOW TO USE IT?
□ In general, we look for areas where all components are in sync. This are valid trading signals (refer to the usage example below).
□ Candle Colors: Looking for longs when the candles are green, and looking for shorts when the colors are red
□ Deviation Bands: Once we enter the trade, we can place the SL and TP levels at the closest bands.
□ Momentum Bar: Helps with the timing of the entry, looking to enter on light Green/Red colors. Longs when green and shorts when red.
□ Area Of Interest: Generally, we're expecting rotational conditions inside the area and breakouts above/below once the market price gets outside of it. Longs above the area and shorts below the area for breakouts.
🔷 COMBINING THE COMPONENTS
Each component of the indicator serves it's own purpose and analyzes the market from it's own perspective and with its own custom settings and formulas (one looks at trading direction from the perspective of the overall trend and the other looks at price volatility to measure momentum - different perspectives). The calculation of the individual component is done independently from other components. Once all of them align we're able to execute trades with edge as it signals that different aspects of volume and price analysis line up for the trading opportinity.
- Candle Colors are used for determining trading direction
- Deviation bands are used for determining TP/SL levels
- Momentum bar is used to for better timing of your entries/exits.
- AOI is used to help you determine potential market conditions
It's important to combine the components to increase the probability of success - here's how you should look for a trade:
1. Determine the direction you want to trade in with the help of Candle Colors
2. Assess the current market price in reference to AOI - look for longs if the price is above the AOI, shorts if the price is below AOI, and rotations if it's inside the AOI.
3. Wait for the right momentum to develop to improve the timing of the entry by using Momentum Bar.
4. Place TP/SL levels with the help of Deviation bands based on your risk appetite.
A valid example of the trade would be:
- Green Candle Colors (indicating longs)
- Market price is currently above the AOI or breaking the edge of AOI in the upside movement (indicating longs)
- Momentum Bar is Green (indicating long momentum)
- Placing SL to the closest Deviation Band below the price and TP to the closest Deviation Band above the price.
📊 USAGE EXAMPLES

[FXAN] 71 Cygni Algorithm (Scalping)⚜️ FXAN CYGNI INDICATORS ORIGINALITY
Originality comes from proprietary formula we use to measure the relationship between Volume and Price Volatility in relation to overall current market positioning in developing Volume Profile and multiple custom period Volume Profiles. We combine that with our own approach to measure price velocity in correlation to average daily/weekly/monthly ranges of the given market.
The relationship between current volume and price volatility gives us information about how much the volume that is currently coming into the market affects the price movement (volatility) and which side is more dominant/involved in the market (Buyers/Sellers). We call this the "Volume Impact" factor.
This information is then compared in relation to the overall current market positioning in developing Volume Profile and Multiple custom period Volume Profiles. We have created a rating system based on current price positioning in relation to the Volume Profile. Volume profile consists of different volume nodes, high volume nodes where we consider market interest to be high (a lot of transactions - High Volume) and low volume nodes where we consider market interest to be low (not a lot of transactions - Low Volume). We call this the current "Market Interest" factor.
We combine this information with our own approach to measure price velocity in correlation to the higher-timeframe price ranges. Calculation is done by measuring current ranges of market movement in correlation to average daily/weekly/monthly ranges. We call this "Price Velocity" factor.
This approach was applied to develop key components of our Tradingview Indicators, we've simplified some of the calculations and made them easy to use by programming them to display buying/selling volume pressure with colors.
In addition to our own proprietary formulas and criterias to measure volume impact on price, we've also used an array of indicators that measure the percentage change in volume over custom specified periods of time, including custom period ranged Volume Profile, Developing VA, Accumulation/Distribution (A/D Line), Volume Rate of Change (VROC), Volume Price Trend (VPT) - all of them with of course fine-tuned settings to fit the purpose in the overall calculation.
Reasons for multiple indicator use:
Custom period ranged Volume Profiles: To determine current interest of market participants. Used for "Market Interest"
Developing VA: To determine current fair price of the market (value area). Used for "Market Interest".
Accumulation/Distribution (A/D Line): Helping to gauge the strength of buying and selling pressure. Used for "Volume Impact"
Volume Rate of Change (VROC): To give us information about percentage change in volume. Used for "Volume Impact"
Volume Price Trend (VPT): To help identify potential trends. Used for "Volume Impact".
Average True Range (ATR): Used for measuring volatility. Used for "Volume Impact" and "Price Velocity".
Average Daily Range (ADR): Used for measuring average market price movement. Used for "Price Velocity".
How it all works together:
"Volume Impact" factor tells us the influence of incoming market volume on price movement. This information alongside the overall market positioning information derived from "Market Interest" factor combined with information about speed and direction relative to higher-timeframe price ranges frin "Price Velocity.
This is the basis of our proprietary developed Volume Dynamics analysis approach
"Volume Impact" x "Market Interest" x "Price Velocity"
Combining this factors together gives a good overall understanding of which side is currently more involved in the market to gauge the direction ("Volume Impact"), where the market is currently positioned to gauge the context ("Market Interest") and what the current market's momentum to improve the timing of our trades ("Price Velocity"). This increases our probabilities for successful trades, executed with good timing.
To simplify - our indicators will always analyze the volume behind every price movement and rate those movements based on the relationship between movement distance and volume behind it through an array of criterias and rate them.
Colors displayed by the indicators will be a result of that, suggesting which side of the market (Buyers or sellers) is currently more involved in the market, aiming to increase the probabilities for profitable trades. With the help of our indicators you have deep volume analysis behind price movements done without looking at anything else then indicator components.
🔷 OVERVIEW
Cygni 71 Algorithm is a TradingView indicator designed for short-term trading (scalping) and enhancing the precision of your entries/exits based on a higher timeframe market context. It analyzes the underlying volume behind market movements and colors the candles with the help of the Heiken-Ashi methodology to provide a clearer perspective on the market's potential direction and intentions.
🔷 KEY FEATURES
▊ Candle Coloring
▊ Upper Colored Bar
▊ Lower Colored Bar
🔷 HOW DOES IT WORK?
□ Candles will color in reference to the Heiken ashi "average bar" methodology, which uses a modified formula based on two-period averages. This way, you can observe the normal candlesticks with less noise as colors will suggest the most likely direction where the market might be heading.
□ Upper Colored Bar analyzes daily volume dynamics in the market's price action by referencing the daily average price weighted by volume. If the market is bullish, you’ll see the green bars, and if the market is bearish, the bars will color red.
□ Lower Colored Bar analyzes volume dynamics and the market's price action every few second and minute intervals by referencing average price weighted by volume. This makes it much more sensitive than the Upper Colored Bar. If the market is bullish, you’ll see the green bars, and if the market is bearish, the bars will color red.
🔷 HOW TO USE IT?
□ In general, we look for areas where all components are in sync. These are valid trading signals (refer to the usage example below).
□ If all components are not in sync, we should look for at least two of them to be in sync while one of them must be Upper Colored Bar.
□ Candle Colors: Looking for longs when the candles are green and looking for shorts when the colors are red
□ Upper Colored Bar: The most important component of this indicator is that we favor trading in the direction suggested by this component. Additional confirmation of other components is a bonus. The green color suggests a bullish market, trading long. Red color suggests bearish market, trading short.
□ Lower Colored Bar: This should not be used on its own but always combined with at least one of the other components due to its sensitivity. Colors are indicating longs when green and shorts when red.
🔷 COMBINING THE COMPONENTS
Each component of the indicator serves it's own purpose and analyzes the market from it's own perspective and with its own custom settings and formulas. The calculation of the individual component is done independently from other components. Once all of them align, we're able to execute trades with an edge as it signals that different aspects of volume and price analysis line up for the trading opportunity.
- Candle Colors are used for improving the timing of your entries/exits based on market structure
- Upper Colored Bar is used for determining the favorable direction of the market based on Daily Volume Dynamics.
- Lower Colored Bar used for determining the favorable direction of the market based on Second/Minute/3-minute Volume Dynamics.
It's important to combine the components to increase the probability of success - here's how you should look for a trade:
1. Assess the current most favorable market direction by referencing the Upper Colored bar, look for longs if it’s green and for shorts if it’s red
2. Look for the Candle Colors to align with the Upper Colored bar, look for longs if it’s green and for shorts if it’s red
3. Look for short-time frame volume dynamics to align with your entries, by referencing the Lower Colored Bar - look for longs if it’s green and for shorts if it’s red.
A valid example of the trade would be:
- Upper Colored Bar is green, indicating the favorable trading directions is long
- Lower Colored Bar is green, indicating the favorable trading directions is long
- Candle Colors are green, indicating the market structure is favorable to enter your positions
📊 USAGE EXAMPLE

Day Open Line + SMA 8/3 Crossover + BollingerHow Users Can Make Profit Using This Script:
DAYS OPEN LINE:
1.Purpose: Publishing a "Days Open Line" indicator serves to inform customers about the operational schedule of a business or service.
2.Visibility: It ensures that the information regarding the days of operation is easily accessible to current and potential customers.
3.Transparency: By making the operational schedule public, businesses demonstrate transparency and reliability to their customers.
4.Accessibility: The indicator should be published on various platforms such as the business website, social media channels, and physical locations to ensure accessibility to a wide audience.
5.Clarity: The information should be presented in a clear and concise manner, specifying the days of the week the business is open and the corresponding operating hours.
6.Updates: It's important to regularly update the "Days Open Line" indicator to reflect any changes in the operational schedule, such as holidays or special events.
7.Customer Convenience: Providing this information helps customers plan their visits accordingly, reducing inconvenience and frustration due to unexpected closures.
8.Expectation Management: Setting clear expectations regarding the business hours helps manage customer expectations and reduces the likelihood of disappointment or complaints.
9.Customer Service: Publishing the "Days Open Line" indicator demonstrates a commitment to customer service by ensuring that customers have the information they need to engage with the business.
10.Brand Image: Consistently .maintaining and updating the indicator contributes to a positive brand image, as it reflects professionalism, reliability, and a customer-centric approach.
SMA CROSS:
1.This indicator generates buy and sell signals based on the crossover of two Simple Moving Averages (SMA): a shorter 3-day SMA and a longer 8-day SMA.
When the 3-day SMA crosses above the 8-day SMA, it generates a buy signal indicating a potential upward trend.
Conversely, when the 3-day SMA crosses below the 8-day SMA, it generates a sell signal indicating a potential downward trend.
Signal Interpretation:
2.Buy Signal: Generated when the 3-day SMA crosses above the 8-day SMA.
Sell Signal: Generated when the 3-day SMA crosses below the 8-day SMA.
Usage:
3.Traders can use this indicator to identify potential entry and exit points in the market.
Buy signals suggest a bullish trend, indicating a favorable time to enter or hold a long position.
4.Sell signals suggest a bearish trend, indicating a potential opportunity to exit or take a short position.
Parameters:
5.Periods: 3-day SMA and 8-day SMA.
Price: Closing price is commonly used, but users can choose other price types (open, high, low) for calculation.
Confirmation:
6.It's recommended to use additional technical analysis tools or confirmatory indicators to validate signals and minimize false signals.
Risk Management:
7.Implement proper risk management strategies, such as setting stop-loss orders, to mitigate losses in case of adverse price movements.
Backtesting:
8.Before using the indicator in live trading, conduct thorough backtesting to evaluate its effectiveness under various market conditions.
Considerations:
9.While SMA crossovers can provide valuable insights, they may generate false signals during ranging or choppy markets.
Combine this indicator with other technical analysis techniques for comprehensive market analysis.
Continuous Optimization:
10.Monitor the performance of the indicator and adjust parameters or incorporate additional filters as needed to enhance accuracy over time.
BOLLINGER BAND:
1.Definition: A Bollinger Band indicator is a technical analysis tool that consists of a centerline (typically a moving average) and two bands plotted above and below it. These bands represent volatility around the moving average.
2.Purpose: Publishing a Bollinger Band indicator serves to provide traders and investors with insights into the volatility and potential price movements of a financial instrument.
3.Visualization: The indicator is typically displayed on price charts, allowing users to visualize the relationship between price movements and volatility levels.
4.Interpretation: Traders use Bollinger Bands to identify overbought and oversold conditions, potential trend reversals, and volatility breakouts.
5.Components: The indicator consists of three main components: the upper band, lower band, and centerline (usually a simple moving average). These components are calculated based on standard deviations from the moving average.
6.Parameters: Traders can adjust the parameters of the Bollinger Bands, such as the period length and standard deviation multiplier, to customize the indicator based on their trading strategy and preferences.
7.Signals: Bollinger Bands generate signals when prices move outside the bands, indicating potential trading opportunities. For example, a price breakout above the upper band may signal a bullish trend continuation, while a breakout below the lower band may indicate a bearish trend continuation.
8.Confirmation: Traders often use other technical indicators or price action analysis to confirm signals generated by Bollinger Bands, enhancing the reliability of their trading decisions.
9.Education: Publishing Bollinger Band indicators can serve an educational purpose, helping traders learn about technical analysis concepts and how to apply them in real-world trading scenarios.
10.Risk Management: Traders should exercise proper risk management when using Bollinger Bands, as false signals and market volatility can lead to losses. Publishing educational content alongside the indicator can help users understand the importance of risk management in trading.
VWAP:
1.Calculation: VWAP is calculated by dividing the cumulative sum of price times volume traded for every transaction (price * volume) by the total volume traded.
2.Time Frame: VWAP is typically calculated for a specific time frame, such as a trading day or a session.
3.Intraday Trading: It's commonly used by intraday traders to assess the fair value of a security and to determine if the current price is above or below the average price traded during the day.
4.Execution: Institutional traders often use VWAP as a benchmark for executing large orders, aiming to buy at prices below VWAP and sell at prices above VWAP.
5.Benchmark: It serves as a benchmark for traders to evaluate their trading performance. Trades executed below VWAP are considered good buys, while those above are considered less favorable.
6.Sensitivity: VWAP is more sensitive to price and volume changes during periods of high trading activity and less sensitive during periods of low trading activity.
7.Day's End: VWAP resets at the end of each trading day, providing a new reference point for the following trading session.
8.Volume Weighting: The weighting by volume means that prices with higher trading volumes have a greater impact on VWAP than those with lower volumes.
9.Popular with Algorithmic Traders: Algorithmic trading systems often incorporate VWAP strategies to execute trades efficiently and minimize market impact.
10.Limitations: While VWAP is a useful indicator, it's not foolproof. It may lag behind rapidly changing market conditions and may not be suitable for all trading strategies or market conditions. Additionally, it's more effective in liquid markets where there is significant trading volume.
How the Script Works:
1.Utilizes Day Open Line for accurate market entry points.
2.Identifies bullish trends with SMA 3 crossover SMA 8.
3.Signals potential sell opportunities with SMA 8 crossunder SMA 3.
4.Bollinger Bands indicate overbought and oversold conditions.
5.VWAP offers insights into average price levels weighted by volume.
6.Combination of indicators enhances trade confirmation.
7.Facilitates precise timing for buy and sell decisions.
8.Enables traders to capitalize on market volatility.
9.Empowers users to navigate dynamic market conditions.
10.Supports profitable trading strategies with comprehensive analysis.
11.It is known when the market is sideways.

200 EMA Trend Strategy Anti meanDescription:
The "200 EMA Trend Strategy" is a versatile technical analysis tool designed for day trading and long-term investing. It aims to identify potential trend reversal points in the market based on the interaction between the price and the 200-period Exponential Moving Average (EMA). This strategy utilizes the 200 EMA, standard deviation bands, and basic trend analysis to generate buy and sell signals.
Key Features:
200-period Exponential Moving Average (EMA): The indicator plots the 200-period Exponential Moving Average, a reliable trend-following indicator that smooths out price data to identify the underlying trend direction.
Standard Deviation Bands: Upper and lower bands around the 200 EMA are calculated based on a specified standard deviation multiplier. These bands help identify potential overbought and oversold levels in the market.
Trend Signals: Buy signals are generated when the price crosses above the 200 EMA, indicating a potential bullish trend, while sell signals are generated when the price crosses below the 200 EMA, indicating a potential bearish trend.
Exit Signals: Exit signals are triggered when the price moves beyond the standard deviation bands in the opposite direction of the current trend. Most trades will be exited with minimal losses, aiming to grow the trading account over time. Multiple exit signals may be displayed, but only the first signal will be considered, ignoring subsequent signals to minimize drawdown.
Usage:
Day Trading: For intraday trading, traders can use a one-minute chart and fix the indicator's timeframe to five minutes. This allows for quick decision-making and minimizes drawdown by focusing on short-term price movements.
Long-Term Investing: For long-term investing, traders can utilize a four-hour or two-hour chart and fix the indicator's timeframe to daily or one-day timeframe. This provides a broader perspective of the market trends and allows for strategic positioning over longer time horizons.
Risk Management: Employ proper risk management techniques and position sizing strategies to mitigate losses and maximize profits. Use the indicator's exit signals to exit trades with minimal losses and allow profitable trades to grow the trading account over time.
Risk Disclosure: Trading involves risks, and this indicator should be used as part of a comprehensive trading strategy. It is essential to consider risk management principles and employ proper position sizing techniques when trading based on the signals generated by this indicator.
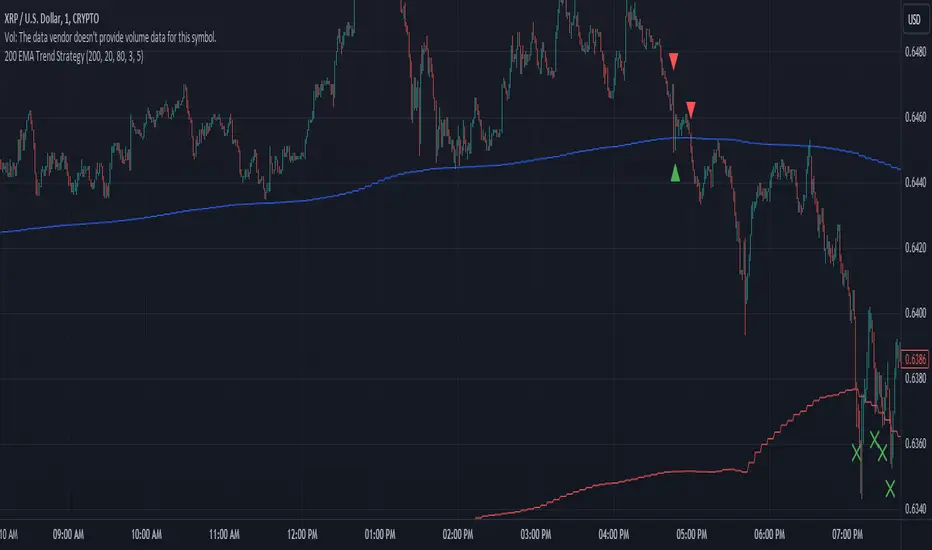
RSI-HeatmapThis unique indicator is a comprehensive tool designed for traders seeking to gain an edge in the market. It consists of three main components: a revised RSI, a dynamic heatmap, and an integrated alert system.
1.Modified RSI:
Unlike the traditional RSI that calculates delta as the difference between the current price and the previous price (Δ = {price} - {previous price}), this version computes delta by comparing the current price with the price n periods ago (Δ = {price} - {n-th previous price}). This delta is then smoothed using a Volume Weighted Moving Average (VWMA) with a short length to preserve the RSI's core characteristics while adapting it to capture longer-term momentum shifts more effectively.
2.Heatmap:
The heatmap feature introduces a novel approach to visualize market conditions, with 5 high levels and 5 low levels identified around the current price. When the price crosses these thresholds, the RSI-based heatmap changes colors, ranging from blue (indicative of oversold conditions) to red (signaling overbought conditions). This visual tool helps traders quickly gauge the strength and potential reversal points in the market.
3.Alert:
The Alert system employs MACD (Moving Average Convergence Divergence) and CCI (Commodity Channel Index) indicators to signal potential buy or sell opportunities. It categorizes alerts into four color-coded recommendations:
Green and Lighter Green: Strong buy signal, suggesting favorable conditions for entering buy positions.
Blue and Lighter Blue: Moderate buy signal, indicating less robust but potentially profitable buy conditions.
Red and Lighter Red: Strong sell signal, advising traders to consider taking sell positions.
Orange and Lighter Orange: Moderate sell signal, hinting at sell conditions that are not as compelling as those indicated by red.

GKD-V Stiffness [Loxx]The Giga Kaleidoscope GKD-V Stiffness is a Volume/Volatility module included in Loxx's "Giga Kaleidoscope Modularized Trading System."
█ GKD-V Stiffness
The stiffness indicator quantifies the market's momentum by analyzing the relationship between price movements and volatility over a specific time frame. It employs a moving average to smooth out price data, providing a baseline for trend assessment. The key element in this calculation is the incorporation of a volatility factor, typically standard deviation, which adjusts the moving average to account for market volatility. This adjusted moving average creates a benchmark that the current price must surpass to signal significant momentum.
By comparing the current price to this volatility-adjusted moving average, the stiffness indicator determines the strength of the market's trend. A higher stiffness value, surpassing a predefined threshold, indicates a strong and potentially profitable trend, either upward or downward, suggesting opportunities for strategic trading positions. Conversely, a stiffness value below the threshold signifies insufficient momentum, advising traders to refrain from entering the market due to the high risk of unpredictability. This method provides a systematic approach to evaluate market trends, enabling traders to make decisions based on the robustness of price movements relative to historical volatility.
█ Giga Kaleidoscope Modularized Trading System
Core components of an NNFX algorithmic trading strategy
The NNFX algorithm is built on the principles of trend, momentum, and volatility. There are six core components in the NNFX trading algorithm:
1. Volatility - price volatility; e.g., Average True Range, True Range Double, Close-to-Close, etc.
2. Baseline - a moving average to identify price trend
3. Confirmation 1 - a technical indicator used to identify trends
4. Confirmation 2 - a technical indicator used to identify trends
5. Continuation - a technical indicator used to identify trends
6. Volatility/Volume - a technical indicator used to identify volatility/volume breakouts/breakdown
7. Exit - a technical indicator used to determine when a trend is exhausted
8. Metamorphosis - a technical indicator that produces a compound signal from the combination of other GKD indicators*
*(not part of the NNFX algorithm)
What is Volatility in the NNFX trading system?
In the NNFX (No Nonsense Forex) trading system, ATR (Average True Range) is typically used to measure the volatility of an asset. It is used as a part of the system to help determine the appropriate stop loss and take profit levels for a trade. ATR is calculated by taking the average of the true range values over a specified period.
True range is calculated as the maximum of the following values:
-Current high minus the current low
-Absolute value of the current high minus the previous close
-Absolute value of the current low minus the previous close
ATR is a dynamic indicator that changes with changes in volatility. As volatility increases, the value of ATR increases, and as volatility decreases, the value of ATR decreases. By using ATR in NNFX system, traders can adjust their stop loss and take profit levels according to the volatility of the asset being traded. This helps to ensure that the trade is given enough room to move, while also minimizing potential losses.
Other types of volatility include True Range Double (TRD), Close-to-Close, and Garman-Klass
What is a Baseline indicator?
The baseline is essentially a moving average, and is used to determine the overall direction of the market.
The baseline in the NNFX system is used to filter out trades that are not in line with the long-term trend of the market. The baseline is plotted on the chart along with other indicators, such as the Moving Average (MA), the Relative Strength Index (RSI), and the Average True Range (ATR).
Trades are only taken when the price is in the same direction as the baseline. For example, if the baseline is sloping upwards, only long trades are taken, and if the baseline is sloping downwards, only short trades are taken. This approach helps to ensure that trades are in line with the overall trend of the market, and reduces the risk of entering trades that are likely to fail.
By using a baseline in the NNFX system, traders can have a clear reference point for determining the overall trend of the market, and can make more informed trading decisions. The baseline helps to filter out noise and false signals, and ensures that trades are taken in the direction of the long-term trend.
What is a Confirmation indicator?
Confirmation indicators are technical indicators that are used to confirm the signals generated by primary indicators. Primary indicators are the core indicators used in the NNFX system, such as the Average True Range (ATR), the Moving Average (MA), and the Relative Strength Index (RSI).
The purpose of the confirmation indicators is to reduce false signals and improve the accuracy of the trading system. They are designed to confirm the signals generated by the primary indicators by providing additional information about the strength and direction of the trend.
Some examples of confirmation indicators that may be used in the NNFX system include the Bollinger Bands, the MACD (Moving Average Convergence Divergence), and the MACD Oscillator. These indicators can provide information about the volatility, momentum, and trend strength of the market, and can be used to confirm the signals generated by the primary indicators.
In the NNFX system, confirmation indicators are used in combination with primary indicators and other filters to create a trading system that is robust and reliable. By using multiple indicators to confirm trading signals, the system aims to reduce the risk of false signals and improve the overall profitability of the trades.
What is a Continuation indicator?
In the NNFX (No Nonsense Forex) trading system, a continuation indicator is a technical indicator that is used to confirm a current trend and predict that the trend is likely to continue in the same direction. A continuation indicator is typically used in conjunction with other indicators in the system, such as a baseline indicator, to provide a comprehensive trading strategy.
What is a Volatility/Volume indicator?
Volume indicators, such as the On Balance Volume (OBV), the Chaikin Money Flow (CMF), or the Volume Price Trend (VPT), are used to measure the amount of buying and selling activity in a market. They are based on the trading volume of the market, and can provide information about the strength of the trend. In the NNFX system, volume indicators are used to confirm trading signals generated by the Moving Average and the Relative Strength Index. Volatility indicators include Average Direction Index, Waddah Attar, and Volatility Ratio. In the NNFX trading system, volatility is a proxy for volume and vice versa.
By using volume indicators as confirmation tools, the NNFX trading system aims to reduce the risk of false signals and improve the overall profitability of trades. These indicators can provide additional information about the market that is not captured by the primary indicators, and can help traders to make more informed trading decisions. In addition, volume indicators can be used to identify potential changes in market trends and to confirm the strength of price movements.
What is an Exit indicator?
The exit indicator is used in conjunction with other indicators in the system, such as the Moving Average (MA), the Relative Strength Index (RSI), and the Average True Range (ATR), to provide a comprehensive trading strategy.
The exit indicator in the NNFX system can be any technical indicator that is deemed effective at identifying optimal exit points. Examples of exit indicators that are commonly used include the Parabolic SAR, and the Average Directional Index (ADX).
The purpose of the exit indicator is to identify when a trend is likely to reverse or when the market conditions have changed, signaling the need to exit a trade. By using an exit indicator, traders can manage their risk and prevent significant losses.
In the NNFX system, the exit indicator is used in conjunction with a stop loss and a take profit order to maximize profits and minimize losses. The stop loss order is used to limit the amount of loss that can be incurred if the trade goes against the trader, while the take profit order is used to lock in profits when the trade is moving in the trader's favor.
Overall, the use of an exit indicator in the NNFX trading system is an important component of a comprehensive trading strategy. It allows traders to manage their risk effectively and improve the profitability of their trades by exiting at the right time.
What is an Metamorphosis indicator?
The concept of a metamorphosis indicator involves the integration of two or more GKD indicators to generate a compound signal. This is achieved by evaluating the accuracy of each indicator and selecting the signal from the indicator with the highest accuracy. As an illustration, let's consider a scenario where we calculate the accuracy of 10 indicators and choose the signal from the indicator that demonstrates the highest accuracy.
The resulting output from the metamorphosis indicator can then be utilized in a GKD-BT backtest by occupying a slot that aligns with the purpose of the metamorphosis indicator. The slot can be a GKD-B, GKD-C, or GKD-E slot, depending on the specific requirements and objectives of the indicator. This allows for seamless integration and utilization of the compound signal within the GKD-BT framework.
How does Loxx's GKD (Giga Kaleidoscope Modularized Trading System) implement the NNFX algorithm outlined above?
Loxx's GKD v2.0 system has five types of modules (indicators/strategies). These modules are:
1. GKD-BT - Backtesting module (Volatility, Number 1 in the NNFX algorithm)
2. GKD-B - Baseline module (Baseline and Volatility/Volume, Numbers 1 and 2 in the NNFX algorithm)
3. GKD-C - Confirmation 1/2 and Continuation module (Confirmation 1/2 and Continuation, Numbers 3, 4, and 5 in the NNFX algorithm)
4. GKD-V - Volatility/Volume module (Confirmation 1/2, Number 6 in the NNFX algorithm)
5. GKD-E - Exit module (Exit, Number 7 in the NNFX algorithm)
6. GKD-M - Metamorphosis module (Metamorphosis, Number 8 in the NNFX algorithm, but not part of the NNFX algorithm)
(additional module types will added in future releases)
Each module interacts with every module by passing data to A backtest module wherein the various components of the GKD system are combined to create a trading signal.
That is, the Baseline indicator passes its data to Volatility/Volume. The Volatility/Volume indicator passes its values to the Confirmation 1 indicator. The Confirmation 1 indicator passes its values to the Confirmation 2 indicator. The Confirmation 2 indicator passes its values to the Continuation indicator. The Continuation indicator passes its values to the Exit indicator, and finally, the Exit indicator passes its values to the Backtest strategy.
This chaining of indicators requires that each module conform to Loxx's GKD protocol, therefore allowing for the testing of every possible combination of technical indicators that make up the six components of the NNFX algorithm.
What does the application of the GKD trading system look like?
Example trading system:
Backtest: Multi-Ticker CC Backtest
Baseline: Hull Moving Average
Volatility/Volume: Hurst Exponent
Confirmation 1: Advance Trend Pressure as shown on the chart above
Confirmation 2: uf2018
Continuation: Coppock Curve
Exit: Rex Oscillator
Metamorphosis: Baseline Optimizer
Each GKD indicator is denoted with a module identifier of either: GKD-BT, GKD-B, GKD-C, GKD-V, GKD-M, or GKD-E. This allows traders to understand to which module each indicator belongs and where each indicator fits into the GKD system.
█ Giga Kaleidoscope Modularized Trading System Signals
Standard Entry
1. GKD-C Confirmation gives signal
2. Baseline agrees
3. Price inside Goldie Locks Zone Minimum
4. Price inside Goldie Locks Zone Maximum
5. Confirmation 2 agrees
6. Volatility/Volume agrees
1-Candle Standard Entry
1a. GKD-C Confirmation gives signal
2a. Baseline agrees
3a. Price inside Goldie Locks Zone Minimum
4a. Price inside Goldie Locks Zone Maximum
Next Candle
1b. Price retraced
2b. Baseline agrees
3b. Confirmation 1 agrees
4b. Confirmation 2 agrees
5b. Volatility/Volume agrees
Baseline Entry
1. GKD-B Baseline gives signal
2. Confirmation 1 agrees
3. Price inside Goldie Locks Zone Minimum
4. Price inside Goldie Locks Zone Maximum
5. Confirmation 2 agrees
6. Volatility/Volume agrees
7. Confirmation 1 signal was less than 'Maximum Allowable PSBC Bars Back' prior
1-Candle Baseline Entry
1a. GKD-B Baseline gives signal
2a. Confirmation 1 agrees
3a. Price inside Goldie Locks Zone Minimum
4a. Price inside Goldie Locks Zone Maximum
5a. Confirmation 1 signal was less than 'Maximum Allowable PSBC Bars Back' prior
Next Candle
1b. Price retraced
2b. Baseline agrees
3b. Confirmation 1 agrees
4b. Confirmation 2 agrees
5b. Volatility/Volume agrees
Volatility/Volume Entry
1. GKD-V Volatility/Volume gives signal
2. Confirmation 1 agrees
3. Price inside Goldie Locks Zone Minimum
4. Price inside Goldie Locks Zone Maximum
5. Confirmation 2 agrees
6. Baseline agrees
7. Confirmation 1 signal was less than 7 candles prior
1-Candle Volatility/Volume Entry
1a. GKD-V Volatility/Volume gives signal
2a. Confirmation 1 agrees
3a. Price inside Goldie Locks Zone Minimum
4a. Price inside Goldie Locks Zone Maximum
5a. Confirmation 1 signal was less than 'Maximum Allowable PSVVC Bars Back' prior
Next Candle
1b. Price retraced
2b. Volatility/Volume agrees
3b. Confirmation 1 agrees
4b. Confirmation 2 agrees
5b. Baseline agrees
Confirmation 2 Entry
1. GKD-C Confirmation 2 gives signal
2. Confirmation 1 agrees
3. Price inside Goldie Locks Zone Minimum
4. Price inside Goldie Locks Zone Maximum
5. Volatility/Volume agrees
6. Baseline agrees
7. Confirmation 1 signal was less than 7 candles prior
1-Candle Confirmation 2 Entry
1a. GKD-C Confirmation 2 gives signal
2a. Confirmation 1 agrees
3a. Price inside Goldie Locks Zone Minimum
4a. Price inside Goldie Locks Zone Maximum
5a. Confirmation 1 signal was less than 'Maximum Allowable PSC2C Bars Back' prior
Next Candle
1b. Price retraced
2b. Confirmation 2 agrees
3b. Confirmation 1 agrees
4b. Volatility/Volume agrees
5b. Baseline agrees
PullBack Entry
1a. GKD-B Baseline gives signal
2a. Confirmation 1 agrees
3a. Price is beyond 1.0x Volatility of Baseline
Next Candle
1b. Price inside Goldie Locks Zone Minimum
2b. Price inside Goldie Locks Zone Maximum
3b. Confirmation 1 agrees
4b. Confirmation 2 agrees
5b. Volatility/Volume agrees
Continuation Entry
1. Standard Entry, 1-Candle Standard Entry, Baseline Entry, 1-Candle Baseline Entry, Volatility/Volume Entry, 1-Candle Volatility/Volume Entry, Confirmation 2 Entry, 1-Candle Confirmation 2 Entry, or Pullback entry triggered previously
2. Baseline hasn't crossed since entry signal trigger
4. Confirmation 1 agrees
5. Baseline agrees
6. Confirmation 2 agrees
Adaptive Timber! Indicator (ATI)The Adaptive Timber! Indicator (ATI) is a powerful tool designed to identify potential overbought conditions and generate reversal signals in financial markets. It combines multiple technical indicators and market conditions to provide a comprehensive assessment of the likelihood of a price reversal.
How it works:
The ATI uses a combination of the Relative Strength Index (RSI), Moving Average Convergence Divergence (MACD), momentum, and volume to detect overbought conditions and potential reversals. The indicator adapts to the current timeframe, adjusting its parameters accordingly to provide more accurate signals.
Key components:
RSI: The ATI uses the RSI to determine overbought conditions. When the RSI exceeds a specified reversal threshold, it indicates a potential overbought state.
MACD: The indicator monitors the MACD line and signal line to identify moments when they are close to crossing, suggesting a potential trend reversal.
Momentum: The ATI checks if the momentum is increasing, providing confirmation of a potential reversal.
Volume: It analyzes volume to confirm the strength of the reversal signal. A decrease in volume along with overbought conditions adds confidence to the reversal indication.
Timeframe Adaptability: The indicator automatically adjusts its parameters based on the current timeframe, ensuring optimal performance across different time horizons.
How to use:
When the ATI identifies a potential reversal, it displays a colored triangle above the price bars. The color of the triangle represents the strength of the reversal signal: red for a strong signal, orange for a moderate signal, and yellow for a weak signal. Additionally, the indicator plots purple triangles below the price bars as an early warning signal for potential trend reversals.
Traders can use these visual cues along with other technical analysis techniques and risk management strategies to make informed trading decisions. The ATI can be particularly useful for identifying potential short-selling opportunities or for determining exit points in existing long positions.
Creators:
The Adaptive Timber! Indicator (ATI) is the result of a collaborative effort led by Claude , an AI assistant with expertise in financial analysis and programming. The development of the ATI was made possible through the valuable contributions and insights from GPT4 , an advanced language model, Clay , a skilled trader, and Pi AI , Clay's trading assistant.
Claude played a crucial role in designing and implementing the indicator's algorithm, ensuring its robustness and adaptability across different timeframes. GPT4 provided guidance and suggestions for refining the indicator's logic and optimizing its performance. Clay and Pi AI offered their trading expertise and real-world experience to help shape the indicator's functionality and usability.
We would like to express our gratitude to all the members of our trading team for their dedication and hard work in bringing the Adaptive Timber! Indicator to life. We wish all traders the best of luck in their trading endeavors and hope that the ATI will be a valuable addition to their technical analysis toolkit, empowering them to make more informed and profitable trading decisions.
MFX Ultimate Scalper [Mohs Mayfair]MFX Ultimate Scalper is an all-in-one indicator that incorporates 5+ unique components designed for interoperability & confluence with one another to provide a powerful trend following & reversal detection experience.
Users can create various ways to utilize the indicator's features together such as looking for periods of price exhaustion in the market alongside strong reversal signals appearing or getting real-time divergence signals alongside a shift in volume with the volume overlay setting in the market to predict upcoming trends.
The indicator's confirmation feature integrates customizable moving averages and the Volume Weighted Average Price (VWAP), providing additional layers of insight. Traders can fine-tune moving averages to track trend reversals and retracements with precision, while the VWAP offers valuable insights into price and volume dynamics, aiding in the assessment of market sentiment and trends.
This indicator is described as an ”Ultimate Scalper” as it's made up of many different components that can create a systematic approach to analyzing markets alone, however, the indicator also can serve as a great secondary piece to a user's primary analysis.
⨭ FEATURES
Below we describe each component of MFX Ultimate Scalper in order of each's significance for the most confluent analysis possible.
➟ Heat Zones - indicating the relative intensity of price movement, with widening zones suggesting increased volatility and potential trading opportunities.
➟ Exhaustion Signals - Small triangles on the upper or lower heat band zones represent high frequency points that indicate possible reversals or a warning signal to upcoming larger reversal signals. Discerning instances of heightened buying or selling pressure, delineating zones of market saturation and depletion using the historical strength or weakness of a stock or market based on the closing prices of a recent trading period.
➟ Reversal Signals - Kalman filter and Hull trend indicators can reveal trend reversals by dynamically adapting to market conditions and providing timely signals based on smoothed price movements.
➟ Volume Overlay - Upon calculating the relative close of candles, this option allows a coloured overlay upon candles to help confirm volume changes in the market. When price of a closed candle is greater than then open price, the bar will print with a green overlay,
Generally, we recommend using these features in order from first to last, however it is always most productive to ensure you find further confluence alongside any signal that is generated using general market structure and analysis (such as drawing independent supply and demand zones for eg).
⨭ USAGE GUIDE
In the images below, we can see 3 points of interest to a user analyzing MFX Ultimate Scalper based on various different behaviors.
In the circled areas of interest price moves into a one of the heat zones and begins to print a small green or red triangle either above or below the candlestick structure - green = looking for buys and a possible bullish reversal & red = looking for sells and a possible bearish reversal.
As price begins to print these pre reversal points of exhaustion within these heat zones we can begin looking at the market.
This can be used independently or when wanting to perhaps increase the amount of confirmations we can look to apply the reversal confirmation setting, as per below:
What makes this signal particularly more of interest opposed to other reversal signals without the confirmation toggle applied that may not play out right away is the Kalman filter and Hull trend indicator begins to show a clear trend reversal. We can see that it may print the BUY or SELL label a few candles after the initial Small triangles in the upper or lower heat band zones however can be used as a more conservative point of trade entry.
This is a great example above showing how the momentum indicator that measures the magnitude of recent price changes to analyze overbought or oversold conditions (red and green triangles in the heat zone bands) can sometimes print multiple entries. We suggest that if you are looking to increase the accuracy of the signals we found moving to a higher time frame after more than 3 of these indicators have printed, helps.
It is a great indication that price may be looking to reverse and the pressure occurring and that the market could easily reverse in these conditions.
The candles that follow with the confirmation toggle setting means that you could move into a position a little later into the new trend reversal or retracement but also ensures that there is an extra level of confirmation that one is beginning or has begun.
The volume overlay setting is a fantastic tool to use when wanting to confirm your entries for trade and print a clear example in volume shift in the market - the greater the green candle, the greater the buying momentum. The greater the red candle, the greater the selling momentum,
This analysis combined gave us a further indication of a larger reversal which played out with no lag at all as all reversal signals are predictive separate from the Volume Overlay itself, which can be used as a further trend following approach alongside signals & custom hull trend alongside specific moving average confirmations.
In the image above we can see 3 possible setups and 3 different ways each using individual options.
Working left to right, the first setup adheres to:
➟PRICE IN THE BUY ZONE
➟GREEN BUY TRIANGLE REVERSAL
➟GREEN CANDLE VOLUME CHANGE
➟NO BLUE TREND LABEL CONFIRMATION
When scalping a position using the above signals we would aim for 10-15 pips which we can see here, with no drawdown was able to close and hit our suggested take profit within approximately an hour even though the confirmation trend reversal did not print on the chart
Setup two is another BUY signal and adheres to:
➟PRICE IN THE BUY ZONE
➟GREEN BUY TRIANGLE PRINTED
➟BLUE CONFIRMATION PRINTED
➟WAIT FOR THE NEXT CANDLE TO CLOSE
➟TAKE A BUY
This time we have a clear price exhaustion with the candles closing within the heat zones, just the first buy zone. The confirmation reversal trend prints soon after and although we do not have any confirmation on the volume change overlay we can infer that given they were printed very shortly prior to this confirmation and the preliminary Scalpers green triangles had also shown, the trade confirmation is still valid.
You could perhaps place your stop loss at the base of the reversal blue buy label and then set a 1:2 ratio or perhaps simply stick to the 10-15 pips.
With our final example the confirmations are:
➟PRICE IN THE SELL ZONE
➟RED SELL TRIANGLE REVERSAL
➟THE RED TREND CONFIRMATION LABEL
WAS TOO MANY CANDLES AWAY
TO CONSIDER THE TRADE
The volume indicator printing over an engulfing bearish candle whilst also being within our heat zone exhaustion sell area shows a shift in volume and momentum - as calculated, the open price of the candle is greater than that of the closed previous one thus showing RED overlay of the candle.
In order to better experience the volume overlay option we suggest changing your settings on tradingview by clicking the chart screen settings > symbol and changing the body and wicks of the candlesticks to grey.
We can potentially determine at certain points when to 'filter out' reversal signals or to just consider them merely indications of local tops/bottoms opposed to significant tops/bottoms.
Analyzing the reversal confirmation option is useful to consider a trend potentially coming to an end. We recommend studying the outlined chart above & the list of indications at each shaded area to develop a deep understanding of how to navigate varying market conditions & spot various points of confluence during reversals.
⨭CONCLUSION & ACCESS
This indicator is an extremely comprehensive approach to a variety of volume and volatility based tools predominantly that allows users to further develop a systematic approach to trading and can be paired alongside other forms of technical analysis.
Although we believe this indicator to be useful, it's critical to understand that past performance is not necessarily indicative of future results and there are many more factors that go into being a profitable trader.
You can see the Author's instructions below to get instant access to MFX Ultimate Scalper by Mohs Mayfair

Trend Signals with TP & SL [UAlgo]The "Trend Signals with TP & SL " indicator is a versatile tool designed to assist traders in identifying potential trend continuation opportunities within financial markets Utilizing a combination of technical indicators and user-defined parameters, this indicator aims to provide clear and actionable signals to aid traders in making informed trading decisions.
🔶 Features:
Trend Continuation Signals : The indicator generates signals to identify potential trend continuation points based on the input parameters such as sensitivity, ATR length, and cloud moving average length.
Take-Profit and Stop-Loss Levels: It calculates and plots three levels of take-profit (1R, 2R, 3R) and stop-loss levels based on the entry price of the trade.
Short Position Example:
Long Position Example:
Visualization: The script visualizes the trend signals, entry points, take-profit levels, and stop-loss levels on the price chart, making it easier for traders to interpret the signals.
Alert System: The indicator includes an alert system that notifies the user when there is a change in trend direction or when a buy/sell signal is generated. The alerts provide essential information such as entry price, take-profit levels, and stop-loss levels.
🔶 Calculations :
Trend Calculation: Trend signals are determined based on the comparison between the current closing price and the upper and lower bounds calculated using the Average True Range (ATR) multiplied by a sensitivity factor. A trend is considered bullish if the closing price is above the upper bound and bearish if it's below the lower bound.
Entry, Stop Loss, and Take Profit Calculation: Entry points for long and short positions are identified when there's a change in trend direction.
Stop-loss levels are calculated as a percentage of the entry price, where users can define the percentage based on their risk tolerance.
Take-profit levels are calculated as multiples of the stop-loss level (1R, 2R, 3R).
Cloud Moving Averages: Simple moving averages (SMAs) are calculated for high and low prices over a specified period to create a "cloud" visualization on the chart.
MACD Clouds: Moving Average Convergence Divergence (MACD) indicator is used to determine the market's momentum and trend direction. Positive and negative clouds are plotted based on the MACD line and its signal line, indicating potential bullish or bearish trends.
Signal Generation: Buy and sell signals are generated based on specific conditions such as RSI, CMO (Chande Momentum Oscillator), and pivot points.
Signals are triggered when certain criteria are met, indicating potential opportunities for entering or exiting trades.
🔶 Disclaimer:
Use at Your Own Risk: Trading involves significant risk, and this script is provided for educational and informational purposes only. It does not guarantee profitable trades, and users should exercise caution and perform their own analysis before making trading decisions.
Parameter Sensitivity: The effectiveness of the indicator may vary depending on the chosen parameters, market conditions, and timeframe. Users are encouraged to backtest the script thoroughly and adjust the parameters according to their trading preferences.
Not Financial Advice: The information provided by this script should not be considered as financial advice. Users are solely responsible for their trading decisions and should consult with a qualified financial advisor if needed.
Backtesting and Validation: Before implementing this indicator in live trading, users are strongly encouraged to conduct rigorous backtesting and validation to assess its performance under various market conditions. Past performance is not indicative of future results, and users should carefully evaluate the effectiveness of the indicator based on their individual trading preferences and risk tolerance.

Scalper's Volatility Filter [QuantraSystems]Scalpers Volatility Filter
Introduction
The 𝒮𝒸𝒶𝓁𝓅𝑒𝓇'𝓈 𝒱𝑜𝓁𝒶𝓉𝒾𝓁𝒾𝓉𝓎 𝐹𝒾𝓁𝓉𝑒𝓇 (𝒮𝒱𝐹) is a sophisticated technical indicator, designed to increase the profitability of lower timeframe trading.
Due to the inherent decrease in the signal-to-noise ratio when trading on lower timeframes, it is critical to develop analysis methods to inform traders of the optimal market periods to trade - and more importantly, when you shouldn’t trade.
The 𝒮𝒱𝐹 uses a blend of volatility and momentum measurements, to signal the dominant market condition - trending or ranging.
Legend
The 𝒮𝒱𝐹 consists of a signal line that moves above and below a central zero line, serving as the indication of market regime.
When the signal line is positioned above zero, it indicates a period of elevated volatility. These periods are more profitable for trading, as an asset will experience larger price swings, and by design, trend-following indicators will give less false signals.
Conversely, when the signal line moves below zero, a low volatility or mean-reverting market regime dominates.
This distinction is critical for traders in order to align strategies with the prevailing market behaviors - leveraging trends in volatile markets and exercising caution or implementing mean-reversion systems in periods of lower volatility.
Case Study
Here we can see the indicator's unique edge in action.
Out of the four potential long entries seen on the chart - displayed via bar coloring, two would result in losses.
However, with the power of the 𝒮𝒱𝐹 a trader can effectively filter false signals by only entering momentum-trades when the signal line is above zero.
In this small sample of four trades, the 𝒮𝒱𝐹 increased the win rate from 50% to 100%
Methodology
The methodology behind the 𝒮𝒱𝐹 is based upon three components:
By calculating and contrasting two ATR’s, the immediate market momentum relative to the broader, established trend is calculated. The original method for this can be credited to the user @xinolia
A modified and smoothed ADX indicator is calculated to further assess the strength and sustainability of trends.
The ‘Linear Regression Dispersion’ measures price deviations from a fitted regression line, adding further confluence to the signals representation of market conditions.
Together, these components synthesize a robust, balanced view of market conditions, enabling traders to help align strategies with the prevailing market environment, in order to potentially increase expected value and win rates.

Timely Opening Range Breakout Strategy [TORB] (Zeiierman)█ Overview
The Timely Opening Range Breakout (TORB) indicator builds upon the classic Open Range Breakout (ORB) concept. The ORB strategy is a popular trading setup used to identify trades around the opening range of an asset. It's based on the idea that the first few minutes (15-60 minutes) of trading often set the tone for the rest of the day, with breakouts above or below the opening range signifying potential trends.
TORB refines the concept by stating that a trade is only valid if there is sufficient market activity. This means a breakout beyond the upper or lower range is only of interest during the most active trading hours, as defined by PMMV (Per-Minute Mean Volume)
█ How It Works
ORB
The indicator works by first defining a session's opening range based on user-specified settings, including the session's start and end times and the applicable time zone. During this session, it calculates the high and low price points, which form the basis for identifying potential breakout levels.
PMMV
PMMV (Per-Minute Mean Volume) provides a snapshot of the market's activity level at each minute of the trading day. PMMV is calculated by averaging the trading volume in a one-minute interval over a specified number of trading days. This script uses the average volume over the last N periods to determine the PMMV value. This average volume provides a smoother representation of volume activity compared to using a single volume value. It considers the volume over a broader timeframe, filtering out short-term fluctuations and potentially offering a more reliable indicator of underlying market activity.
TORB
TORB works by integrating the Opening Range Breakout (ORB) highs and lows with the Per-Minute Mean Volume (PMMV) metric to assess the validity of breakouts. The objective is to identify breakouts from the opening high and low levels during periods of heightened market activity, as indicated by PMMV.
█ How to Use
To effectively utilize the Timely Opening Range Breakout (TORB) strategy, follow these steps:
Identify Active Hours: Employ PMMV to pinpoint periods of peak activity within the trading day.
Apply Basic ORB Rules: If the price surpasses the upper range (resistance), buy; if it breaches the lower range (support), sell.
Breakouts
The TORB strategy identifies breakout signals when the price moves beyond the established range, supported by volume exceeding a set threshold. This technique aims to eliminate false signals, focusing on price movements during high market activity.
█ Settings
Session
Trading Session: Customize the trading session's start and end times.
Volume
Volume analysis is integral to the TORB strategy, as it uses volume data to confirm the strength and validity of breakout signals.
Period: Sets the number of periods (or bars) to calculate the average volume, which is then used to assess market activity level.
Sensitivity and Significance: Adjusts how responsive the volume analysis is to changes in trading volume. By adjusting the sensitivity, traders can decide how much emphasis to place on volume spikes, potentially reducing false breakouts and focusing on those supported by significant trading activity.
Breakout Threshold
This setting establishes a criterion to identify when the price movement is significant enough.
Threshold: Traders set a threshold level to identify high market activity. If the PMMV is greater than or equal to this threshold, it indicates significant market activity.
Setting the correct threshold is key to balancing sensitivity and specificity. Too low of a threshold may lead to many false positives, while too high of a threshold might filter out potentially profitable breakouts. This setting helps in pinpointing when market activity indicates a strong move, thereby aligning trade entries with moments of heightened market momentum.
-----------------
Disclaimer
The information contained in my Scripts/Indicators/Ideas/Algos/Systems does not constitute financial advice or a solicitation to buy or sell any securities of any type. I will not accept liability for any loss or damage, including without limitation any loss of profit, which may arise directly or indirectly from the use of or reliance on such information.
All investments involve risk, and the past performance of a security, industry, sector, market, financial product, trading strategy, backtest, or individual's trading does not guarantee future results or returns. Investors are fully responsible for any investment decisions they make. Such decisions should be based solely on an evaluation of their financial circumstances, investment objectives, risk tolerance, and liquidity needs.
My Scripts/Indicators/Ideas/Algos/Systems are only for educational purposes!