TICK strategy for SPY optionsImportant notes:
1. This strategy is designed for same day SPY option scalping. All profit shown in back testing report is based on Profit/Loss (P/L) estimates from trading options with approximately 6 months of data. By default, it is set to 10 option contracts. By default the initial capital is set to $5000. Pyramiding is set to 3.
2. This strategy works better with non-extended market data.
3. This strategy is mainly developed for SPY trading on 5 min chart, it probably will not be very profitable with other tickers or time frame without tweaking all the parameters first.
4. This strategy will work with QQQ as well, but please adjust the profit multiplier to match the P/L of QQQ options.
How it works:
When trading the indices, many rely on the TICK for market directions. This strategy is a trend following strategy that uses a combination of conditions using the following indicators:
- TICK
- RSI
- VIX volatility index
- EMA
For entries, the conditions are:
1. TICK moving average crossover with a delayed signal line
2. Bullish or bearish RSI signal, RSI > 50 for bullish, < 50 for bearish
3. VIX must be above a certain threshold to take advantage of high market volatility
4. Price must be on top of EMA line for long, and below for short
For exits, there are 3 scenarios:
1. Stop loss set by a percentage of the daily ATR value
2. Trend changes on the TICK and the RSI
3. Bearish or bullish divergence on price with TICK
This strategy automatically signal to close all trades at 3:50 pm EST at the end of the day.
Extras:
- There is an option to show P/L for reinvesting profits
Enjoy~!!! Let's all make $$$
Cerca negli script per "profitable"

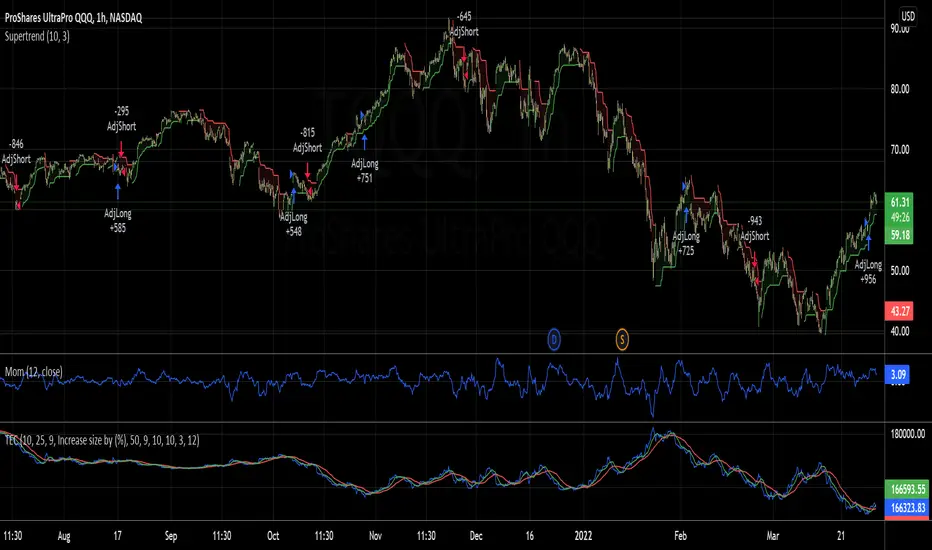
Trading the Equity Curve Position Sizing Example"Trading the equity curve" as a risk management method is the process of acting on trade signals depending on whether a system’s performance is indicating the strategy is in a profitable or losing phase.
The point of managing equity curve is to minimize risk in trading when the equity curve is in a downtrend. This strategy has two modes to determine the equity curve downtrend: By creating two simple moving averages of a portfolio's equity curve - a short-term and a longer-term one - and acting on their crossings. If the fast SMA is below the slow SMA, equity downtrend is detected (smafastequity < smaslowequity).
The second method is by using the crossings of equity itself with the longer-period SMA (equity < smasloweequity).
When Trading with the Equity Curve" is active, the position size will be reduced by a specified percentage if the equity is "under water" according to a selected rule. If you're a risk seeker, select "Increase size by %" - for some robust systems, it could help overcome their small drawdowns quicker.
KINSKI Multi Trend OscillatorThe Multi Trend Oscillator is a tool that combines the ratings of several indicators to facilitate the search for profitable trades. I was inspired by the excellent indicator "Technical Ratings" from Team TradingView to create an alternative with a technically new approach. Therefore, it is not a modified copy of the original, but newly conceived and implemented.
The recommendations of the indicator are based on the calculated ratings from the different indicators included in it. The special thing here is that all settings for the individual indicators can be changed according to your own needs and displayed as a histogram and MA line. This provides an excellent visual control of your own settings. Alarms are also triggered.
Criteria for determining the rating
Relative Strength Index (RSI)
Buy - Crossover oversold level and indicator < oversold level and rising
Sell - Crossunder oversold level and indicator >= oversold level and falling
Neutral - neither Buy nor Sell
Relative Strength Index (RSI) Laguerre
Buy - Crossover Oversold Level and Indicator < Oversold Level and rising
Sell - Crossunder oversold level and indicator >= oversold level and falling
Neutral - neither Buy nor Sell
Noise free Relative Strength Index (RSX)
Buy - Crossover Oversold Level and Indicator < Oversold Level and rising
Sell - Crossunder oversold level and indicator >= oversold level and falling
Neutral - neither Buy nor Sell
Money Flow Index (MFI)
Buy - Crossover Oversold Level and Indicator < Oversold Level and rising
Sell - Crossunder oversold level and indicator >= oversold level and falling
Neutral - neither Buy nor Sell
Commodity Channel Index (CCI)
Buy - Crossover Oversold Level and Indicator < Oversold Level and rising
Sell - Crossunder oversold level and indicator >= oversold level and falling
Neutral - neither Buy nor Sell
Moving Average Convergence/Divergence (MACD)
Buy - values of the main line > values of the signal line and rising
Sell - values of the main line < values of the signal line and falling
Neutral - neither Buy nor Sell
Klinger
Buy - indicator >= 0 and rising
Sell - indicator < 0 and falling
Neutral - neither Buy nor Sell
Average Directional Index (ADX)
Buy - indicator > 20 and +DI line crosses over the -DI line and rising
Sell - indicator > 20 and +DI line crosses below the -DI line and falling
Neutral - neither Buy nor Sell
Awesome Oscillator
Buy - Crossover 0 and values are greater than 0, or exceed the zero line
Sell - Crossunder 0 and values are lower than 0, or fall below the zero line
Neutral - neither Buy nor Sell
Ultimate Oscillator
Buy - Crossover oversold level and indicator < oversold level and rising
Sell - Crossunder oversold level and indicator >= oversold level and falling
Neutral - neither Buy nor Sell
Williams Percent Range
Buy - Crossover Oversold Level and Indicator < Oversold Level and rising
Sell - Crossunder Oversold Level and Indicator >= Oversold Level and falling
Neutral - neither Buy nor Sell
Momentum
Buy - Crossover 0 and indicator levels rising
Sell - Crossunder 0 and indicator values falling
Neutral - neither Buy nor Sell
Total Ratings
The numerical value of the rating "Sell" is 0, "Neutral" is 0 and "Buy" is 1. The total rating is calculated as the average of the ratings of the individual indicators and are determined according to the following criteria:
MaxCount = 12 (depending on whether other oscillators are added).
CompareSellStrong = MaxCount * 0.3
CompareMid = MaxCount * 0.5
CompareBuyStrong = MaxCount * 0.7
value <= CompareSellStrong - Strong Sell
value < CompareMid and value > CompareSellStrong - Sell
value == 6 - Neutral
value > CompareMid and value < CompareBuyStrong - Buy
value >= CompareBuyStrong - Strong Buy
Understanding the results
The Multi Trend Oscillator is designed so that its values fluctuate between 0 and currently 12 (maximum number of integrated indicators). Its values are displayed as a histogram with green, red and gray bars. The bars are gray when the value of the indicator is at half of the number of indicators used, currently 12. Increasingly saturated green bars indicate increasing values above 6, and increasingly saturated red bars indicate increasingly decreasing values below 6.
The table at the end of the histogram shows details (can be activated in the settings) about the overall rating and the individual indicators. Its color is determined by the rating value: gray for neutral, green for buy or strong buy, red for sell or strong sell.
The following alarms are triggered:
Multi Trend Oscillator: Sell
Multi Trend Oscillator: Strong Sell
Multi Trend Oscillator: Buy
Multi Trend Oscillator: Strong Buy

AlphaTrendAlphaTrend is a brand new indicator which I've personally derived from Trend Magic and still developing:
In Magic Trend we had some problems, Alpha Trend tries to solve those problems such as:
1-To minimize stop losses and overcome sideways market conditions.
2-To have more accurate BUY/SELL signals during trending market conditions.
3- To have significant support and resistance levels.
4- To bring together indicators from different categories that are compatible with each other and make a meaningful combination regarding momentum, trend, volatility, volume and trailing stop loss.
according to those purposes Alpha Trend:
1- Acts like a dead indicator like its ancestor Magic Trendin sideways market conditions and doesn't give many false signals.
2- With another line with 2 bars offsetted off the original one Alpha Trend have BUY and SELL signals from their crossovers.
BUY / LONG when Alpha Trend line crosses above its 2 bars offsetted line and there would be a green filling between them
SELL / SHORT when Alpha Trend line crosses below its 2 bars offsetted line and filling would be red then.
3- Alpha Trend lines
-act as support levels when an uptrend occurs trailing 1*ATR (default coefficient) distance from bar's low values
-conversely act as resistancelevels when a downtrend occurs trailing 1*ATR (default coefficient) distance from bar's high values
and acting as trailing stop losses
the more Alpha Trend lines straighter the more supports and resistances become stronger.
4- Trend Magic has CCI in calculation
Alpha Trend has MFI as momentum, but when there's no volume data MFI has 0 values, so there's abutton to change calculation considering RSI after checking the relevant box to overcome this problem when there is no volume data in that chart.
Momentum: RSI and MFI
Trend: Magic Trend
Volatility: ATR,
Trailing STOP: ATR TRAILING STOP
Volume: MFI
Alpha trend is really a combination of different types...
default values:
coefficient: 1 which is the factor of trailing ATR value
common period: 14 which is the length of ATR MFI and RSI
Wish you all use AlphaTrend in profitable trades.
Kıvanç Özbilgiç

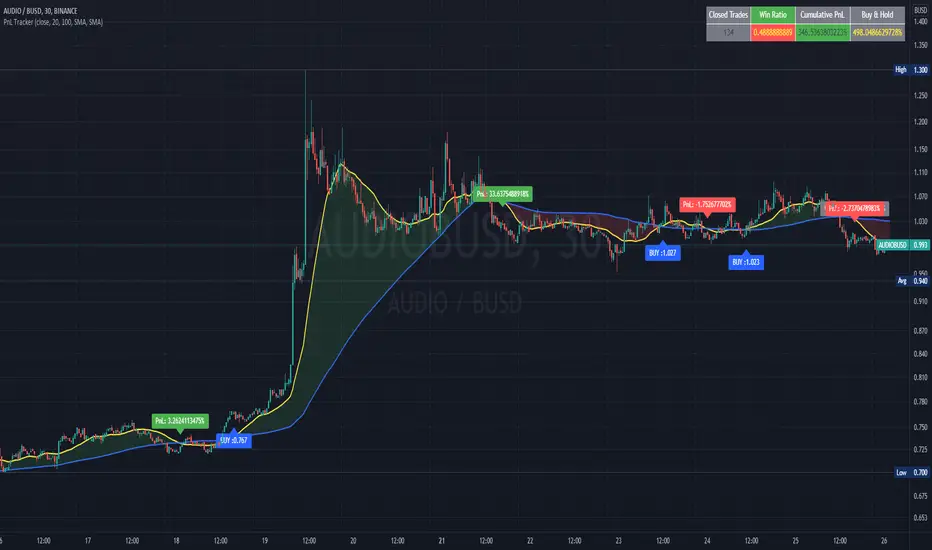
PnL and Buy & Hold TrackerIn this script I use a simple, not necessarily profitable, strategy of a cross of MAs to teach how to calculate and plot the PnL of each trade made by the indicator. I also show how to calculate the cumulative PnL of all trades and the Buy and Hold of the same period.
These calculations which are natively available in any strategy script, require a bit of resourcefulness to work in an indicator script.
It can be very useful to optimize parameters for the best performance of an indicator-based strategy.
I use variables to store the price of the asset at each buy signal to calculate the PnL with the closing price of that particular trade and another variable to store the price value of the first trade, which calculates the Buy and Hold percentage with the current price of the asset.
I plot the values of the trades in labels and the accumulated values in a table.
I also show how to calculate and plot the unrealized PnL of open trades.
Bitcoin Power Law Bands (BTC Power Law) Indicator█ OVERVIEW
The 'Bitcoin Power Law Bands' indicator is a set of three US dollar price trendlines and two price bands for bitcoin , indicating overall long-term trend, support and resistance levels as well as oversold and overbought conditions. The magnitude and growth of the middle (Center) line is determined by double logarithmic (log-log) regression on the entire USD price history of bitcoin . The upper (Resistance) and lower (Support) lines follow the same trajectory but multiplied by respective (fixed) factors. These two lines indicate levels where the price of bitcoin is expected to meet strong long-term resistance or receive strong long-term support. The two bands between the three lines are price levels where bitcoin may be considered overbought or oversold.
All parameters and visuals may be customized by the user as needed.
█ CONCEPTS
Long-term models
Long-term price models have many challenges, the most significant of which is getting the growth curve right overall. No one can predict how a certain market, asset class, or financial instrument will unfold over several decades. In the case of bitcoin , price history is very limited and extremely volatile, and this further complicates the situation. Fortunately for us, a few smart people already had some bright ideas that seem to have stood the test of time.
Power law
The so-called power law is the only long-term bitcoin price model that has a chance of survival for the years ahead. The idea behind the power law is very simple: over time, the rapid (exponential) initial growth cannot possibly be sustained (see The seduction of the exponential curve for a fun take on this). Year-on-year returns, therefore, must decrease over time, which leads us to the concept of diminishing returns and the power law. In this context, the power law translates to linear growth on a chart with both its axes scaled logarithmically. This is called the log-log chart (as opposed to the semilog chart you see above, on which only one of the axes - price - is logarithmic).
Log-log regression
When both price and time are scaled logarithmically, the power law leads to a linear relationship between them. This in turn allows us to apply linear regression techniques, which will find the best-fitting straight line to the data points in question. The result of performing this log-log regression (i.e. linear regression on a log-log scaled dataset) is two parameters: slope (m) and intercept (b). These parameters fully describe the relationship between price and time as follows: log(P) = m * log(T) + b, where P is price and T is time. Price is measured in US dollars , and Time is counted as the number of days elapsed since bitcoin 's genesis block.
DPC model
The final piece of our puzzle is the Dynamic Power Cycle (DPC) price model of bitcoin . DPC is a long-term cyclic model that uses the power law as its foundation, to which a periodic component stemming from the block subsidy halving cycle is applied dynamically. The regression parameters of this model are re-calculated daily to ensure longevity. For the 'Bitcoin Power Law Bands' indicator, the slope and intercept parameters were calculated on publication date (March 6, 2022). The slope of the Resistance Line is the same as that of the Center Line; its intercept was determined by fitting the line onto the Nov 2021 cycle peak. The slope of the Support Line is the same as that of the Center Line; its intercept was determined by fitting the line onto the Dec 2018 trough of the previous cycle. Please see the Limitations section below on the implications of a static model.
█ FEATURES
Inputs
• Parameters
• Center Intercept (b) and Slope (m): These log-log regression parameters control the behavior of the grey line in the middle
• Resistance Intercept (b) and Slope (m): These log-log regression parameters control the behavior of the red line at the top
• Support Intercept (b) and Slope (m): These log-log regression parameters control the behavior of the green line at the bottom
• Controls
• Plot Line Fill: N/A
• Plot Opportunity Label: Controls the display of current price level relative to the Center, Resistance and Support Lines
Style
• Visuals
• Center: Control, color, opacity, thickness, price line control and line style of the Center Line
• Resistance: Control, color, opacity, thickness, price line control and line style of the Resistance Line
• Support: Control, color, opacity, thickness, price line control and line style of the Support Line
• Plots Background: Control, color and opacity of the Upper Band
• Plots Background: Control, color and opacity of the Lower Band
• Labels: N/A
• Output
• Labels on price scale: Controls the display of current Center, Resistance and Support Line values on the price scale
• Values in status line: Controls the display of current Center, Resistance and Support Line values in the indicator's status line
█ HOW TO USE
The indicator includes three price lines:
• The grey Center Line in the middle shows the overall long-term bitcoin USD price trend
• The red Resistance Line at the top is an indication of where the bitcoin USD price is expected to meet strong long-term resistance
• The green Support Line at the bottom is an indication of where the bitcoin USD price is expected to receive strong long-term support
These lines envelope two price bands:
• The red Upper Band between the Center and Resistance Lines is an area where bitcoin is considered overbought (i.e. too expensive)
• The green Lower Band between the Support and Center Lines is an area where bitcoin is considered oversold (i.e. too cheap)
The power law model assumes that the price of bitcoin will fluctuate around the Center Line, by meeting resistance at the Resistance Line and finding support at the Support Line. When the current price is well below the Center Line (i.e. well into the green Lower Band), bitcoin is considered too cheap (oversold). When the current price is well above the Center Line (i.e. well into the red Upper Band), bitcoin is considered too expensive (overbought). This idea alone is not sufficient for profitable trading, but, when combined with other factors, it could guide the user's decision-making process in the right direction.
█ LIMITATIONS
The indicator is based on a static model, and for this reason it will gradually lose its usefulness. The Center Line is the most durable of the three lines since the long-term growth trend of bitcoin seems to deviate little from the power law. However, how far price extends above and below this line will change with every halving cycle (as can be seen for past cycles). Periodic updates will be needed to keep the indicator relevant. The user is invited to adjust the slope and intercept parameters manually between two updates of the indicator.
█ RAMBLINGS
The 'Bitcoin Power Law Bands' indicator is a useful tool for users wishing to place bitcoin in a macro context. As described above, the price level relative to the three lines is a rough indication of whether bitcoin is over- or undervalued. Users wishing to gain more insight into bitcoin price trends may follow the author's periodic updates of the DPC model (contact information below).
█ NOTES
The author regularly posts on Twitter using the @DeFi_initiate handle.
█ THANKS
Many thanks to the following individuals, who - one way or another - made the 'Bitcoin Power Law Bands' indicator possible:
• TradingView user 'capriole_charles', whose open-source 'Bitcoin Power Law Corridor' script was the basis for this indicator
• Harold Christopher Burger, whose Bitcoin’s natural long-term power-law corridor of growth article (2019) was the basis for the 'Bitcoin Power Law Corridor' script
• Bitcoin Forum user "Trololo", who posted the original power law model at Logarithmic (non-linear) regression - Bitcoin estimated value (2014)

Honey CypherHoney Cypher Aims to do 4 things
Momentum
Trend Strength
Overbought and oversold zones
Being the most beautiful indicator you ever see
Momentum
The big yellow honey waves primary use is to see the momentum of the market, they can be used in a similar way you would use a MACD or Chaikin Money Flow
On this image you see the honey waves being plotted to the 30 minute timeframe while on the 5 minute chart to have an understanding of longer time momentum in the chart.
Trend Strength
Most tools of the indicator can be used for that but the yellow and purple slope strength lines are made specificaly for this. When you see them curl down you know trend is strengthening towards the downside.
The candle color is based on the amount of Honey waves sloping in one direction. This might be the best tool in the indicator to find Trend Strength. Bright yellow candles mean strong bears while the bright blue candles mean strong bulls.
Overbought and oversold zones
By analysing the waves on a chart you start to learn how big waves can get before a reversal or consolidation period arrives.
You can become profitable with the indicator. But to be honest, my primary focus in making this indicator was find ways to visualise alot of data in a clear and beautiful way.
You should use the indicator with some out of the box ideas instead of just trusting the signals.
examples:
Find a head and shoulders pattern on the top of a huge honey wave.
Find a bottom small wave while the others honey waves are in the opposite direction for entering a pullback.
Use the honey for direction but the yellow and purple slope line crosses for entrys.
Comment your own strategys, I made this open source to be able to get community feedback.
The Honey Cypher waves are calculated in a similar way as the MACD histogram. I've combined MACD formula with some of the lazybear formula. It looks for the distance between 2 moving averages to find trend strength. After that the end results get's smoothed out. It is very satisfying to change that as you can see the honey waves create a melting like motion on each change of smoothing.
Below a preview of the honey cypher moving average lines, all lines have a length that is based on the fibonacci number sequence. Honey cypher measures the distance between for example length 5-8 averages.
I hope this inspires coders to create very beautiful scripts.

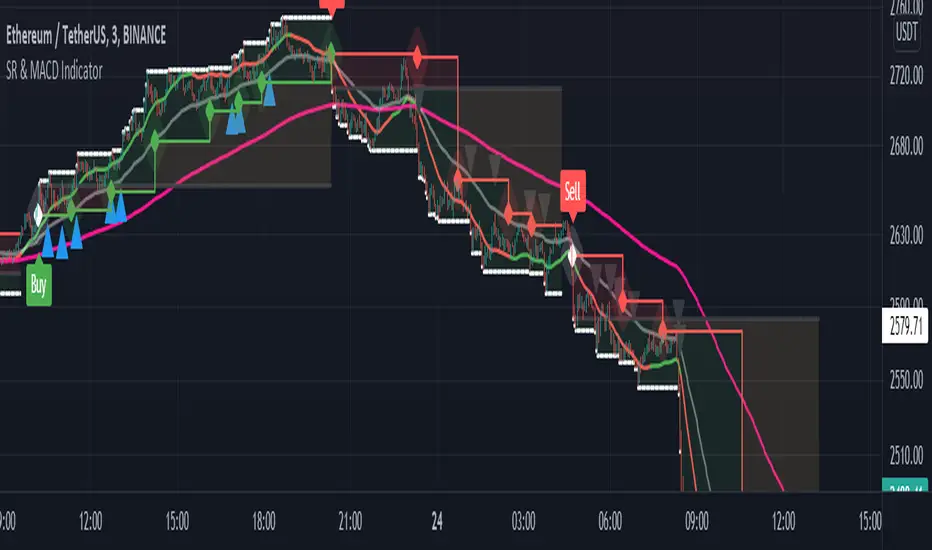
Support and Resistance with MACD IndicatorOriginal script from ©akpaswaniitk. I just added MACD to filter out bad trades and alert function so that we get notified whenever indicator gives us an entry signal. Most of the false breakout has been removed but the remaining ones only pop up during consolidation, so it's wait for the retest before entry. Works better in continuous market. Also look at the color of EMA for further confirmation, only focus on buy side when EMA is green and sell when EMA is red or when after the buy signal EMA changes color from red to green. These are the highly profitable setups I've found with this indicator.
Signals
Red or Green solid line with diamond are trailing stoploses
dotted black line is entry level
dotted white line is optimal exit
STR:EMA Oscilator [Azzrael]Strategy based on EMA and EMA Oscilator
(EMA - close) + Std Dev + Factor = detecting oversell/overbuy
Long only!
Pyramiding - sometimes, depends on ...
There're 2 enter strategies in one script:
1 - Classic, buy on entering to OverSell zone (more profitable ~> 70%)
2 - Crazy, buy on entering to OverBuy zone (catching trend and pyramiding, more net profit)
Exit - crossing zero of (EMA - close)

TrendsThe Trends indicator is created for trend trading and (Bitsgap) crypto bots of crypto assets over longer time periods.
Works best for 4h, Daily and Weekly candles (even Monthly), but unsuitable for hourly candles and day trading.
This indicator shows you if a crypto pair is in a Bear, Bull or Sideways market.
The idea is to simplify decision making when to sell or buy, or what pairs to use with trading bots.
Stick to the rule of not having bots in a Bear trend!
- Blue = Bull trend
- Red = Bear trend
- Green = Sideways trend - which can be profitable with trading bots

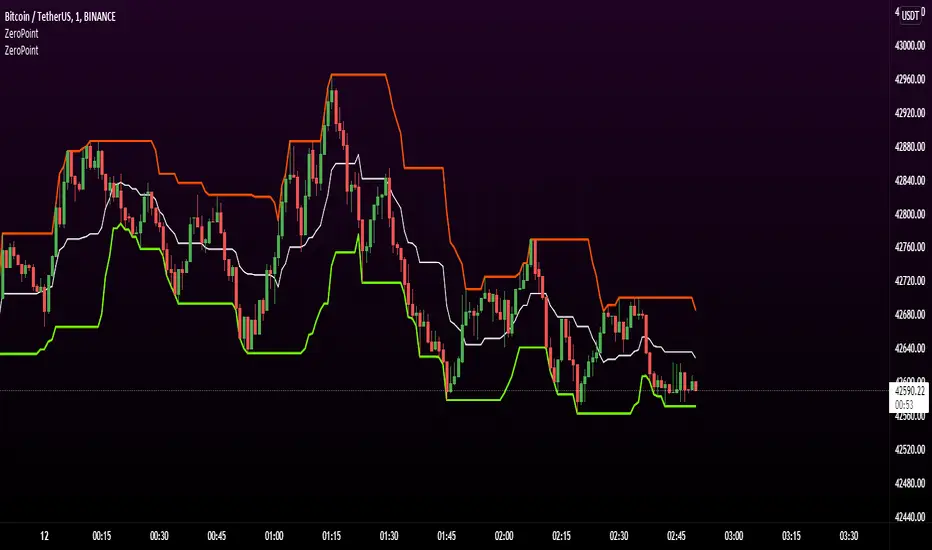
Price Clouds Oscillator (PCO)This is the oscillator version of Price Clouds (PS). Use this with (PS) for best results.
This indicator shows you over bought and over sold regions similarly to to rsi or stochastic. This indicator centers a moving average around the hl2 of the price. This is calculated as the difference of four moving averages. The signal line shows you how much momentum in any given direction you have. You can also see how much volatility there is by the band width. Just like the Bollinger band high volatility comes before low volatility and visa versa. You can also see what the market is doing based on the signal crosses. If the fast line is above the slow line you are going up and visa versa. This indicator works in most markets, especially crypto. There is a tool tip for every aspect of this indicator explaining how everything works.
Key Feature:
>See where the price is relative to a mean price
>Measure volatility
>Clean global settings
>Normalization feature lets you scale the band from 0 to 1. You loose some information but its easier to use if you aren't measuring volatility.
I hope you are very profitable with this one!
If you find this indicator is useful to you, Star it, Follow, Donate, Like and Share.
Your support is a highly motivation for me.
PCO
----------------------/\-----
-------------/\----/----\---
\----------/----\/--------\-
--\------/------------------
----\_/---------------------

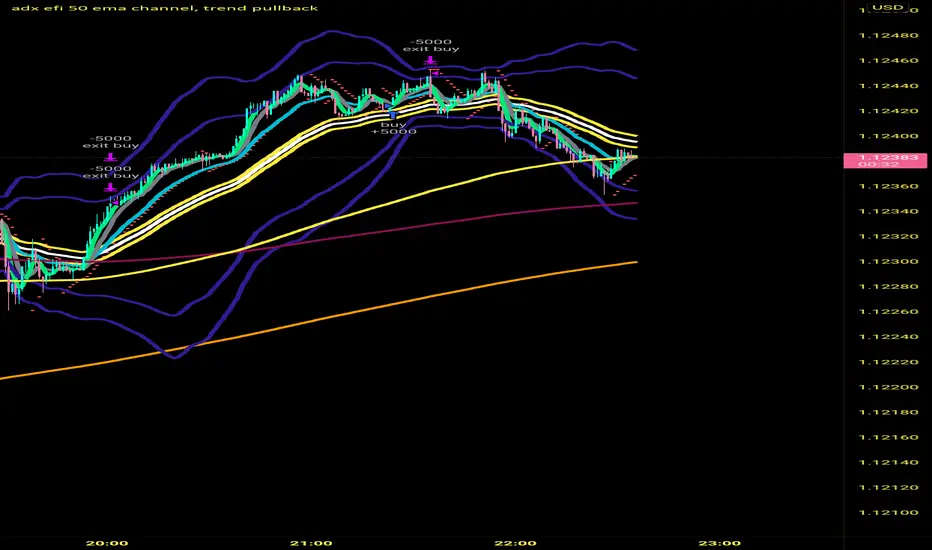
adx efi 50 ema channel, trend pullbackHi so this strategy is based off 50 ema channel and the 15 ma crossing it to generate signals. But with my adjusted strategy it's a 10 rma crossing 50 ema channels and a 5 and 9 wma to help see pullbacks. 50 period bollinger bands to gage volatility a0nd help during range markets. The strategy signals are generated when longer period efi is above 0 and shorter period efi is below zero and price has pulled back near 50 ema to buy long. And the reverse for shorts, I made this to help me trade more mechanically and to trade 1 minute time frame, that's where the strategy seems to Excell the most, I developed it on eur usd but a brief check seems like it still is profitable on gbp usd aud usd usd jpy I only trade the forex market so not sure about stocks and crypto. If you get signals I would place buy stops and sell stops above high and low of respective signal candle and let price take you into trade. Also adx 20 has to be greater than 20 to take trades. Let me know if this is helpful. I've only been coding for a month so it might look sloppy the way it's coded also there are a few other buy and sell conditions left in the source code if you want to switch between different buy and sell triggers, they all produce good results on 1 min timeframe
Linear Regression Relative Strength[image/x/iZvwDWEY/
Relative Strength indicator comparing the current symbol to SPY (or any other benchmark). It may help to pick the right assets to complement the portfolio build around core ETFs such as SPY.
The general idea is to show if the current symbol outperforms or underperforms the benchmark (SPY by default) when bought some certain time ago. Relative performance is displayed as percent and is calculated for three different time ranges - short (1 mo by default), mid (1 quarter), and long (half a year). To smooth the volatility, the script uses linear regression to estimate the trend and takes the start and the end points of the linear regression line to compute the relative strength.
It is important to remember that the script shows the gain relative to SPY (or other selected benchmark), not the asset's gain. Therefore, it may indicate that the asset is profitable, but it still may lose value if SPY is in downtrend.
Therefore, it is crucial to check other indicators before making a decision. In the example above, standard linear regression for one quarter is used to indicate the direction of the trend.

action zone - ATR stop reverse order strategy v0.1 by 9nckACTION ZONE-ATR MOD v0.1 DOCUMENTATION
Overview
This tradingview pine script strategy is mainly created to enrich my coding skill. It is a combination of “CDC-ACTIONZONE” and my personal studies of trading techniques in various sources e.g.book, course or blog. This strategy purposefully built to connect with my automatic trading bot. However, It will be very useful to aid your trading routine by diminishing mental distraction which possibly leads to bad trades.
How does it work?
This strategy will do a basic simple thing that most traders do by creating entry signals on both sides long/short and also set the stop loss. Furthermore, It will also reverse the order (from long to short and vice versa (if long/short conditions are met). Finally, it will recalculate the stop loss/take profit price in every complete bar to increase the chance of winning and limit our loss.
Entry rules(Long/Short)
If you have no open order, an order will be created when a fast EMA crosses(up(long)/down(short) the slow EMA(It’s as simple as that).
If you have an open order, the current order will be (sold if long, covered if short) and the opposite side order will be created.
Exit and Reverse rules(Long/Short)
If fast EMA cross (DOWN(long), UP(short)), the current order will be closed, THE OPPOSITE SIDE ORDER WILL ALSO BE CREATED.
Risk management
FLEX STOP PRICE : initial value will be set at the bar which order created. It is a fast ema (+/-) MIDDLE ATR value.
If MIDDLE ATR value rises, it will be our new stop price.
If MIDDLE ATR value falls, stop price unchanged
If Price OVERBOUGHT(long)/SOLD(short), LOW of that bar will be a new stop price.
Minimum position hold period
In order to eliminate risk of repeatedly open, close orders in sideway trends. Minimum hold period must be passed to start exit our position. However, It always respects stop loss prices. The value refers to the number of bars.
MUST READ!!!
This strategy uses only MARKET ORDER. If you trade with a bot, make sure you choose only enormous market cap tokens.
This strategy is bi-direction strategy. It will work best in the DERIVATIVE market.
It was initially designed to compete in the cryptocurrency market which has very high volume and volatility.
I only use this strategy in 1HR (acceptable change rate, optimum trade frequency)
How (should) we use it?
Choose crypto future pairs (recommend only top 10-15 market volume pairs in Binance, let’s say 1000M+ trade value)
Choose your time frame (1H is strongly recommended)
Setup your portfolio profile (Setting->Properties) such as Initial cap, order size, commission. DO NOT USE CAL ON EVERY TICK IT WILL CAUSE REPAINTING AND YOUR CAPITAL IS BLEEDING !!!
BACKTEST FIRST!! Back test is a combination of art, math and statis(and a bit of luck). You can apply to train and test methods or whatever you are familiar with. In my opinion, your test period should include UPTREND, SIDEWAY, DOWNTREND. Fine tune fast, slow ema first(my best ema length of 1H timeframe around 7-10, 17-22). Try to eliminate fault breakout trade and use other options only necessary. Hopefully we can use automatic optimization on Pine Script soon.
Don’t forget to turn off using a specific backtest date option to start your strategy.A
THIS IS NOT A PERFECT (OR EVEN PROFITABLE) STRATEGY. USE AT YOUR OWN RISK AND TRADE RESPONSIBLY. DYOR DUDE.

RGB Color FiddlerKEEP YOUR COINS FOLKS! I DON'T NEED THEM, DON'T WANT THEM. Many other talented authors on TV deserve them.
INTRODUCTION:
This is my "RGB Color Fiddler", intended as a toy to play with. This colorcator is rated 'E' for every TV member. With this you can quickly generate about 1.67 million potential colors from color.rgb(). While I have a few preferred colors that are ideal for use, this allows you to finely tune colors to anything that pleases your eye on your canvas.
TIPS:
The overlay chart can be peppered with colors of all varieties, so it's necessary to have properly distinguished coloring and contrast separation. If you employ light charts, you can tweak colors to just the right shade you desire on your display. Not all LCDs are created equal, even when color calibrated. With specific discovered colors tailored to your liking, you may uniquely color code ALL of your indicators.
UTILITY:
The input()s in Settings allow up to 4 different colors to tinker with and compare. After selecting focus of an input, you can easily use the up/down keyboard keys to make swift adjustments numerically or with options. The color combos you are creating will be displayed in color hex or a RGB representation within the labels.
Also of great benefit, is the ability to cycle through the currently available plot() styles. Some styles will require you to zoom in closeup to observe their behaviors. There is a few other ways to finagle plot() parameters to also achieve other acrobatic effects that are not demonstrated here. Closer study of plot() parameters in the reference can reveal those. Anyhow, I won't bother you with more elaborate technical jargon, now is the time to fiddle with this toy to your benefit!
CODE REUSE:
Any member has the freedom to use any of the code in this script any way they see fit. It's specifically intended for all. There is absolutely no need for accreditation for any of this code reuse ever, in the present case. Don't worry about, I'm certainly not.
When available time provides itself, I will consider your inquiries, thoughts, and concepts presented below in the comments section, should you have any questions or comments regarding this indicator. When my indicators achieve more prevalent use by TV members , I may implement more ideas when they present themselves as worthy additions. Have a profitable future everyone!

BjCandlePatternsLibrary "BjCandlePatterns"
Patterns is a Japanese candlestick pattern recognition Library for developers. Functions here within detect viable setups in a variety of popular patterns. Please note some patterns are without filters such as comparisons to average candle sizing, or trend detection to allow the author more freedom.
doji(dojiSize, dojiWickSize) Detects "Doji" candle patterns
Parameters:
dojiSize : (float) The relationship of body to candle size (ie. body is 5% of total candle size). Default is 5.0 (5%)
dojiWickSize : (float) Maximum wick size comparative to the opposite wick. (eg. 2 = bottom wick must be less than or equal to 2x the top wick). Default is 2
Returns: (series bool) True when pattern detected
dLab(showLabel, labelColor, textColor) Produces "Doji" identifier label
Parameters:
showLabel : (bool) Shows label when input is true. Default is false
labelColor : (series color) Color of the label border and arrow
textColor : (series color) Text color
Returns: (series label) A label visible at the chart level intended for the title pattern
bullEngulf(maxRejectWick, mustEngulfWick) Detects "Bullish Engulfing" candle patterns
Parameters:
maxRejectWick : (float) Maximum rejection wick size.
The maximum wick size as a percentge of body size allowable for a top wick on the resolution candle of the pattern. 0.0 disables the filter.
eg. 50 allows a top wick half the size of the body. Default is 0% (Disables wick detection).
mustEngulfWick : (bool) input to only detect setups that close above the high prior effectively engulfing the candle in its entirety. Default is false
Returns: (series bool) True when pattern detected
bewLab(showLabel, labelColor, textColor) Produces "Bullish Engulfing" identifier label
Parameters:
showLabel : (bool) Shows label when input is true. Default is false
labelColor : (series color) Color of the label border and arrow
textColor : (series color) Text color
Returns: (series label) A label visible at the chart level intended for the title pattern
bearEngulf(maxRejectWick, mustEngulfWick) Detects "Bearish Engulfing" candle patterns
Parameters:
maxRejectWick : (float) Maximum rejection wick size.
The maximum wick size as a percentge of body size allowable for a bottom wick on the resolution candle of the pattern. 0.0 disables the filter.
eg. 50 allows a botom wick half the size of the body. Default is 0% (Disables wick detection).
mustEngulfWick : (bool) Input to only detect setups that close below the low prior effectively engulfing the candle in its entirety. Default is false
Returns: (series bool) True when pattern detected
bebLab(showLabel, labelColor, textColor) Produces "Bearish Engulfing" identifier label
Parameters:
showLabel : (bool) Shows label when input is true. Default is false
labelColor : (series color) Color of the label border and arrow
textColor : (series color) Text color
Returns: (series label) A label visible at the chart level intended for the title pattern
hammer(ratio, shadowPercent) Detects "Hammer" candle patterns
Parameters:
ratio : (float) The relationship of body to candle size (ie. body is 33% of total candle size). Default is 33%.
shadowPercent : (float) The maximum allowable top wick size as a percentage of body size. Default is 5%.
Returns: (series bool) True when pattern detected
hLab(showLabel, labelColor, textColor) Produces "Hammer" identifier label
Parameters:
showLabel : (bool) Shows label when input is true. Default is false
labelColor : (series color) Color of the label border and arrow
textColor : (series color) Text color
Returns: (series label) A label visible at the chart level intended for the title pattern
star(ratio, shadowPercent) Detects "Star" candle patterns
Parameters:
ratio : (float) The relationship of body to candle size (ie. body is 33% of total candle size). Default is 33%.
shadowPercent : (float) The maximum allowable bottom wick size as a percentage of body size. Default is 5%.
Returns: (series bool) True when pattern detected
ssLab(showLabel, labelColor, textColor) Produces "Star" identifier label
Parameters:
showLabel : (bool) Shows label when input is true. Default is false
labelColor : (series color) Color of the label border and arrow
textColor : (series color) Text color
Returns: (series label) A label visible at the chart level intended for the title pattern
dragonflyDoji() Detects "Dragonfly Doji" candle patterns
Returns: (series bool) True when pattern detected
ddLab(showLabel, labelColor) Produces "Dragonfly Doji" identifier label
Parameters:
showLabel : (bool) Shows label when input is true. Default is false
labelColor : (series color) Color of the label border and arrow
Returns: (series label) A label visible at the chart level intended for the title pattern
gravestoneDoji() Detects "Gravestone Doji" candle patterns
Returns: (series bool) True when pattern detected
gdLab(showLabel, labelColor, textColor) Produces "Gravestone Doji" identifier label
Parameters:
showLabel : (bool) Shows label when input is true. Default is false
labelColor : (series color) Color of the label border and arrow
textColor : (series color) Text color
Returns: (series label) A label visible at the chart level intended for the title pattern
tweezerBottom(closeUpperHalf) Detects "Tweezer Bottom" candle patterns
Parameters:
closeUpperHalf : (bool) input to only detect setups that close above the mid-point of the candle prior increasing its bullish tendancy. Default is false
Returns: (series bool) True when pattern detected
tbLab(showLabel, labelColor, textColor) Produces "Tweezer Bottom" identifier label
Parameters:
showLabel : (bool) Shows label when input is true. Default is false
labelColor : (series color) Color of the label border and arrow
textColor : (series color) Text color
Returns: (series label) A label visible at the chart level intended for the title pattern
tweezerTop(closeLowerHalf) Detects "TweezerTop" candle patterns
Parameters:
closeLowerHalf : (bool) input to only detect setups that close below the mid-point of the candle prior increasing its bearish tendancy. Default is false
Returns: (series bool) True when pattern detected
ttLab(showLabel, labelColor, textColor) Produces "TweezerTop" identifier label
Parameters:
showLabel : (bool) Shows label when input is true. Default is false
labelColor : (series color) Color of the label border and arrow
textColor : (series color) Text color
Returns: (series label) A label visible at the chart level intended for the title pattern
spinningTopBull(wickSize) Detects "Bullish Spinning Top" candle patterns
Parameters:
wickSize : (float) input to adjust detection of the size of the top wick/ bottom wick as a percent of total candle size. Default is 34%, which ensures the wicks are both larger than the body.
Returns: (series bool) True when pattern detected
stwLab(showLabel, labelColor, textColor) Produces "Bullish Spinning Top" identifier label
Parameters:
showLabel : (bool) Shows label when input is true. Default is false
labelColor : (series color) Color of the label border and arrow
textColor : (series color) Text color
Returns: (series label) A label visible at the chart level intended for the title pattern
spinningTopBear(wickSize) Detects "Bearish Spinning Top" candle patterns
Parameters:
wickSize : (float) input to adjust detection of the size of the top wick/ bottom wick as a percent of total candle size. Default is 34%, which ensures the wicks are both larger than the body.
Returns: (series bool) True when pattern detected
stbLab(showLabel, labelColor, textColor) Produces "Bearish Spinning Top" identifier label
Parameters:
showLabel : (bool) Shows label when input is true. Default is false
labelColor : (series color) Color of the label border and arrow
textColor : (series color) Text color
Returns: (series label) A label visible at the chart level intended for the title pattern
spinningTop(wickSize) Detects "Spinning Top" candle patterns
Parameters:
wickSize : (float) input to adjust detection of the size of the top wick/ bottom wick as a percent of total candle size. Default is 34%, which ensures the wicks are both larger than the body.
Returns: (series bool) True when pattern detected
stLab(showLabel, labelColor, textColor) Produces "Spinning Top" identifier label
Parameters:
showLabel : (bool) Shows label when input is true. Default is false
labelColor : (series color) Color of the label border and arrow
textColor : (series color) Text color
Returns: (series label) A label visible at the chart level intended for the title pattern
morningStar() Detects "Bullish Morning Star" candle patterns
Returns: (series bool) True when pattern detected
msLab(showLabel, labelColor, textColor) Produces "Bullish Morning Star" identifier label
Parameters:
showLabel : (bool) Shows label when input is true. Default is false
labelColor : (series color) Color of the label border and arrow
textColor : (series color) Text color
Returns: (series label) A label visible at the chart level intended for the title pattern
eveningStar() Detects "Bearish Evening Star" candle patterns
Returns: (series bool) True when pattern detected
esLab(showLabel, labelColor, textColor) Produces "Bearish Evening Star" identifier label
Parameters:
showLabel : (bool) Shows label when input is true. Default is false
labelColor : (series color) Color of the label border and arrow
textColor : (series color) Text color
Returns: (series label) A label visible at the chart level intended for the title pattern
haramiBull() Detects "Bullish Harami" candle patterns
Returns: (series bool) True when pattern detected
hwLab(showLabel, labelColor, textColor) Produces "Bullish Harami" identifier label
Parameters:
showLabel : (bool) Shows label when input is true. Default is false
labelColor : (series color) Color of the label border and arrow
textColor : (series color) Text color
Returns: (series label) A label visible at the chart level intended for the title pattern
haramiBear() Detects "Bearish Harami" candle patterns
Returns: (series bool) True when pattern detected
hbLab(showLabel, labelColor, textColor) Produces "Bearish Harami" identifier label
Parameters:
showLabel : (bool) Shows label when input is true. Default is false
labelColor : (series color) Color of the label border and arrow
textColor : (series color) Text color
Returns: (series label) A label visible at the chart level intended for the title pattern
haramiBullCross() Detects "Bullish Harami Cross" candle patterns
Returns: (series bool) True when pattern detected
hcwLab(showLabel, labelColor, textColor) Produces "Bullish Harami Cross" identifier label
Parameters:
showLabel : (bool) Shows label when input is true. Default is false
labelColor : (series color) Color of the label border and arrow
textColor : (series color) Text color
Returns: (series label) A label visible at the chart level intended for the title pattern
haramiBearCross() Detects "Bearish Harami Cross" candle patterns
Returns: (series bool) True when pattern detected
hcbLab(showLabel, labelColor) Produces "Bearish Harami Cross" identifier label
Parameters:
showLabel : (bool) Shows label when input is true. Default is false
labelColor : (series color) Color of the label border and arrow
Returns: (series label) A label visible at the chart level intended for the title pattern
marubullzu() Detects "Bullish Marubozu" candle patterns
Returns: (series bool) True when pattern detected
mwLab(showLabel, labelColor, textColor) Produces "Bullish Marubozu" identifier label
Parameters:
showLabel : (bool) Shows label when input is true. Default is false
labelColor : (series color) Color of the label border and arrow
textColor : (series color) Text color
Returns: (series label) A label visible at the chart level intended for the title pattern
marubearzu() Detects "Bearish Marubozu" candle patterns
Returns: (series bool) True when pattern detected
mbLab(showLabel, labelColor, textColor) Produces "Bearish Marubozu" identifier label
Parameters:
showLabel : (bool) Shows label when input is true. Default is false
labelColor : (series color) Color of the label border and arrow
textColor : (series color) Text color
Returns: (series label) A label visible at the chart level intended for the title pattern
abandonedBull() Detects "Bullish Abandoned Baby" candle patterns
Returns: (series bool) True when pattern detected
abwLab(showLabel, labelColor, textColor) Produces "Bullish Abandoned Baby" identifier label
Parameters:
showLabel : (bool) Shows label when input is true. Default is false
labelColor : (series color) Color of the label border and arrow
textColor : (series color) Text color
Returns: (series label) A label visible at the chart level intended for the title pattern
abandonedBear() Detects "Bearish Abandoned Baby" candle patterns
Returns: (series bool) True when pattern detected
abbLab(showLabel, labelColor, textColor) Produces "Bearish Abandoned Baby" identifier label
Parameters:
showLabel : (bool) Shows label when input is true. Default is false
labelColor : (series color) Color of the label border and arrow
textColor : (series color) Text color
Returns: (series label) A label visible at the chart level intended for the title pattern
piercing() Detects "Piercing" candle patterns
Returns: (series bool) True when pattern detected
pLab(showLabel, labelColor, textColor) Produces "Piercing" identifier label
Parameters:
showLabel : (bool) Shows label when input is true. Default is false
labelColor : (series color) Color of the label border and arrow
textColor : (series color) Text color
Returns: (series label) A label visible at the chart level intended for the title pattern
darkCloudCover() Detects "Dark Cloud Cover" candle patterns
Returns: (series bool) True when pattern detected
dccLab(showLabel, labelColor, textColor) Produces "Dark Cloud Cover" identifier label
Parameters:
showLabel : (bool) Shows label when input is true. Default is false
labelColor : (series color) Color of the label border and arrow
textColor : (series color) Text color
Returns: (series label) A label visible at the chart level intended for the title pattern
tasukiBull() Detects "Upside Tasuki Gap" candle patterns
Returns: (series bool) True when pattern detected
utgLab(showLabel, labelColor, textColor) Produces "Upside Tasuki Gap" identifier label
Parameters:
showLabel : (bool) Shows label when input is true. Default is false
labelColor : (series color) Color of the label border and arrow
textColor : (series color) Text color
Returns: (series label) A label visible at the chart level intended for the title pattern
tasukiBear() Detects "Downside Tasuki Gap" candle patterns
Returns: (series bool) True when pattern detected
dtgLab(showLabel, labelColor, textColor) Produces "Downside Tasuki Gap" identifier label
Parameters:
showLabel : (bool) Shows label when input is true. Default is false
labelColor : (series color) Color of the label border and arrow
textColor : (series color) Text color
Returns: (series label) A label visible at the chart level intended for the title pattern
risingThree() Detects "Rising Three Methods" candle patterns
Returns: (series bool) True when pattern detected
rtmLab(showLabel, labelColor, textColor) Produces "Rising Three Methods" identifier label
Parameters:
showLabel : (bool) Shows label when input is true. Default is false
labelColor : (series color) Color of the label border and arrow
textColor : (series color) Text color
Returns: (series label) A label visible at the chart level intended for the title pattern
fallingThree() Detects "Falling Three Methods" candle patterns
Returns: (series bool) True when pattern detected
ftmLab(showLabel, labelColor, textColor) Produces "Falling Three Methods" identifier label
Parameters:
showLabel : (bool) Shows label when input is true. Default is false
labelColor : (series color) Color of the label border and arrow
textColor : (series color) Text color
Returns: (series label) A label visible at the chart level intended for the title pattern
risingWindow() Detects "Rising Window" candle patterns
Returns: (series bool) True when pattern detected
rwLab(showLabel, labelColor, textColor) Produces "Rising Window" identifier label
Parameters:
showLabel : (bool) Shows label when input is true. Default is false
labelColor : (series color) Color of the label border and arrow
textColor : (series color) Text color
Returns: (series label) A label visible at the chart level intended for the title pattern
fallingWindow() Detects "Falling Window" candle patterns
Returns: (series bool) True when pattern detected
fwLab(showLabel, labelColor, textColor) Produces "Falling Window" identifier label
Parameters:
showLabel : (bool) Shows label when input is true. Default is false
labelColor : (series color) Color of the label border and arrow
textColor : (series color) Text color
Returns: (series label) A label visible at the chart level intended for the title pattern
kickingBull() Detects "Bullish Kicking" candle patterns
Returns: (series bool) True when pattern detected
kwLab(showLabel, labelColor, textColor) Produces "Bullish Kicking" identifier label
Parameters:
showLabel : (bool) Shows label when input is true. Default is false
labelColor : (series color) Color of the label border and arrow
textColor : (series color) Text color
Returns: (series label) A label visible at the chart level intended for the title pattern
kickingBear() Detects "Bearish Kicking" candle patterns
Returns: (series bool) True when pattern detected
kbLab(showLabel, labelColor, textColor) Produces "Bearish Kicking" identifier label
Parameters:
showLabel : (bool) Shows label when input is true. Default is false
labelColor : (series color) Color of the label border and arrow
textColor : (series color) Text color
Returns: (series label) A label visible at the chart level intended for the title pattern
lls(ratio) Detects "Long Lower Shadow" candle patterns
Parameters:
ratio : (float) A relationship of the lower wick to the overall candle size expressed as a percent. Default is 75%
Returns: (series bool) True when pattern detected
llsLab(showLabel, labelColor, textColor) Produces "Long Lower Shadow" identifier label
Parameters:
showLabel : (bool) Shows label when input is true. Default is false
labelColor : (series color) Color of the label border and arrow
textColor : (series color) Text color
Returns: (series label) A label visible at the chart level intended for the title pattern
lus(ratio) Detects "Long Upper Shadow" candle patterns
Parameters:
ratio : (float) A relationship of the upper wick to the overall candle size expressed as a percent. Default is 75%
Returns: (series bool) True when pattern detected
lusLab(showLabel, labelColor, textColor) Produces "Long Upper Shadow" identifier label
Parameters:
showLabel : (bool) Shows label when input is true. Default is false
labelColor : (series color) Color of the label border and arrow
textColor : (series color) Text color
Returns: (series label) A label visible at the chart level intended for the title pattern
bullNeck() Detects "Bullish On Neck" candle patterns
Returns: (series bool) True when pattern detected
nwLab(showLabel, labelColor, textColor) Produces "Bullish On Neck" identifier label
Parameters:
showLabel : (bool) Shows label when input is true. Default is false
labelColor : (series color) Color of the label border and arrow
textColor : (series color) Text color
Returns: (series label) A label visible at the chart level intended for the title pattern
bearNeck() Detects "Bearish On Neck" candle patterns
Returns: (series bool) True when pattern detected
nbLab(showLabel, labelColor, textColor) Produces "Bearish On Neck" identifier label
Parameters:
showLabel : (bool) Shows label when input is true. Default is false
labelColor : (series color) Color of the label border and arrow
textColor : (series color) Text color
Returns: (series label) A label visible at the chart level intended for the title pattern
soldiers(wickSize) Detects "Three White Soldiers" candle patterns
Parameters:
wickSize : (float) Maximum allowable top wick size throughout pattern expressed as a percent of total candle height. Default is 5%
Returns: (series bool) True when pattern detected
wsLab(showLabel, labelColor, textColor) Produces "Three White Soldiers" identifier label
Parameters:
showLabel : (bool) Shows label when input is true. Default is false
labelColor : (series color) Color of the label border and arrow
textColor : (series color) Text color
Returns: (series label) A label visible at the chart level intended for the title pattern
crows(wickSize) Detects "Three Black Crows" candle patterns
Parameters:
wickSize : (float) Maximum allowable bottom wick size throughout pattern expressed as a percent of total candle height. Default is 5%
Returns: (series bool) True when pattern detected
bcLab(showLabel, labelColor, textColor) Produces "Three Black Crows" identifier label
Parameters:
showLabel : (bool) Shows label when input is true. Default is false
labelColor : (series color) Color of the label border and arrow
textColor : (series color) Text color
Returns: (series label) A label visible at the chart level intended for the title pattern
triStarBull() Detects "Bullish Tri-Star" candle patterns
Returns: (series bool) True when pattern detected
tswLab(showLabel, labelColor, textColor) Produces "Bullish Tri-Star" identifier label
Parameters:
showLabel : (bool) Shows label when input is true. Default is false
labelColor : (series color) Color of the label border and arrow
textColor : (series color) Text color
Returns: (series label) A label visible at the chart level intended for the title pattern
triStarBear() Detects "Bearish Tri-Star" candle patterns
Returns: (series bool) True when pattern detected
tsbLab(showLabel, labelColor, textColor) Produces "Bearish Tri-Star" identifier label
Parameters:
showLabel : (bool) Shows label when input is true. Default is false
labelColor : (series color) Color of the label border and arrow
textColor : (series color) Text color
Returns: (series label) A label visible at the chart level intended for the title pattern
wrap(cond, barsBack, borderColor, bgcolor) Produces a box wrapping the highs and lows over the look back.
Parameters:
cond : (series bool) Condition under which to draw the box.
barsBack : (series int) the number of bars back to begin drawing the box.
borderColor : (series color) Color of the four borders. Optional. The default is color.gray.
bgcolor : (series color) Background color of the box. Optional. The default is color.gray.
Returns: (series box) A box who's top and bottom are above and below the highest and lowest points over the lookback
topWick() returns the top wick size of the current candle
Returns: (series float) A value equivelent to the distance from the top of the candle body to its high
bottomWick() returns the bottom wick size of the current candle
Returns: (series float) A value equivelent to the distance from the bottom of the candle body to its low
body() returns the body size of the current candle
Returns: (series float) A value equivelent to the distance between the top and the bottom of the candle body
highestBody() returns the highest body of the current candle
Returns: (series float) A value equivelent to the highest body, whether it is the open or the close
lowestBody() returns the lowest body of the current candle
Returns: (series float) A value equivelent to the highest body, whether it is the open or the close
barRange() returns the height of the current candle
Returns: (series float) A value equivelent to the distance between the high and the low of the candle
bodyPct() returns the body size as a percent
Returns: (series float) A value equivelent to the percentage of body size to the overall candle size
midBody() returns the price of the mid-point of the candle body
Returns: (series float) A value equivelent to the center point of the distance bewteen the body low and the body high
bodyupGap() returns true if there is a gap up between the real body of the current candle in relation to the candle prior
Returns: (series bool) true if there is a gap up and no overlap in the real bodies of the current candle and the preceding candle
bodydwnGap() returns true if there is a gap down between the real body of the current candle in relation to the candle prior
Returns: (series bool) true if there is a gap down and no overlap in the real bodies of the current candle and the preceding candle
gapUp() returns true if there is a gap down between the real body of the current candle in relation to the candle prior
Returns: (series bool) true if there is a gap down and no overlap in the real bodies of the current candle and the preceding candle
gapDwn() returns true if there is a gap down between the real body of the current candle in relation to the candle prior
Returns: (series bool) true if there is a gap down and no overlap in the real bodies of the current candle and the preceding candle
dojiBody() returns true if the candle body is a doji
Returns: (series bool) true if the candle body is a doji. Defined by a body that is 5% of total candle size

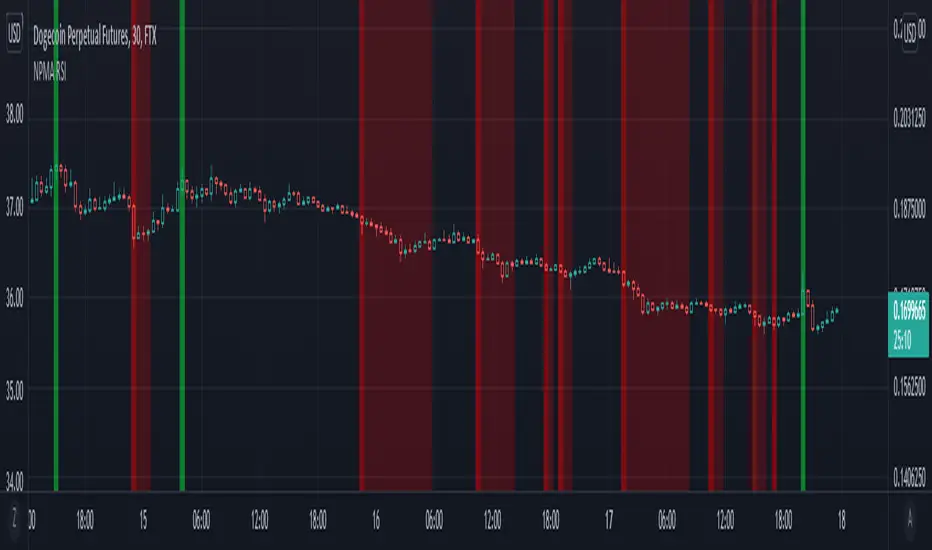
NPMA Relative Strength IndexRecently been amased by the potential of percentile nearest rank. You can apply this to almost any indicator to find extremes, this script might the simplest form of using it while being very powerful. The background will color green when the rsi is in the top percentage ranges of last X amount of bars. I'm currently searching optimal settings to apply this to a simple 3commas bot. Feel free to comment good settings and help the community out making profitable bots.
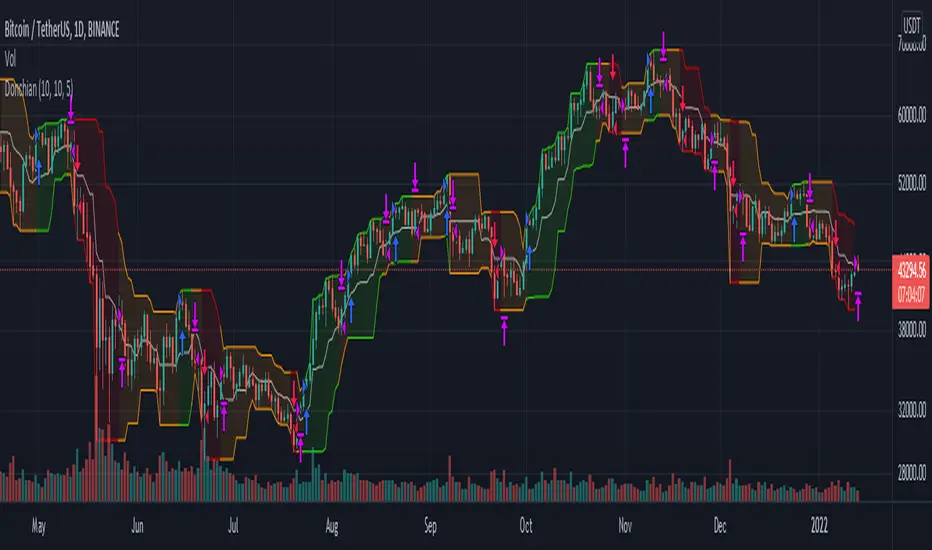
Donchian Channel Strategy IdeaThis strategy idea is a variation of the "Donchian Channel" trading strategy. It is built with a highest-high band, a lowest-low band, and a baseline which is average the highest-high and the lowest-low bands. This strategy is very useful in trending instruments on 1W and 1D timeframes. This is the implementation used in the QuantCT app.
You can set the operation mode to be Long/Short or long-only.
You also can set a fixed stop-loss or ignore it so that the strategy acts solely based on entry and exit signals.
Trade Idea
When the close price breaks up the previous highest-high, it is a long signal, the market is considered rising (bullish), and the plotted indicator becomes green. Long positions are held until the close price crosses under the baseline.
When the close price breaks down the previous lowest-low, it is a short signal, the market is considered falling (bearish), and the plotted indicator becomes red. Short positions are held until the close price crosses above the baseline.
Otherwise, if we have no position in the market, the market is considered ranging, and the plotted indicator becomes orange.
Entry/Exit rules
Enter LONG if the close price breaks up the previous highest-high (i.e. when the plotted indicator becomes green).
Exit LONG if the close price crosses under the baseline (i.e. when the plotted indicator becomes orange).
Enter SHORT if the close price breaks down the previous lowest-low (i.e. when the plotted indicator becomes red).
Exit SHORT if the close price crosses above the baseline (i.e. when the plotted indicator becomes orange).
CAUTION
It's just a bare trading idea - a profitable one. However, you can enhance this idea and turn it into a full trading strategy with enhanced risk/money management and optimizing it, and you ABSOLUTELY should do this!
DON'T insist on using Long/Short mode on all instruments! This strategy performs much better in Long-Only mode on many (NOT All) trending instruments (Like BTC, ETH, etc.).
PSv5 Color Magic and Chart Theme SimulatorKEEP YOUR COINS FOLKS! I DON'T NEED THEM, DON'T WANT THEM. Many other talented authors on TV deserve them.
INTRODUCTION:
This is my "PSv5 Color Magic and Chart Theme Simulator" displayed using Pine Script version 5.0. The purpose of this PSv5 colorcator is to show vivid colors that are most suitable in my opinion for modifying or developing Pine scripts. Whether you are new to Pine or an experienced Pine poet, this should aid you in developing indicators with stunning color from the provided color list that is easily copied and pasted into any novel script you should possess. Whichever colors you choose, and how, is up to your imagination's capacity.
COMMENTARY:
I have a thesis. Pine essentially is a gigantor calculator with a lot of programmable bells and whistles to perform intense analytics. Zillions of numbers per day are blended up into another cornucopia of numbers to analyze. The thing is, ALL of those numbers are moot unless we can informatively portray them in various colorized forms with unique methods to point out significant numeric events. By graphically displaying them with specific modes of operation, only then do these numbers truly make any sense to us and become quantitatively beneficial.
I have to admit... I hate numbers. I never really liked them, even before I knew what an ema() was. Some days I almost can't stand them, and on occasion I feel they deserve to be flushed down the toilet at times. However, I'm a stickler for a proper gauge of measurements. Numbers are a mental burden, but they do have "purpose and meaning". That's where COLOR comes in! By applying color in specific ways in varying dynamic forms, we can generate smarter visual aids from these numerics. Numbers can be "transformed" into something colorful it wasn't before, into a tool, like a hammer. But we don't need a hammer, we need an impressive jack hammer for BIG problem solving that we could never achieve in the not to distant past.
As time goes on, we analytically measure more, and more, and more each year. It's necessary to our continual evolution. That's one significant difference between us and cave men, and the pertinent reason why we are quickly evolving as a species, while animals haven't. Humankind is gifted to enumerate very well AND blessed to see in color. We use it for innumerable things in the technological present for purpose and pleasure. Day in and day out, we take color for granted, because it's every where we can look. The fact is, color is the most important apparatus in humankind's existence EVER. We wouldn't have survived this far without it.
By utilizing color to it's grand potential, greater advancements can be attained while simultaneously being enjoyed visually. Once color is transformed from it's numeric origins into applicable tools, we can enjoy the style, elegance, and QUALITATIVE nature of the indication that can be forged. Quantities can't reveal all. Color on the other hand has a handy "quality" factor to it, often revealing things we can't ordinarily recognize. When high quality tools provide us with obtained goals, that's when we will realize how magical color truly is, always has been, and shall always be.
The future emerging economies and future financial vessels of people around the globe are going to be dependent on the secured construction of intelligent applications with a rock solid color foundation, not just math alone. I have no doubt about that. I can envision that with my eyes closed. To make an informed choice, it should be charted or graphed somehow prior to a final executive decision to trade. Going back to abysmal black and white with double decimal points placed next to cartoons within extinction doomed newspapers is not a viable option any more.
OBSERVATIONS AND UTILITY:
One thing you will notice is the code is very dense. Looks almost hideous right? Well, the variable naming is lengthy, but it's purpose is to be self explanatory, even for those who don't know how to program, YET. I'm simply not a notation enthusiast. My main intention was to provide clearly identifiable variables from their origin of assignment to their intended destination of use, clearly visible for anyone visiting. The empowerment of well versed words that are easier to understand, is a close rival to the prominent influence color has.
Secondly, I'm displaying hline() and label.new() as prime candidates to exemplify by demonstration how the "Power of Color" can be embraced with the "Power of Pine". Color in Pine has been extensively upgraded to serve novel purposes to accomplish next generation indicators that do and WILL come to exist. New functions included with PSv5 are color.rgb(), color.from_gradient(), color.r(), color.g(), color.b(), and color.t() to accompany color.new() in our mutual TV adventures. Keep in mind, the extreme agility of color also extends to line.new(), the "entirely new" linefill.new(), table.new(), bgcolor() and every other function that may utilize color.
There's a wide range of adjustability in Settings to make selections to see how they perform on different backgrounds, with their size and form. As you curiously toy with those, you're going to notice how some jump out like laser beams while others don't. Things that aren't visually appealing, still have very viable purposes, even if they don't stand out in the crowd. Often, that's preferable. The important thing is that when pertinent information relative to indication is crucial, you can program it with distinction from an assortment of a potential 1.67 million colors that can be created in Pine. "These" are my chosen favorite few, and I hope you adopt them.
PURPOSES:
For those of you who are new to Pine Script, this also may help you understand color hex/rgb and how it is utilized in Pine in a most effective manner. The most skilled of programmers can garner perks as well. There is countless examples of code diversity present here that are applicable in other scripts with adequate mutation. Any member has the freedom use any of this code in this script any way they see fit. It's specifically intended for all. There is absolutely no need for accreditation for any of this code reuse ever, in the present case. Don't worry about, I'm not.
The color_tostring() will be most valuable in troubleshooting color when using color.rgb() and becoming adept with it. I'm not going to be able to use color.rgb() without it. Chameleon indicators of the polychromatic variety are most likely going to be fine tuned with color_tostring() divulging it's results to label.new() or even table.new() maybe. One the best virtues of this script in chart, is when you hover over the generated labels, there's a hidden gift for those who truly wish to learn the intricate mechanics of diverse color in Pine. Settings has informative tooltips too.
AFTERTHOUGHTS:
Colors are most vibrant on the "Black Chart" which is the default, but it doesn't currently exist as a chart theme. With the extreme luminous intensity of LCDs in millicandela( mcd ), you may notice "Light" charts may saturate the colors making charts challenging to analyze. Because of this, I personally use "Dark Charts" and design my indicators specifically for these. I hope this provides inspiration for the future developers who are contemplating the creation of next generation indicators and how color may enhance their usefulness.
When available time provides itself, I will consider your inquiries, thoughts, and concepts presented below in the comments section, should you have any questions or comments regarding this indicator. When my indicators achieve more prevalent use by TV members , I may implement more ideas when they present themselves as worthy additions. Have a profitable future everyone!

Scalping 1minMost trustworthy indicator for 1 minutes trader! This indicator is the same as the Bollinger band but much more reliable with extremely on-point signals! a lower line means buy, upper lines mean sell, the middle line is an extremely powerline so trade on the middle line will be mostly profitable!
Synthetic Price Action GeneratorNOTICE:
First thing you need to know, it "DOES NOT" reflect the price of the ticker you will load it on. THIS IS NOT AN INDICATOR FOR TRADING! It's a developer tool solely generating random values that look exactly like the fractals we observe every single day. This script's generated candles are as fake as the never ending garbage news cycles we are often force fed and expected to believe by using carefully scripted narratives peddled as hypnotic truth to psychologically and emotionally influence you to the point of control by coercion and subjugation. I wanted to make the script's synthetic nature very clear using that analogy, it's dynamically artificial. Do not accidentally become disillusioned by this scripts values, make trading decisions from it, and lastly don't become victim to predatory media magic ministry parrots with pretty, handsome smiles, compelling you to board their ferris wheel of fear. Now, on to the good stuff...
BACKSTORY:
Occasionally I find myself in situations where I have to build analyzers in Pine to actually build novel quantitative analytic indicators and tools worthy of future use. These analyzers certainly don't exist on this platform, but usually are required to engineer and tweak algorithms of the highest quality with the finest computational caliber. I have numerous other synthesizers to publish besides this one.
For many reasons, I needed a synthetic environment to utilize the analyzers I built in Pine, to even pursue building some exotic indicators and algorithms. Pine doesn't allow sourcing of tuples. Not to mention, I required numerous Pine advancements to make long held dreams into tangible realities. Many Pine upgrades have arrived and MANY, MANY more are in need of implementation for all. Now that I have this, intending to use it in the future often when in need, you can now use it too. I do anticipate some skilled Pine poets will employ this intended handy utility to design and/or improved indicators for trading.
ORIGIN:
This was inspired by the brilliance from the world renowned ALGOmist John F. Ehlers, but it's taken on a completely alien form from its original DNA. Browsing on the internet for something else, I came across an article with a small code snippet, and I remembered an old wish of mine. I have long known that by flipping back and forth on specific tickers and timeframes in my Watchlist is not the most efficient way to evaluate indicators in multiple theatres of price action. I realized, I always wanted to possess and use this sort of tool, so... I put it into Pine form, but now have decided to inject it with Pine Script steroids. The outcome is highly mutable candle formations in a reusable mutagenic package, observable above and masquerading as genuine looking price candles.
OVERVIEW:
I guess you could call it a price action synthesizer, but I entitled it "Synthetic Price Action Generator" for those who may be searching for such a thing. You may find this more useful on the All or 5Y charts initially to witness indication from beginning (barstate.isfirst === barindex==0) to end (last_bar_index), but you may also use keyboard shortcuts + + to view the earliest plottable bars on any timeframe. I often use that keyboard shortcut to qualify an indicator through the entirety of it's runtime.
A lot can go wrong unexpectedly with indicator initialization, and you will never know it if you don't inspect it. Many recursively endowed Infinite Impulse Response (IIR) Filters can initialize with unintended results that minutely ring in slightly erroneous fashion for the entire runtime, beginning to end, causing deviations from "what should of been..." values with false signals. Looking closely at spg(), you will recognize that 3 EMAs are employed to manage and maintain randomness of CLOSE, HIGH, and LOW. In fact, any indicator's barindex==0 initialization can be inspected with the keyboard shortcuts above. If you see anything obviously strange in an authors indicator, please contact the developer if possible and respectfully notify them.
PURPOSE:
The primary intended application of this script, is to offer developers from advanced to even novice skill levels assistance with building next generation indicators. Mostly, it's purpose is for testing and troubleshooting indicators AND evaluating how they perform in a "manageable" randomized environment. Some times indicators flake out on rare but problematic price fluctuations, and this may help you with finding your issues/errata sooner than later. While the candles upon initial loading look pristine, by tweaking it to the minval/maxval parameters limits OR beyond with a few code modifications, you can generate unusual volatility, for instance... huge wicks. Limits of minval= and maxval= of are by default set to a comfort zone of operation. Massive wicks or candle bodies will undoubtedly affect your indication and often render them useless on tickers that exhibit that behavior, like WGMCF intraday currently.
Copy/paste boundaries are provided for relevant insertion into another script. Paste placement should happen at the very top of a script. Note that by overwriting the close, open, high, etc... values, your compiler will give you generous warnings of "variable shadowing" in abundance, but this is an expected part of applying it to your novel script, no worries. plotcandle() can be copied over too and enabled/disabled in Settings->Style. Always remember to fully remove this scripts' code and those assignments properly before actual trading use of your script occurs, AND specifically when publishing. The entirety of this provided code should never, never exist in a published indicator.
OTHER INTENTIONS:
Even though these are 100% synthetic generated price points, you will notice ALL of the fractal pseudo-patterns that commonly exist in the markets, are naturally occurring with this generator too. You can also swiftly immerse yourself in pattern recognition exercises with increased efficiency in real time by clicking any SPAG Setting in focus and then using the up/down arrow keys. I hope I explained potential uses adequately...
On a personal note, the existence of fractal symmetry often makes me wonder, do we truly live in a totality chaotic universe or is it ordered mathematically for some outcomes to a certain extent. I think both. My observations, it's a pre-deterministic reality completely influenced by infinitesimal amounts of sentient free will with unimaginable existing and emerging quantities. Some how an unknown mysterious mechanism governing the totality of universal physics and mathematics counts this 100.0% flawlessly and perpetually. Anyways, you can't change the past that long existed before your birth or even yesterday, but you can choose to dream, create, and forge the future into your desires and hopes. As always, shite always happens when your not looking for it. What you choose to do after stepping in it unintentionally... is totally up to you. :) Maybe this tool and tips provided will aid you in not stepping in an algo cachucha up to your ankles somehow.
SCRIPTING LESSONS PORTRAYED IN THIS SCRIPT:
Pine etiquette and code cleanliness
Overwrite capabilities of built-in Pine variables for testing indicators
Various techniques to organize Settings panel while providing ease of adjustment utility
Use of tooltip= to provide users adequate valuable information. Most people want to trade with indicators, not blindly make adjustments to them without any knowledge of their intended operation/effects
When available time provides itself, I will consider your inquiries, thoughts, and concepts presented below in the comments section, should you have any questions or comments regarding this indicator. When my indicators achieve more prevalent use by TV members , I may implement more ideas when they present themselves as worthy additions. Have a profitable future everyone!

5min Williams Fractals scalping (3commas)Another strategy I'm learning Pine Script on. It is inspired by a MoneyZG youtube strategy called "Easy 5 Minute Scalping Strategy (Simple to Follow Scalping Trading Strategy)".
Again this is a one order per trade strategy compatible with the 3commas bot (works also with the free 3commas subscription). This strategy is based on the signals from Williams Fractals, taking the signals in reverse - red triangle indicates a bottom and hence we go long. The green triangle indicates a top so we go short. By default these signals are only accepted if they occur between the two Emas. However, you can also turn this off and when a WF signal comes in, only the current price has to be between the Emas. Stop loss is set to the current Ema slow and the take profit is a multiple of the distance to the slow ema.
Like previously I have added different filters as well as the ability to view essential things like the WF signal and Emas. I hope the script will help you to be more successful and if so it would be great if you could share here your setups, or tips on what would be good to refine to make it an even a more profitable strategy. Kind of a community approach so that we help each other out :).
Instructions for the 3commas connector:
1. First, you need to prepare 3commas Long/Short bots that will only listen to custom TV signals.
2. Inputs for the 3commas bot can be found at the end of the user inputs.
3. Once you have entered the required details into the inputs, turn on 3commas comments. They should appear on the chart (looks messy).
4. Now you can add the alert where you should paste the 3commas Webhook URL: 3commas.io
5. For the alert message text insert the placeholder {{strategy.order.comment}} and delete the rest.
6. Once the alert is saved, you can turn off those 3commas comments to have a clearer chart.
7. With a new alert, the bot and trade should launch.
In the near future I would like to publish more scripts that will carry similar elements as the first two, incl. compatibility with 3commas (I don't have access to another bot system). I will choose some strategies myself, but I will also be glad for some tips on what strategy would be good to do and is still missing here on Tradingview (short youtube videos or brief strategy manuals would be great).
Thanks and keep it up
PS: My screen values starting at Long Target Profit and ending at Pullback NOT greater than: 1.5; 1.5; 0; ON; 1; 2; OFF; 17; 36; ON; 0.05; ON; Chart; 14; 46; 50; 48.5; 51; OFF; 1; ON; 4; 2.

Swing Trades Validator - The One TraderThis swing trading strategy validator is built on the original strategy taught in my bootcamp for swing traders.
The strategy is simple and follows a trend trading pattern on prices reacting to Exponential Moving Averages over a multiple time-frame analysis.
The details of the strategy are as follows:
- Holding Period : Upto a couple of months
- Time-frames to be analysed : Month - Week - Day
- Trade Execution : Daily Time-frame
Analysis Details:
Step 1 : On the Monthly time-frame, the candle needs to be bullish with the latest close being higher than the opening price of the month.
Step 2 : The price needs to be above the 8ema on the Monthly time-frame.
Step 3 : The 8ema must be above the 20ema on the Monthly time-frame.
The above steps indicate a bullish strength in the instrument on the Monthly time-frame.
Step 4 : On the Weekly time-frame, the candle needs to be bullish with the latest close being higher than the opening price of the week.
Step 5 : The price needs to be above the 8ema on the Weekly time-frame.
Step 6 : The 8ema must be above the 20ema on the Weekly time-frame.
The above steps indicate a bullish strength in the instrument on the Weekly time-frame.
Step 7 : On the Daily time-frame, the candle needs to be bullish with the latest close being higher than the opening price of the day.
Step 8 : The price needs to be above the 8ema on the Daily time-frame.
Step 9 : The 8ema must be above the 20ema on the Daily time-frame.
The above steps indicate a bullish strength in the instrument on the Daily time-frame.
Step 10 : While the 8ema is above the 20ema on the Daily time-frame, the price must be allowed to rise before a pullback is seen towards the moving averages, indicating a bearish move trying to change the trend.
Step 11 : These pullback candles need to form a pattern called the Ring Low with the second pullback candle having a lower high and lower low and the low of the last pullback candle being lesser than or equal to the fat ema on the Daily time-frame.
Step 12 : If the stock is still bullish and the trend is displaying a strength in the underlying bullish direction, then there will be a resumption candle that will have a closing price higher than the previous day's high price.
This trend continuation signal is a confirmation that the instrument will continue in the underlying trend direction and we will be able to enter if this condition is satisfied.
The profit and loss percentages are set at a default 10% as this can be a minimum risk : reward for swing trades on average, but the inputs have been made available to the users in order to adjust the risk : reward to find the most optimum breathing room for each individual stock or instrument. This will give the user a highly custom overview of the strategy on individual instruments based on their volatility and price movements.
The strategy tester will auto back-test this strategy historically and find all the trades that were taken based on this strategy and populate a performance summary.
The most important data in V1.0 of this script are as follows:
1. No. of Trades Taken : We want to see many trades being taken on this strategy in that particular instrument. This shows us a healthy report on the number of winning vs. losing trades.
2. Percentage Profitable : We want to see that this strategy has worked out in the past and is giving us a high probability of return. This in no way an indication that the strategy will definitely work out in the future as well, but gives us an idea of whether or not we should enter this trade.
3. No. of Winning Trades vs. Losing Trades : We would like to see a significantly higher number of winning trades.
4. Avg. # of bars in a trade : This gives us an idea of how long on average we might have to wait to see the results of this strategy either in favor of our reward or against our desired direction. Some trades can be completed in around 15-20 bars on average and some trades have shown to take upto 45 days to reach desired reward. This is in line with our planned holding period, but gives the trader a sense of time and increased level of patience.
The future updates will have more utility of the various elements of the strategy tester and the entire exit strategy will be integrated into the script.
This script is not to be used as a standalone method and must be studied well in order to execute trades. I have not hidden visibility on other time-frames, but since order execution is done on the Daily time-frame, the script must run on the Daily time-frame only.
There are many other factors to be taken into consideration before entering a trade and proper risk management and position sizing rules must be followed.
Our bootcamp participants will use this strategy tester in conjunction with the invite-only Trading Toolkit assigned to them.
The development of this script will be ongoing and all comments and feedback are welcome.
