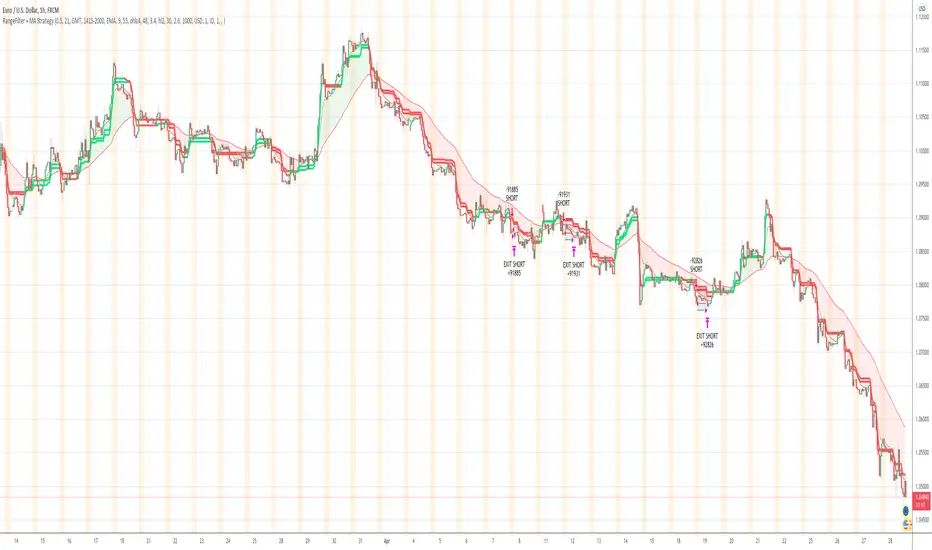
Range Filter + MA Strategy [Kintsugi Trading]What is the Range Filter + MA Strategy?
This premium indicator was inspired by my desire to find and place high probability forex trades in any market, direction, or time of day.
Why Forex?
The Forex markets operate 24 hours, 5.5 days a week
Access to meaningful leverage
Ability to easily trade long or short
High liquidity
How to use it!
----- First, start by choosing a Risk/Reward Ratio and Stop PIP Size. -----
- Risk/Reward Ratio = If you have a .5 risk/reward, it means you are risking $100 to make $50.
- Stop PIP Size = How many PIPs will be representative of the max risk. i.e. - if you are risking $100 and you set the PIP stop to 10, that means 10 PIPs = $100.
----- Next, we set the Session Filter. -----
Set the Timezone and Trade Session you desire. If no specific session is desired, simply leave the box unchecked.
----- Next, we set the Moving Average Cloud. -----
Enter the Moving Average Type:
Simple Moving Average
Exponential Moving Average
Hull Moving Average
Weighted Moving Average
Smoothed Moving Average
Enter the fast and slow Moving Average Period.
These inputs will determine whether the strategy looks for Long or Short positions.
----- Next, we set the Range Filters. -----
In combination with the Moving Average Cloud, the Range Filter will help us determine when to take a trade and in what direction.
The strategy is essentially looking for small reversals going against the overall trend and placing a trade once that reversal ends and the price moves back in the direction of the overall trend.
The Range filter utilizes confirmation between two entirely separate Range Filter calculations (or set them both equal to use one).
Each Range Filter is completely customizable by:
Source Calculation (open, high, low, close, hl2, hlc3, ohlc4, hlcc4)
Sampling Period
Range Multiplier
----- Finally, we backtest our ideas. -----
After using the 'Strategy Tester' tab on TradingView to thoroughly backtest your predictions you are ready to take it to the next level - Automated Trading!
This was my whole reason for creating the script. If you work a full-time job, live in a time zone that is hard to trade, or just don't have the patience, this will be a game-changer for you as it was for me.
Auto-Trading
When it comes to auto-trading this strategy I have included two options in the script that utilize the alert messages generated by TradingView.
*Note: Please trade on a demo account until you feel comfortable enough to use real money, and then please stick to 1%-2% of your total account value in risk per trade.*
AutoView
PineConnector
Good luck with your trading!
Cerca negli script per "range"
Range Strategy (kasatura84)Winning Range Strategy (Set Heikin Ashi Candles)
Incredible winning strategy. You have to set Heikin Ashi Candles to activate strategy! It works both long and short trades.

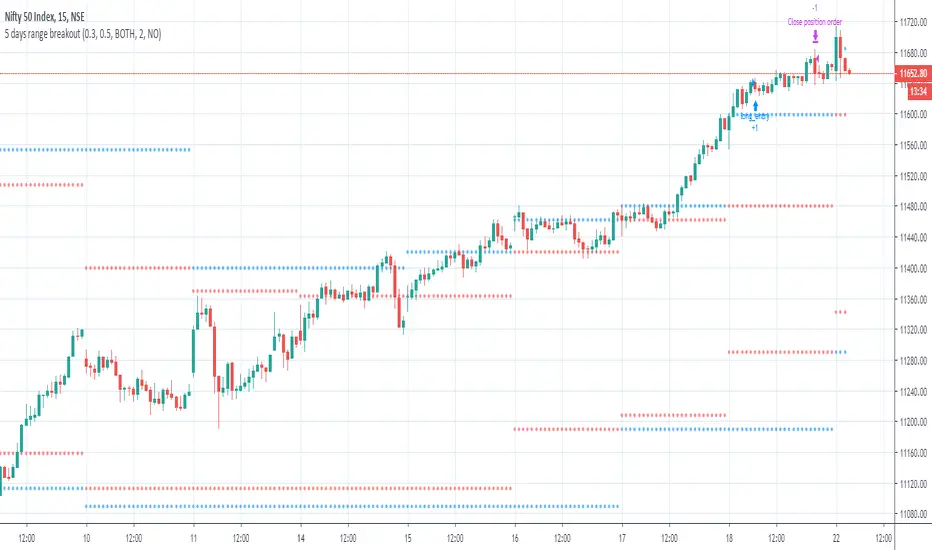
Range BreakerStrategy Description: Range Breaker
The Range Breaker strategy is a breakout trading strategy that aims to capture profits when the price of a financial instrument moves out of a defined range. The strategy identifies swing highs and swing lows over a specified lookback period and enters long or short positions when the price breaks above the swing high or below the swing low, respectively. It also employs stop targets based on a percentage to manage risk and protect profits.
Beginner's Guide:
Understand the concepts:
a. Swing High: A swing high is a local peak in price where the price is higher than the surrounding prices.
b. Swing Low: A swing low is a local trough in price where the price is lower than the surrounding prices.
c. Lookback Period: The number of bars or periods the strategy analyzes to determine swing highs and swing lows.
d. Stop Target: A predetermined price level at which the strategy will exit the position to manage risk and protect profits.
Configure the strategy:
a. Set the initial capital, order size, commission, and pyramiding as needed for your specific trading account.
b. Choose the desired lookback period to identify the swing highs and lows.
c. Set the stop target multiplier and stop target percentage as desired to manage risk and protect profits.
Backtest the strategy:
a. Set the backtest start date to analyze the strategy's historical performance.
b. Observe the backtesting results to evaluate the strategy's effectiveness and adjust the parameters if necessary.
Implement the strategy:
a. Apply the strategy to your preferred financial instrument on the TradingView platform.
b. Monitor the strategy's performance and adjust the parameters as needed to optimize its effectiveness.
Risk management:
a. Always use a stop target to protect your trading capital and manage risk.
b. Don't risk more than a small percentage of your trading capital on a single trade.
c. Be prepared to adjust the strategy or stop trading it if the market conditions change significantly.
Adjusting the Lookback Period and Timeframes for Optimal Strategy Performance
The Range Breaker strategy uses a lookback period to identify swing highs and lows, which serve as the basis for determining entry and exit points for long and short positions. By adjusting the lookback period and analyzing different timeframes, you can potentially find the best strategy configuration for each specific asset.
Adjusting the lookback period:
The lookback period is a critical parameter that affects the sensitivity of the strategy to price movements. A shorter lookback period will make the strategy more sensitive to smaller price fluctuations, resulting in more frequent trading signals. On the other hand, a longer lookback period will make the strategy less sensitive, generating fewer signals but potentially capturing larger price movements.
To optimize the lookback period for a specific asset, you can test different lookback values and compare their performance in terms of risk-adjusted returns, win rate, and other relevant metrics. Keep in mind that using an overly short lookback period may lead to overtrading and increased transaction costs, while an overly long lookback period may cause the strategy to miss profitable trading opportunities.
Analyzing different timeframes:
Timeframes refer to the duration of each bar or candlestick on the chart. Shorter timeframes (e.g., 5-minute, 15-minute, or 30-minute) focus on intraday price movements, while longer timeframes (e.g., daily, weekly, or monthly) capture longer-term trends. The choice of timeframe affects the number of trading signals generated by the strategy and the length of time each position is held.
To find the best strategy for each asset, you can test the Range Breaker strategy on different timeframes and analyze its performance. Keep in mind that shorter timeframes may require more active monitoring and management due to the increased frequency of trading signals. Longer timeframes, on the other hand, may require more patience as positions are held for extended periods.
Finding the best strategy for each asset:
Every asset has unique price characteristics that may affect the performance of a trading strategy. To find the best strategy for each asset, you should:
a. Test various lookback periods and timeframes, observing the strategy's performance in terms of profitability, risk-adjusted returns, and win rate.
b. Consider the asset's historical price behavior, such as its volatility, liquidity, and trend-following or mean-reverting tendencies.
c. Evaluate the strategy's performance during different market conditions, such as bullish, bearish, or sideways markets, to ensure its robustness.
d. Keep in mind that each asset may require a unique set of strategy parameters for optimal performance, and there may be no one-size-fits-all solution.
By experimenting with different lookback periods and timeframes, you can fine-tune the Range Breaker strategy for each specific asset, potentially improving its overall performance and adaptability to changing market conditions. Always practice proper risk management and be prepared to make adjustments as needed.
Remember that trading strategies carry inherent risk, and past performance is not indicative of future results. Always practice proper risk management and consider your own risk tolerance before trading with real money.

Range Breakout PredictorHi everyone, I put this together while learning Pine and wanted to share to see if anyone finds it useful.
It does a decent job predicting the direction of breakouts from range conditions, as well as picking up some easy trend profits. I had some fun making it quite configurable for those who would like to tune it for a particular index (for example, check out GOOG at 1 hour resolution with the default values, just for fun).
Please let me know if you like anything about it or have suggestions!

Range Filter Strategy with ATR TP/SLHow This Strategy Works:
Range Filter:
Calculates a smoothed average (SMA) of price
Creates upper and lower bands based on standard deviation
When price crosses above upper band, it signals a potential uptrend
When price crosses below lower band, it signals a potential downtrend
ATR-Based Risk Management:
Uses Average True Range (ATR) to set dynamic take profit and stop loss levels
Take profit is set at entry price + (ATR × multiplier) for long positions
Stop loss is set at entry price - (ATR × multiplier) for long positions
The opposite applies for short positions
Input Parameters:
Adjustable range filter length and multiplier
Customizable ATR length and TP/SL multipliers
All parameters can be optimized in TradingView's strategy tester
You can adjust the input parameters to fit your trading style and the specific market you're trading. The ATR-based exits help adapt to current market volatility.

Superior-Range Bound Renko - Strategy - 11-29-25 - SignalLynxSuperior-Range Bound Renko Strategy with Advanced Risk Management Template
Signal Lynx | Free Scripts supporting Automation for the Night-Shift Nation 🌙
1. Overview
Welcome to Superior-Range Bound Renko (RBR) — a volatility-aware, structure-respecting swing-trading system built on top of a full Risk Management (RM) Template from Signal Lynx.
Instead of relying on static lookbacks (like “14-period RSI”) or plain MA crosses, Superior RBR:
Adapts its range definition to market volatility in real time
Emulates Renko Bricks on a standard, time-based chart (no Renko chart type required)
Uses a stack of Laguerre Filters to detect genuine impulse vs. noise
Adds an Adaptive SuperTrend powered by a small k-means-style clustering routine on volatility
Under the hood, this script also includes the full Signal Lynx Risk Management Engine:
A state machine that separates “Signal” from “Execution”
Layered exit tools: Stop Loss, Trailing Stop, Staged Take Profit, Advanced Adaptive Trailing Stop (AATS), and an RSI-style stop (RSIS)
Designed for non-repainting behavior on closed candles by basing execution-critical logic on previous-bar data
We are publishing this as an open-source template so traders and developers can leverage a professional-grade RM engine while integrating their own signal logic if they wish.
2. Quick Action Guide (TL;DR)
Best Timeframe:
4 Hours (H4) and above. This is a high-conviction swing-trading system, not a scalper.
Best Assets:
Volatile instruments that still respect market structure:
Bitcoin, Ethereum, Gold (XAUUSD), high-volatility Forex pairs (e.g., GBPJPY), indices with clean ranges.
Strategy Type:
Volatility-Adaptive Trend Following + Impulse Detection.
It hunts for genuine expansion out of ranges, not tiny mean-reversion nibbles.
Key Feature:
Renko Emulation on time-based candles.
We mathematically model Renko Bricks and overlay them on your standard chart to define:
“Equilibrium” zones (inside the brick structure)
“Breakout / impulse” zones (when price AND the impulse line depart from the bricks)
Repainting:
Designed to be non-repainting on closed candles.
All RM execution logic uses confirmed historical data (no future bars, no security() lookahead). Intrabar flicker during formation is allowed, but once a bar closes the engine’s decisions are stable.
Core Toggles & Filters:
Enable Longs and Shorts independently
Optional Weekend filter (block trades on Saturday/Sunday)
Per-module toggles: Stop Loss, Trailing Stop, Staged Take Profits, AATS, RSIS
3. Detailed Report: How It Works
A. The Strategy Logic: Superior RBR
Superior RBR builds its entry signal from multiple mathematical layers working together.
1) Adaptive Lookback (Volatility Normalization)
Instead of a fixed 100-bar or 200-bar range, the script:
Computes ATR-based volatility over a user-defined period.
Normalizes that volatility relative to its recent min/max.
Maps the normalized value into a dynamic lookback window between a minimum and maximum (e.g., 4 to 100 bars).
High Volatility:
The lookback shrinks, so the system reacts faster to explosive moves.
Low Volatility:
The lookback expands, so the system sees a “bigger picture” and filters out chop.
All the core “Range High/Low” and “Range Close High/Low” boundaries are built on top of this adaptive window.
2) Range Construction & Quick Ranges
The engine constructs several nested ranges:
Outer Range:
rangeHighFinal – dynamic highest high
rangeLowFinal – dynamic lowest low
Inner Close Range:
rangeCloseHighFinal – highest close
rangeCloseLowFinal – lowest close
Quick Ranges:
“Half-length” variants of those, used to detect more responsive changes in structure and volatility.
These ranges define:
The macro box price is trading inside
Shorter-term “pressure zones” where price is coiling before expansion
3) Renko Emulation (The Bricks)
Rather than using the Renko chart type (which discards time), this script emulates Renko behavior on your normal candles:
A “brick size” is defined either:
As a standard percentage move, or
As a volatility-driven (ATR) brick, optionally inhibited by a minimum standard size
The engine tracks a base value and derives:
brickUpper – top of the emulated brick
brickLower – bottom of the emulated brick
When price moves sufficiently beyond those levels, the brick “shifts”, and the directional memory (renkoDir) updates:
renkoDir = +2 when bricks are advancing upward
renkoDir = -2 when bricks are stepping downward
You can think of this as a synthetic Renko tape overlaid on time-based candles:
Inside the brick: equilibrium / consolidation
Breaking away from the brick: momentum / expansion
4) Impulse Tracking with Laguerre Filters
The script uses multiple Laguerre Filters to smooth price and brick-derived data without traditional lag.
Key filters include:
LagF_1 / LagF_W: Based on brick upper/lower baselines
LagF_Q: Based on HLCC4 (high + low + 2×close)/4
LagF_Y / LagF_P: Complex averages combining brick structures and range averages
LagF_V (Primary Impulse Line):
A smooth, high-level impulse line derived from a blend of the above plus the outer ranges
Conceptually:
When the impulse line pushes away from the brick structure and continues in one direction, an impulse move is underway.
When its direction flips and begins to roll over, the impulse is fading, hinting at mean reversion back into the range.
5) Fib-Based Structure & Swaps
The system also layers in Fib levels derived from the adaptive ranges:
Standard levels (12%, 23.6%, 38.2%, 50%, 61%, 76.8%, 88%) from the main range
A secondary “swap” set derived from close-range dynamics (fib12Swap, fib23Swap, etc.)
These Fibs are used to:
Bucket price into structural zones (below 12, between 23–38, etc.)
Detect breakouts when price and Laguerre move beyond key Fib thresholds
Drive zSwap logic (where a secondary Fib set becomes the active structure once certain conditions are met)
6) Adaptive SuperTrend with K-Means-Style Volatility Clustering
Under the hood, the script uses a small k-means-style clustering routine on ATR:
ATR is measured over a fixed period
The range of ATR values is split into Low, Medium, High volatility centroids
Current ATR is assigned to the nearest centroid (cluster)
From that, a SuperTrend variant (STK) is computed with dynamic sensitivity:
In quiet markets, SuperTrend can afford to be tighter
In wild markets, it widens appropriately to avoid constant whipsaw
This SuperTrend-based oscillator (LagF_K and its signals) is then combined with the brick and Laguerre stack to confirm valid trend regimes.
7) Final Baseline Signals (+2 / -2)
The “brain” of Superior RBR lives in the Baseline & Signal Generation block:
Two composite signals are built: B1 and B2:
They combine:
Fib breakouts
Renko direction (renkoDir)
Expansion direction (expansionQuickDir)
Multiple Laguerre alignments (LagF_Q, LagF_W, LagF_Y, LagF_Z, LagF_P, LagF_V)
They also factor in whether Fib structures are expanding or contracting.
A user toggle selects the “Baseline” signal:
finalSig = B2 (default) or B1 (alternate baseline)
finalSig is then filtered through the RM state machine and only when everything aligns, we emit:
+2 = Long / Buy signal
-2 = Short / Sell signal
0 = No new trade
Those +2 / -2 values are what feed the Risk Management Engine.
B. The Risk Management (RM) Engine
This script features the Signal Lynx Risk Management Engine, a proprietary state machine built to separate Signal from Execution.
Instead of firing orders directly on indicator conditions, we:
Convert the raw signal into a clean integer (Fin = +2 / -2 / 0)
Feed it into a Trade State Machine that understands:
Are we flat?
Are we in a long or short?
Are we in a closing sequence?
Should we permit re-entry now or wait?
Logic Injection / Template Concept:
The RM engine expects a simple integer:
+2 → Buy
-2 → Sell
Everything else (0) is “no new trade”
This makes the script a template:
You can remove the Superior RBR block
Drop in your own logic (RSI, MACD, price action, etc.)
As long as you output +2 or -2 into the same signal channel, the RM engine can drive all exits and state transitions.
Aggressive vs Conservative Modes:
The input AgressiveRM (Aggressive RM) governs how we interpret signals:
Conservative Mode (Aggressive RM = false):
Uses a more filtered internal signal (AF) to open trades
Effectively waits for a clean trend flip / confirmation before new entries
Minimizes whipsaw at the cost of fewer trades
Aggressive Mode (Aggressive RM = true):
Reacts directly to the fresh alert (AO) pulses
Allows faster re-entries in the same direction after RM-based exits
Still respects your pyramiding setting; this script ships with pyramiding = 0 by default, so it will not stack multiple positions unless you change that parameter in the strategy() call.
The state machine enforces discipline on top of your signal logic, reducing double-fires and signal spam.
C. Advanced Exit Protocols (Layered Defense)
The exit side is where this template really shines. Instead of a single “take profit or stop loss,” it uses multiple, cooperating layers.
1) Hard Stop Loss
A classic percentage-based Stop Loss (SL) relative to the entry price.
Acts as a final “catastrophic protection” layer for unexpected moves.
2) Standard Trailing Stop
A percentage-based Trailing Stop (TS) that:
Activates only after price has moved a certain percentage in your favor (tsActivation)
Then trails price by a configurable percentage (ts)
This is a straightforward, battle-tested trailing mechanism.
3) Staged Take Profits (Three Levels)
The script supports three staged Take Profit levels (TP1, TP2, TP3):
Each stage has:
Activation percentage (how far price must move in your favor)
Trailing amount for that stage
Position percentage to close
Example setup:
TP1:
Activate at +10%
Trailing 5%
Close 10% of the position
TP2:
Activate at +20%
Trailing 10%
Close another 10%
TP3:
Activate at +30%
Trailing 5%
Close the remaining 80% (“runner”)
You can tailor these quantities for partial scaling out vs. letting a core position ride.
4) Advanced Adaptive Trailing Stop (AATS)
AATS is a sophisticated volatility- and structure-aware stop:
Uses Hirashima Sugita style levels (HSRS) to model “floors” and “ceilings” of price:
Dungeon → Lower floors → Mid → Upper floors → Penthouse
These levels classify where current price sits within a long-term distribution.
Combines HSRS with Bollinger-style envelopes and EMAs to determine:
Is price extended far into the upper structure?
Is it compressed near the lower ranges?
From this, it computes an adaptive factor that controls how tight or loose the trailing level (aATS / bATS) should be:
High Volatility / Penthouse areas:
Stop loosens to avoid getting wicked out by inevitable spikes.
Low Volatility / compressed structure:
Stop tightens to lock in and protect profit.
AATS is designed to be the “smart last line” that responds to context instead of a single fixed percentage.
5) RSI-Style Stop (RSIS)
On top of AATS, the script includes a RSI-like regime filter:
A McGinley Dynamic mean of price plus ATR bands creates a dynamic channel.
Crosses above the top band and below the lower band change a directional state.
When enabled (UseRSIS):
RSIS can confirm or veto AATS closes:
For longs: A shift to bearish RSIS can force exits sooner.
For shorts: A shift to bullish RSIS can do the same.
This extra layer helps avoid over-reactive stops in strong trends while still respecting a regime change when it happens.
D. Repainting Protection
Many strategies look incredible in the Strategy Tester but fail in live trading because they rely on intrabar values or future-knowledge functions.
This template is built with closed-candle realism in mind:
The Risk Management logic explicitly uses previous bar data (open , high , low , close ) for the key decisions on:
Trailing stop updates
TP triggers
SL hits
RM state transitions
No security() lookahead or future-bar access is used.
This means:
Backtest behavior is designed to match what you can actually get with TradingView alerts and live automation.
Signals may “flicker” intrabar while the candle is forming (as with any strategy), but on closed candles, the RM decisions are stable and non-repainting.
4. For Developers & Modders
We strongly encourage you to mod this script.
To plug your own strategy into the RM engine:
Look for the section titled:
// BASELINE & SIGNAL GENERATION
You will see composite logic building B1 and B2, and then selecting:
baseSig = B2
altSig = B1
finalSig = sigSwap ? baseSig : altSig
You can replace the content used to generate baseSig / altSig with your own logic, for example:
RSI crosses
MACD histogram flips
Candle pattern detectors
External condition flags
Requirements are simple:
Your final logic must output:
2 → Buy signal
-2 → Sell signal
0 → No new trade
That output flows into the RM engine via finalSig → AlertOpen → state machine → Fin.
Once you wire your signals into finalSig, the entire Risk Management system (Stops, TPs, AATS, RSIS, re-entry logic, weekend filters, long/short toggles) becomes available for your custom strategy without re-inventing the wheel.
This makes Superior RBR not just a strategy, but a reference architecture for serious Pine dev work.
5. About Signal Lynx
Automation for the Night-Shift Nation 🌙
Signal Lynx focuses on helping traders and developers bridge the gap between indicator logic and real-world automation. The same RM engine you see here powers multiple internal systems and templates, including other public scripts like the Super-AO Strategy with Advanced Risk Management.
We provide this code open source under the Mozilla Public License 2.0 (MPL-2.0) to:
Demonstrate how Adaptive Logic and structured Risk Management can outperform static, one-layer indicators
Give Pine Script users a battle-tested RM backbone they can reuse, remix, and extend
If you are looking to automate your TradingView strategies, route signals to exchanges, or simply want safer, smarter strategy structures, please keep Signal Lynx in your search.
License: Mozilla Public License 2.0 (Open Source).
If you make beneficial modifications, please consider releasing them back to the community so everyone can benefit.

Extremum Range MA Crossover Strategy1. Principle of Work & Strategy Logic ⚙️📈
Main idea: The strategy tries to catch the moment of a breakout from a price consolidation range (flat) and the start of a new trend. It combines two key elements:
Moving Average (MA) 📉: Acts as a dynamic support/resistance level and trend filter.
Range Extremes (Range High/Low) 🔺🔻: Define the borders of the recent price channel or consolidation.
The strategy does not attempt to catch absolute tops and bottoms. Instead, it enters an already formed move after the breakout, expecting continuation.
Type: Trend-following, momentum-based.
Timeframes: Works on different TFs (H1, H4, D), but best suited for H4 and higher, where breakouts are more meaningful.
2. Justification of Indicators & Settings ⚙️
A. Moving Average (MA) 📊
Why used: Core of the strategy. It smooths price fluctuations and helps define the trend. The price (via extremes) must cross the MA → signals a potential trend shift or strengthening.
Parameters:
maLength = 20: Default length (≈ one trading month, 20-21 days). Good balance between sensitivity & smoothing.
Lower TF → reduce (10–14).
Higher TF → increase (50).
maSource: Defines price source (default = Close). Alternatives (HL2, HLC3) → smoother, less noisy MA.
maType: Default = EMA (Exponential MA).
Why EMA? Faster reaction to recent price changes vs SMA → useful for breakout strategies.
Other options:
SMA 🟦 – classic, slowest.
WMA 🟨 – weights recent data stronger.
HMA 🟩 – near-zero lag, but “nervous,” more false signals.
DEMA/TEMA 🟧 – even faster & more sensitive than EMA.
VWMA 🔊 – volume-weighted.
ZLEMA ⏱ – reduced lag.
👉 Choice = tradeoff between speed of reaction & false signals.
B. Range Extremes (Previous High/Low) 📏
Why used: Define borders of recent trading range.
prevHigh = local resistance.
prevLow = local support.
Break of these levels on close = trigger.
Parameters:
lookbackPeriod = 5: Searches for highest high / lowest low of last 5 candles. Very recent range.
Higher value (10–20) → wider, stronger ranges but rarer signals.
3. Entry & Exit Rules 🎯
Long signals (BUY) 🟢📈
Condition (longCondition): Previous Low crosses MA from below upwards.
→ Price bounced from the bottom & strong enough to push range border above MA.
Execution: Auto-close short (if any) → open long.
Short signals (SELL) 🔴📉
Condition (shortCondition): Previous High crosses MA from above downwards.
→ Price rejected from the top, upper border failed above MA.
Execution: Auto-close long (if any) → open short.
Exit conditions 🚪
Exit Long (exitLongCondition): Close below prevLow.
→ Uptrend likely ended, range shifts down.
Exit Short (exitShortCondition): Close above prevHigh.
→ Downtrend likely ended, range shifts up.
⚠️ Important: Exit = only on candle close beyond extremes (not just wick).
4. Trading Settings ⚒️
overlay = true → indicators shown on chart.
initial_capital = 10000 💵.
default_qty_type = strategy.cash, default_qty_value = 100 → trades fixed $100 per order (not lots). Can switch to % of equity.
commission_type = strategy.commission.percent, commission_value = 0.1 → default broker fee = 0.1%. Adjust for your broker!
slippage = 3 → slippage = 3 ticks. Adjust to asset liquidity.
currency = USD.
margin_long = 100, margin_short = 100 → no leverage (100% margin).
5. Visualization on Chart 📊
The strategy draws 3 lines:
🔵 MA line (thickness 2).
🔴 Previous High (last N candles).
🟢 Previous Low (last N candles).
Also: entry/exit arrows & equity curve shown in backtest.
Disclaimer ⚠️📌
Risk Warning: This description & code are for educational purposes only. Not financial advice. Trading (Forex, Stocks, Crypto) carries high risk and may lead to full capital loss. You trade at your own risk.
Testing: Always backtest & demo test first. Past results ≠ future profits.
Responsibility: Author of this strategy & description is not responsible for your trading decisions or losses.

Strategy: Range BreakoutWhat?
In the price action, levels have a significant role to play. Based on the price moving above/below the levels - the underlying instrument shows some price-action in the direction of breakout/breakdown.
There are plenty of ways level can be determined. Levels are the decision point to take a trade or not. But if we make the level derivation complex, then the execution may get hamper.
This strategy script, developed in PineScript v5, is our attempt at solving this problem at the core by providing this simple, yet elegant solution to this problem.
It's essentially an attempt to Trade Simple by drawing logical (horizontal) lines in the chart and take actions, after multiple associated parameters confirmation, on the breakout / breakdown of the levels.
How?
Let us explain how we are drawing the levels.
We are depending on some of the parameters as described below:
Open Range : During intraday movement, often if prices move beyond a particular level, it exibits more movement in the same swing in same direction. We found out, through our back testing for Indian Indices like NSE:NIFTY , NSE:BANKNIFTY or NSE:CNXFINANCE the first 15m (i.e 09:15 AM to 09:30 AM, IST) is one of such range. For Indian stocks, it is 9:15 to 9:45. And for MCX MCX:CRUDEOIL1! it's 5:00 pm to 6:00 pm. There are our first levels.
PDHCL : Previous Day High, Close, Low. This is our next level
VWAP : The rolling VWAP (volume weighted average price)
In the breakout/breakdown of the Open Range and Previous Day High/Low, we are taking the trade decisions as follows using CEST principle:
C onditions :
If current bar's (say you are in 5m timeframe) closing is broken out the Open Range High or Previous Day High, taken a Buy/Long decision (let's say buying a Call Option CE or selling a Put Option PE or buying the future or cash).
If current bar's (say you are in 5m timeframe) closing is broken down the Open Range Low or Previous Day Low, taken a Sell/Short decision (let's say buying a Put Option CE or selling a Call Option PE or selling the future or cash).
Additionally, and optionally (default ON, one can turn off): we are checking various other associated multiple confirmations as follows:
1. Momentum : Checking 14-period RSI value is more than 50 or less than 50 (all parameters like period, OB, OS ranges are configurable through settings)
2. Current bar's volume is more than the last 20 bars volume average. How much more - that multiplier is also configurable. (default is 1)
3. The breakout candle is bullish (green) or bearish (red).
E ntry :
All of these happens only on the closing of the candle . Means: Non Repainting! .
Clearly in the chart we are showing as green up arrow BO (breakout for buy) and red down arrow BD (breakdown for sell) to take your decision process smooth.
So, on the closing of the decision BO/BD candle we are entering the trade (with a thumping heart and nail biting ...)
S top Loss :
We are relying on the time tasted (last 40 years) mechanism of Average True Range (ATR) of default 14 period. This default period is also configurable.
So for Long trades: the 14 period ATR low band is the SL.
For Short trades: the 14 period ATR high band is the SL.
T arget :
We are depending on the thump rule of 1:2 Risk Reward. It's simple and effective. No fancy thing. We are closing the trade on double the favorable price movement compared to the SL placed. Of course, this RR ratio is confiurable from the settings, as usual.
What's Unqiue in it?
The utter simplicity of this trading mechanism. No fancy things like complex chart pattern, OI data, multiple candlestick patterns, Order flow analysis etc.
Simple level determination,
Marking clearly in the chart.
Making each parameter configurable in Settings and showing tooltip adjacent to the parameter to make you understand it better for your customization,
Wait for the candle close, thus eliminating the chances of repainting menace (as much as possible)
Additional momentum and volume check to trade entry confirmation.
Works with normal candlestick (nothing special ones like HA ...)
Showing everything as a Summary Table (which, again can be turned off optionally) overlaying at the bottom-right corner of the chart,
Optionally the Summary Table can be configured to alert you back (say you get it notified in your email or SMS).
That way, a single, simple, effective trade setup will ease your journey as smooth sail as possible.
Mentions
There are plenty of friends from whom time to time we borrowed some of the ideas while working closely together over last one year.
From tradingview community, we took the spirit of @zzzcrypto123 awesome work done long back (in 2020) as the indicator "ORB - Opening Range Breakout". (We tried to reach him for his explicit consent, unable to catch hold of him).
Some other publicly available materials we have consulted to get the additional checks (like RSI, volume).
Lat word
Use it please and thank you for your constant patronage in following us in this awesome platform. Let's keep growing together.
Disclaimer :
This piece of software does not come up with any warrantee or any rights of not changing it over the future course of time.
We are not responsible for any trading/investment decision you are taking out of the outcome of this indicator.

Opening-Range BreakoutNote: Default trading date range looks mediocre. Set date range to "Entire History" to see full effect of the strategy. 50.91% profitable trades, 1.178 profit factor, steady profits and limited drawdown. Total P&L: $154,141.18, Max Drawdown: $18,624.36. High R^2
█ Overview
The Opening-Range Breakout strategy is a mechanical, session‑based day‑trading system designed to capture the initial burst of directional momentum immediately following the market open. It defines a user‑configurable “opening range” window, measures its high and low boundaries, then places breakout stop orders at those levels once the range closes. Built‑in filters on minimum range width, reward‑to‑risk ratios, and optional reversal logic help refine entries and manage risk dynamically.
█ How It Works
Opening‑Range Formation
Between 9:30–10:15 AM ET (configurable), the script tracks the highest high and lowest low to form the day’s opening range box.
On the first bar after the range window closes, the range high (OR_high) and low (OR_low) are “locked in.”
Range‑Width Filter
To avoid false breakouts in low‑volatility mornings, the range must be at least X% of the current price (default 0.35%).
If the measured opening-range width < minimum threshold, no orders are placed that day.
Entry & Order Placement
Long: a stop‑buy order at the opening‑range high.
Short: a stop‑sell order at the opening‑range low.
Only one side can trigger (or both if reverse logic is enabled after a losing trade).
Risk Management
Once triggered, each trade uses an ATR‑style stop-loss defined as a percentage retracement of the range (default 50% of range width).
Profit target is set at a configurable Reward/Risk Ratio (default 1.1×).
Optional: Reverse on Stop‑Loss – if the initial breakout loses, immediately reverse into the opposite side on the same day.
Session Exit
Any open positions are closed at the end of the regular trading day (default 3:45 PM ET window end, with hard flat at session close).
Visual cues are provided via green (range high) and red (range low) step‑line plots directly on the chart, allowing you to see the range box and breakout triggers in real time.
█ Why It Works
Early Momentum Capture: The first 15 – 60 minutes of trading encapsulate overnight news digestion and institutional order flow, creating a well‑defined volatility “range.”
Mechanical Discipline: Clear, rule‑based entries and exits remove emotional guesswork, ensuring consistency.
Volatility Filtering: By requiring a minimum range width, the system avoids choppy, low‑range days where false breakouts are common.
Dynamic Sizing: Stops and targets scale with the opening range, adapting automatically to each day’s volatility environment.
█ How to Use
Set Your Instruments & Timeframe
-Apply to any futures contract on a 1‑ to 5‑minute chart.
-Ensure chart timezone is set to America/New_York.
Configure Inputs
-Opening‑Range Window: e.g. “0930-1015” for a 45‑minute range.
-Min. OR Width (%): e.g. 0.35 for 0.35% of current price.
-Reward/Risk Ratio: e.g. 1.1 for a modest profit target above your stop.
-Max OR Retracement %: e.g. 50 to set stop at 50% of range width.
-One Trade Per Day: toggle to limit to a single breakout.
-Reverse on Stop Loss: toggle to flip direction after a losing breakout.
Monitor the Chart
-Watch the green and red range boundaries form during the session open.
-Orders will automatically submit on the first bar after the range window closes, conditioned on your filters.
Review & Adjust
-Backtest across multiple months to validate performance on your preferred contract.
-Tweak range duration, minimum width, and R/R multiple to fit your risk tolerance and desired win‑rate vs. expectancy balance.
█ Settings Reference
Input Defaults
Opening‑Range Window - Time window to form OR (HHMM-HHMM) - 0930–1015
Regular Trading Day - Full session for EOD flat (HHMM-HHMM) - 0930–1545
Min. OR Width (%) - Minimum OR size as % of close to trigger orders - 0.35
Reward/Risk Ratio - Profit target multiple of stop‑loss distance - 1.1
Max OR Retracement (%) - % of OR width to use as stop‑loss distance - 50
One Trade Per Day - Limit to a single breakout order per day - false
Reverse on Stop Loss - Reverse direction immediately after a losing trade - true
Disclaimer
This strategy description and any accompanying code are provided for educational purposes only and do not constitute financial advice or a solicitation to trade. Futures trading involves substantial risk, including possible loss of capital. Past performance is not indicative of future results. Traders should assess their own risk tolerance and conduct thorough backtesting and forward-testing before committing real capital.

Megabar Breakout (Range & Volume & RSI)Hey there,
This strategy is based on the idea that certain events lead to what are called Megabars. Megabars are bars that have a very large range and volume. I wanted to verify whether these bars indicate the start of a trend and whether one should follow the trend.
Summary of the Code:
The code is based on three indicators: the range of the bar, the volume of the bar, and the RSI. When certain values of these indicators are met, a Megabar is identified. The direction of the Megabar indicates the direction in which we should trade.
Why do I combine these indicators?
I want to identify special bars that have the potential to mark the beginning of a breakout. Therefore, a bar needs to exhibit high volume, have a large range (huge price movement), and we also use the Relative Strength Index (RSI) to assess potential momentum. Only if all three criteria are met within one candle, do we use this as an identifier for a megabar.
Explanation of Drawings on the Chart:
As you can see, there is a green background on my chart. The green background symbolizes the time when I'm entering a trade. Only if a Megabar happens during that time, I'm ready to enter a trade. The time is between 6 AM and 4 PM CET. It's just because I prefer that time. Also, the strategy draws an error every time a Megabar happens based on VOL and Range only (not on the RSI). That makes it pretty easy to go through your chart and check the biggest bars manually. You can activate or deactivate these settings via the input data of the strategy.
When Do We Enter a Trade?
We wait for a Megabar to happen during our trading session. If the Megabar is bullish, we open a LONG trade at the opening price of the next candle. If the Megabar is bearish, we open a SHORT trade at the opening price of the next candle.
Where Do We Put Our Take Profit & Stop Loss?
The default setting is TP = 40 Pips and SL = 30 Pips. In that case, we are always trading with a risk-reward ratio of 1.33 by default. You can easily change these settings via the input data of the strategy.
Strategy Results
The criteria for Megabars were chosen by me in a way that makes Megabars something special. They are not intended to occur too frequently, as the fundamental idea of this strategy would otherwise not hold. This results in only 37 closed trades within the last 12 months. If you change the criterias for a megabar to a milder one, you will create more Megabars and therefore more trades. It's up to you. I have adapted this strategy to the 30-minute chart of the EURUSD. In the evaluation, we consider a period of 12 months, which I believe is sufficient.
My default settings for the indicators look like this:
Avg Length Vol 20
Avg Multiplier Vol 3
Avg Length Range 20
Avg Multiplier Range 4
Value SMA RSI for Long Trades 50
Value SMA RSI for Short Trades 70
IMPORTANT: The current performance overview does not display the results of these settings. Please change the settings to my default ones so that you can see how I use this strategy.
I do not recommend trading this strategy without further testing. The script is meant to reflect a basic idea and be used as a tool to identify Megabars. I have made this strategy completely public so that it can be further developed. One can take this framework and test it on different timeframes and different markets.

Powertrend - Volume Range Filter Strategy [wbburgin]The Powertrend is a range filter that is based off of volume, instead of price. This helps the range filter capture trends more accurately than a price-based range filter, because the range filter will update itself from changes in volume instead of changes in price. In certain scenarios this means that the Powertrend will be more profitable than a normal range filter.
Essentials of the Strategy
This is a breakout strategy which works best on trending assets with high volume and liquidity. It should be used on middle to higher timeframes and can be used on all assets that have volume provided by the data source (stocks, crypto, forex). It is long-only as of now. It can work on lower timeframes if you optimize the strategy filters to make less trades or if your exchange/broker is low/no fees, provided that your exchange/broker has high liquidity and volume.
The strategy enters a long position if the range filter is trending upwards and the price crosses over the upper range band, which signifies a price-volume breakout. The strategy closes the long position if the range filter is trending downwards and the price crosses under the lower range band, which signifies a breakdown. Both these conditions can be altered by the three filter options in the settings. The default trend filter is not alterable because it helps prevent false entries and exits that are against the trend.
Settings
The Length setting is the lookback period for the range smoothing.
The ADX Filter setting enables you to turn on an ADX filter, which will halt entries and exits unless the ADX of your customizable length is above a ADX VWMA of that length.
The Range Supertrend setting creates a supertrend from the top and bottom ranges, which can be used to filter entries and exits. The length is customizable. The filter can show you whether the range is making higher highs and lower lows. Below is an example of the Range Supertrend being used as a filter and plotted on-chart:
The VWMA setting halts entries if they are below a customizable length VWMA.
Both the Range Supertrend and the VWMA can also be plotted separately without actually filtering the strategy, so that you can use them independently if you wish. You can turn off the bar color, the highlighting, and the labels if you wish in the settings. A note about the bar color: if the color changes but the strategy does not signal an exit or entry this means that the crossover was against the trend. In these circumstances it may be indicative of a pullback to enter or exit or to add onto your position.
About the Strategy Results Below
A range filter is normally composed of two components - the range filter itself and a smoothing function. In the development of this script I tested both normal and volume-based varieties of the range filter and the smoothing function:
Tests Performed
Volume-based Range x VWMA smoothing
Price-based Range x VWMA smoothing
Price-based Range x EMA smoothing
Volume-based Range x EMA smoothing (final result)
The highest-performing was a volume-based range filter and a normal EMA-based smoothing function, but that does not mean that this strategy will be profitable - exits are based off of signal reversion so I strongly encourage you to develop your own take profits/stop losses for the strategy if you think it may be a good fit for you. The results below are with a commission value of 0.05% (because I built the strategy first for equities), slippage of 3, so if your exchange/broker has a higher fee schedule, I recommend adding filters and/or moving to higher timeframes for the strategy. Additionally, I used 10% of equity in each trade, while using the Range Supertrend filter (the previous upload was unrealistic because it used 100% of equity - missed a 0, apologies, and added in slippage).

Range FinderRange Finder Strategy for TradingView
Overview
The Range Finder Strategy is a sophisticated trading system designed for forex and cryptocurrency markets, leveraging dynamic range detection, wick-based rejection patterns, and EMA confluence to execute high-probability trades. This strategy identifies key price ranges using pivot points and triggers trades when price rejects from these boundaries with significant wick formations, aligning with the broader market trend as confirmed by EMA crossovers. It incorporates robust risk management, customizable parameters, and visual aids for clear trade visualization, making it suitable for both manual and automated trading on platforms like Bitget via webhook alerts.
Strategy Components
1. Dynamic Range Detection
Pivot Points: The strategy identifies range boundaries using pivot highs and lows, calculated with a user-defined Pivot Length (default: 5 bars left/right). These pivots mark significant swing points, defining the upper (range high) and lower (range low) boundaries of the price range.
Visualization: The range high is plotted as an orange line, and the range low as a purple line, using a broken line style (plot.style_linebr) to show only confirmed pivot levels, providing a clear visual of the trading range.
2. Wick-Based Rejection Pattern
Wick Detection: The strategy looks for rejection candles at the range boundaries, characterized by significant wicks. A wick is considered valid if its size is at least the user-defined Wick to Body Ratio (default: 1.1, or 10% larger than the candle body).
Sell Signal: Triggered when the high exceeds the range high, the candle closes bearish (close < open), and the upper wick meets the ratio requirement.
Buy Signal: Triggered when the low falls below the range low, the candle closes bullish (close > open), and the lower wick meets the ratio requirement.
Purpose: These wicks indicate strong rejection at key levels, often signaling a reversal back into the range, providing high-probability entry points.
3. EMA Trend Confirmation
EMA Calculation: Uses two Exponential Moving Averages (EMAs) calculated on a user-selectable timeframe (default: 5-minute):
EMA 200: Long-term trend indicator (plotted in red).
EMA 50: Short-term trend indicator (plotted in green).
Crossover Logic:
A bullish trend is confirmed when the EMA 50 crosses above the EMA 200 (ema_trend_up = true).
A bearish trend is confirmed when the EMA 50 crosses below the EMA 200 (ema_trend_down = true).
Confluence Requirement: Trades are only executed when the wick rejection aligns with the EMA trend (e.g., sell signals require close < ema200 and bearish trend; buy signals require close > ema200 and bullish trend).
4. Risk Management
Position Sizing: Calculated based on the user-defined Account Balance (default: $10,000) and Risk Per Trade (default: 2%). The position size is determined as risk_amount / stop_distance, where stop_distance is derived from the Average True Range (ATR, default period: 14).
Stop Loss (SL): Set using an ATR-based multiplier (SL Multiplier, default: 9.0). For sells, SL is placed above the high; for buys, below the low.
Take Profit (TP): Set using an ATR-based multiplier (TP Multiplier, default: 6.0) scaled by the Risk:Reward Ratio (default: 6.0), ensuring a favorable reward-to-risk profile.
Example: For a $10,000 account with 2% risk, if ATR is 0.5, the position size is 400 units, with SL and TP dynamically adjusted to market volatility.
5. Trade Execution
Sell Entry: Triggered on a wick rejection above the range high, with bearish EMA confluence (ema_trend_down and close < ema200). Enters a short position with calculated SL and TP.
Buy Entry: Triggered on a wick rejection below the range low, with bullish EMA confluence (ema_trend_up and close > ema200). Enters a long position with calculated SL and TP.
Exit Logic: Uses strategy.exit to set SL and TP levels, closing trades when either is hit.
6. Visual Feedback
Lines and Labels: Upon trade entry, the strategy plots:
Red SL line and label (e.g., "SL: 123.45").
Green TP line and label (e.g., "TP: 120.00").
Entry line (red for sell, green for buy) labeled with "Sell (Range Rejection)" or "Buy (Range Rejection)".
Customization: Users can adjust the Line Length (default: 25 bars) for how long lines persist and Label Position (left or right) for optimal chart visibility.
7. Alert Conditions
Webhook Integration: Generates alerts for Bitget webhook integration, providing JSON-formatted messages with trade details (action, contracts, market position, size, price, symbol, and timestamp).
Usage: Traders can set up automated trading by connecting these alerts to trading bots or platforms supporting webhooks.

AM Range Sniper [jmaxxx]AM Range Sniper
Overview
AM Range Sniper is a sophisticated morning session trading strategy designed for Micro E-mini Nasdaq-100 Index Futures (MNQ). This strategy capitalizes on the critical 8:30-9:30 AM EST range formation period, implementing precise entry and exit mechanics with advanced risk management.
Key Features
🕐 Time-Based Range Analysis
Range Definition: Automatically identifies and tracks the 8:30-9:30 AM EST range
Trading Window: Active trading from 9:30 AM to 11:00 AM EST (extended for second chance trades)
Session Management: Daily reset ensures clean state for each trading session
🎯 Multiple Entry Patterns
Breakthrough/Retest: Captures price breakthroughs above range with retest opportunities
Long/Short Opportunities: Comprehensive coverage of both directional moves
Breakdown: Identifies bearish breakdowns below range support
Break Up: Detects bullish breakups above range resistance
Range Sweeps: Monitors for range high/low sweeps with reversal entries
⚡ Advanced Risk Management
Configurable Stop Losses: Tick-based stop losses for each trade type
Take Profit Targets: Automatic target calculations based on range size
Hard Close Protection: Automatic position closure at 4 PM EST
Second Chance Feature: Optional second trade opportunity if first trade loses
🔧 Professional Features
Visual Stop Loss Lines: Real-time stop loss visualization on chart
Debug Information Panel: Comprehensive status monitoring
Alert Integration: Customizable alert messages for entries/exits
Flexible Time Settings: Adjustable for different timezones
Strategy Logic
Range Formation (8:30-9:30 AM)
The strategy monitors the first hour of trading to establish the day's range. This range serves as the foundation for all subsequent trading decisions.
Entry Conditions
Breakthrough: Price breaks above range high with retest rejection
Breakdown: Price breaks below range low with confirmed bearish momentum
Break Up: Price breaks above range high with strong bullish confirmation
Sweep Entries: Range high/low sweeps followed by reversal signals
Risk Management
Stop Loss: Configurable tick-based stops for each trade type
Take Profit: 1.5x range size targets for breakdown/breakup trades
Position Sizing: Percentage-based position sizing
Session Limits: Maximum 2 trades per session (with second chance feature)
Settings & Customization
Core Parameters
Enable/disable individual entry patterns
Configurable stop loss levels (1-500 ticks)
Second chance feature toggle
Previous day level integration
Visual Customization
Customizable stop loss colors and widths
Debug panel visibility
Range line styling
Alert Configuration
Custom entry/exit alert messages
***** Automate With *****
APEX
NinjaTrader
Crosstrade.io ( promo code JMAXXX )
Performance & Reliability
Precision Focused: Waits for high-probability setups
Risk-Aware: Comprehensive stop loss and position management
Session-Based: Clean daily resets prevent carryover issues
Professional Grade: Designed for serious traders
Ideal For
Day Traders: Morning session specialists
Futures Traders: MNQ and similar instruments
Range Traders: Traders who capitalize on range breakouts
Risk-Conscious Traders: Those who prioritize risk management
Disclaimer
This strategy is for educational and informational purposes. Past performance does not guarantee future results. Always test thoroughly on historical data and paper trading before live implementation. Risk management is crucial - never risk more than you can afford to lose.
Created by jmaxxx - Professional trading strategy developer
For questions, feedback, or customization requests, please leave a comment below.

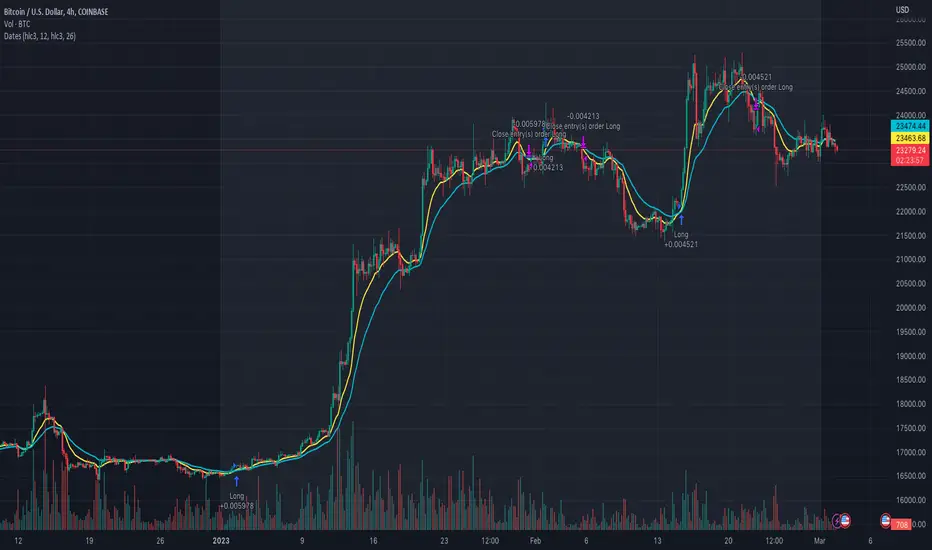
How To Auto Set Date RangeExample how to automatically set the date range window to be backtested from X days or weeks ago to present. Additional options are also included to manually set the date range or to show entire range available.
Normally when you change chart period it changes the number of days being backtested, which means as you increase the chart period (for example from 5min to 15min), you also increase the number of days traded. So you can not compare apples to apples for which period would yield best performance for your strategy.
By incorporating this code with your own strategy's logic (replacing buy and sell), it will allow you to compare results of different period backtests over the same duration of time.
Date Range: ALL uses entire history.
Date Range: DAYS uses number you set in # Days or Weeks
Date Range: WEEKS uses number you set in # Days or Weeks
Date Range: MANUAL uses manual dates you set in From and To fields
Much gratitude to @pinechrix for suggesting this improvement to me, and to @Gesundheit for pointing me in the right direction on the original example I published previously. Thank you both!
NOTICE: This is an example script and not meant to be used as an actual strategy. By using this script or any portion thereof, you acknowledge that you have read and understood that this is for research purposes only and I am not responsible for any financial losses you may incur by using this script!

Maxtra Reversal Range Breakout StrategyReversal Range Breakout Strategy
This strategy uses the first candle as a directional filter. If the first candle is green, it anticipates a potential reversal and takes sell trades only. If the first candle is red, it looks for buy opportunities. The logic is to trade against the initial move, expecting a reversal after the early breakout or momentum spike.

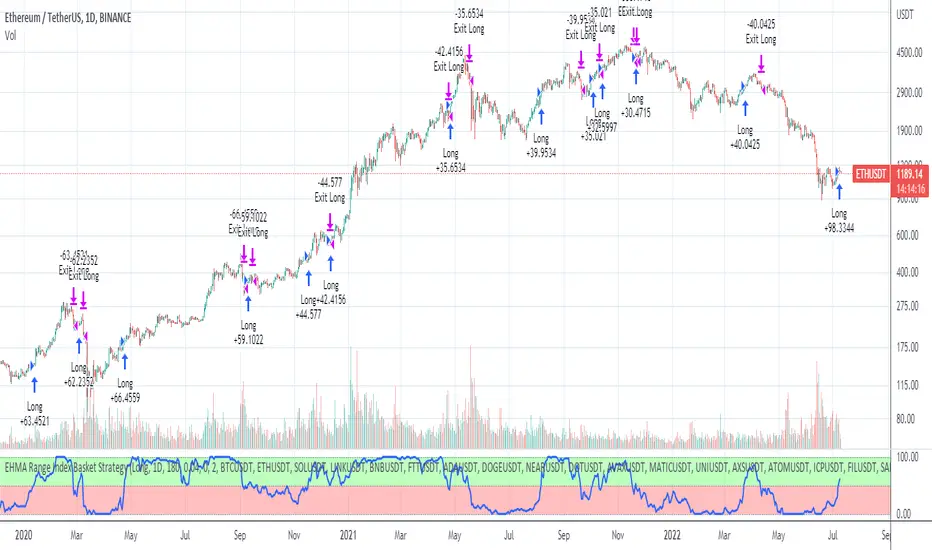
EHMA Range Index Basket StrategyThis script is a modified version of my EHMA Range Strategy.
EHMA Range Strategy
In addition to the EHMA, this script works with a range around the EHMA (which can be modified), in an attempt to be robust against fake signals. Many times a bar will close below a moving average, only to reverse again the next bar, which eats away at your profits. Especially on shorter timeframes, but also on choppy longer timeframes this can make a strategy unattractive to use.
With the range around the EHMA, the strategy only enters a long/exit-short position if a bar crosses above the upper range. Vice versa, it only enters a short/exit-long position if a bar crosses below the lower range. This avoids positions if bars behave choppy within the EHMA range & only enters a position if the market is confident in it's direction. Having said that, fakeouts are still possible, but a lot less frequent. Having backtested this strategy vs the regular EHMA strategy (and having experimented with various settings), this version seems to be a lot more robust & profitable!
EHMA Range Index Basket Strategy
The EHMA Range Index Basket Strategy aims to make the EHMA Range Strategy even more robust, by taking nearly 40 of the most traded crypto trading pairs and applying the EHMA Range Strategy to them. For each pair it assigns a 0 (Sell signal) or 1 (Buy signal) and adds them up. If the number of Buy signals outweigh the number of Sell signals, the index strategy triggers its Buy signal (and vice versa). The results are even more profitable & robust than with the EHMA Range Strategy on its own. Next to that, it performs a lot better on most crypto pairs, due to it's robustness. Because of that, this strategy is a lot less prone to overfitting and will likely produce better results during live trading conditions!
Disclaimer
Please remember that past performance may not be indicative of future results.
Due to various factors, including changing market conditions, the strategy may no longer perform as good as in historical backtesting.
This post and the script don’t provide any financial advice.
How To Set Backtest Time Ranges
Example how to set the time range window to be backtested for both entries and exits. Additional examples are also included showing how to set the date range and toggle plot visibility.
By incorporating this code with your own strategy's logic, it will allow you to backtest various time windows.
Much gratitude to @LucF and @a.tesla2018 for help with including ':1234567' for time ranges on weekends. Thank you both!
NOTICE: This is an example script and not meant to be used as an actual strategy. By using this script or any portion thereof, you acknowledge that you have read and understood that this is for research purposes only and I am not responsible for any financial losses you may incur by using this script!

How To Set Backtest Date RangeExample how to select and set date range window to be backtested. Normally when you change chart period it changes the number of days being backtested which means as you increas the chart period (for example from 5min to 15min) you also increase the number of days traded, so you can not compare apples to apples for which period would yield best returns for your strategy. Now you can. Incorporate this code replacing buy and sell with your strategy, then simply input the From and To dates in Format -> Inputs, and then change the chart period to view updated results.
NOTE: There is a limit in backtesting to 2000 orders, so please be aware of this when setting your date ranges. If you set your range too high, you may be exceeding this limit on some periods and not on others, so this would yield incorrect comparison of returns per period. If you see in your backtesting results that you are nearing this limit for one of your periods you are testing, then reduce the date range to a smaller number of days.
Enjoy!
(Thanks to @Gesundheit "Adeel" for pointing me in the right direction on this!)
Trading range display with BoxThis script is just for reference to see the trading range.
Do not use this strategy logic, it is just Test strategy.
The trading range is colored depending on whether it is profitable or not.
You can change the color if you want.
When you declare the strategy, put (process_orders_on_close=true,calc_on_every_tick=true, max_boxes_count=500) in your script.
Then it can show you current open trading as well.
If you use switching strategy (e.g longposition to shortposition right away), it may not show you the range properly.
In that case, reduse the test period.
IT IS Repainting Reference.
If you want to see your strategy result visually,
Just copy and paste from line 22 in my script.
Good Luck everyone.
전략 거래 기간 동안을 보여주는 지표입니다.
이 지표에 쓰인 전략은 단순 테스트용 입니다. 절대 사용하지 마세요.
각 거래기간은 수익이냐 아니냐에 따라 색깔이 정해 집니다.
색깔은 여러분이 변경하실 수 있습니다.
전략을 선언부에 process_orders_on_close=true,calc_on_every_tick=true, max_boxes_count=500 을 넣으시면 현재 오픈 거래도 보실 수 있습니다.
스위칭 전략(롱에서 숏으로 바로 전환하는 전략)을 쓰시는 분들은 아마 테스트 기간을 줄이라는 경고를 받으실 수 있습니다.
이 지표는 리페이팅이 될 수 있습니다.
전략 결과를 눈으로 보고 싶으신 분들은 22번째 줄 부터 카피하시면 됩니다.
행운이 있길..
---strategy set---
default_qty_value=10
commission_value=0.04
slippage=2
Session Opening Range Breakout (ORBO)This strategy automates a classic Opening Range Breakout (ORBO) approach: it builds a price range for the first minutes after the market opens, then looks for strong breakouts above or below that range to catch early directional moves.
Concept
The idea behind ORBO is simple:
The first minutes after the session open are often highly informative.
Price forms an “opening range” that acts as a mini support/resistance zone.
A clean breakout beyond this zone can lead to high-momentum moves.
This script turns that logic into a fully backtestable strategy in TradingView.
How the strategy works
Opening Range Session
Default session: 09:30–09:50 (exchange time)
During this window, the script tracks:
orHigh → highest high within the session
orLow → lowest low within the session
This forms your Opening Range for the day.
Breakout Logic (after the window ends)
Once the defined session ends:
Long Entry:
If the close crosses above the Opening Range High (orHigh),
→ strategy.entry("OR Long", strategy.long) is triggered.
Short Entry:
If the close crosses below the Opening Range Low (orLow),
→ strategy.entry("OR Short", strategy.short) is triggered.
Only one opening range per day is considered, which keeps the logic clean and easy to interpret.
Daily Reset
At the start of a new trading day, the script resets:
orHigh := na
orLow := na
A fresh Opening Range is then built using the next session’s 09:30–09:50 candles.
This ensures entries are always based on today’s structure, not yesterday’s.
Visuals & Inputs
Inputs:
Opening range session → default: "0930-0950"
Show OR levels → toggle visibility of OR High / Low lines
Fill range body → optional shaded zone between OR High and OR Low
Chart visuals:
A green line marks the Opening Range High.
A red line marks the Opening Range Low.
Optional yellow fill highlights the entire OR zone.
Background shading during the session shows when the range is currently being built.
These visuals make it easy to see:
Where the OR sits relative to current price
How clean / noisy the breakout was
How often price respects or rejects the opening zone
Backtesting & Optimization
Because this is written as a strategy():
You can use TradingView’s Strategy Tester to view:
Win rate
Net profit
Drawdown
Profit factor
Equity curve
Ideas to experiment with:
Change the session window (e.g., 09:15–09:45, 10:00–10:30)
Apply to different:
Markets: indices, FX, crypto, stocks
Timeframes: 1m / 5m / 15m
Add your own:
Stop Loss & Take Profit levels
Time filters (only trade certain days / times)
Volatility filters (e.g., ATR, range size thresholds)
Higher-timeframe trend filter (e.g., only take longs above 200 EMA)

Simple BTC trading strategy based on yesterday's trading rangeOnce market opens, the strategy calculates the price to send a stop buy order
The order is calculated as the sum of yesterday's range multiplied by a special number and today's open price
System has no stops yet
System closes the position on session close
The performance is quite good
Feel free to use it and trade it
Good luck and good trading
