4-Hour Range HighlighterThe 4-Hour Range Highlighter is a powerful visual analysis tool designed for traders operating on lower timeframes (like 5m, 15m, or 1H). It overlays the critical price range of the 4-hour (4H) candlestick onto your chart, providing immediate context from a higher timeframe. This helps you align your intraday trades with the dominant higher-timeframe structure, identifying key support and resistance zones, breakouts, and market volatility at a glance.
Key Features:
Visual Range Overlay: Draws a semi-transparent colored background spanning the entire High and Low of each 4-hour period.
Trend-Based Coloring: Automatically colors the range based on the 4H candle's direction:
Green: Bullish 4H candle (Close > Open)
Red: Bearish 4H candle (Close < Open)
Blue: Neutral 4H candle (Close = Open)
Customizable High/Low Lines: Optional, subtle lines plot the exact high and low of the 4H bar, acting as dynamic support/resistance levels.
Fully Customizable: Easily change colors and toggle visual elements on/off in the settings to match your chart's theme.
How to Use It:
Identify Key Levels: The top and bottom of the shaded area represent significant intraday support and resistance. Watch for price reactions at these levels.
Trade in Context: Use the trend color to gauge sentiment. For example, look for buy opportunities near the low of a bullish (green) 4H range.
Spot Breakouts: A strong candle closing above the high or below the low of the current 4H range can signal a continuation or the start of a new strong move.
Gauge Volatility: A large shaded area indicates a high-volatility 4H period. A small area suggests consolidation or low volatility.
Settings:
Visual Settings: Toggle the background and choose colors for Bullish, Bearish, and Neutral ranges.
Line Settings: Toggle the high/low lines and customize their colors.
Note: This is a visual aid, not a standalone trading system. It provides context but does not generate buy/sell signals. Always use it in conjunction with your own analysis and risk management.
Perfect for Day Traders, Swing Traders, and anyone who needs higher-timeframe context on their chart!
How to Use / Instructions:
After adding the script to your chart, open the settings menu (click on the indicator's name and then the gear icon).
In the "Inputs" tab, you will find two groups: "Visual Settings" and "Line Settings".
In Visual Settings, you can:
Toggle Show 4H Range Background on/off.
Change the Bullish Color, Bearish Color, and Neutral Color for the transparent background.
In Line Settings, you can:
Toggle Show High/Low Lines on/off.
Change the line colors for each trend type.
Adjust the colors to your preference. The default settings use transparency for a clean look that doesn't clutter the chart.
Cerca negli script per "range"

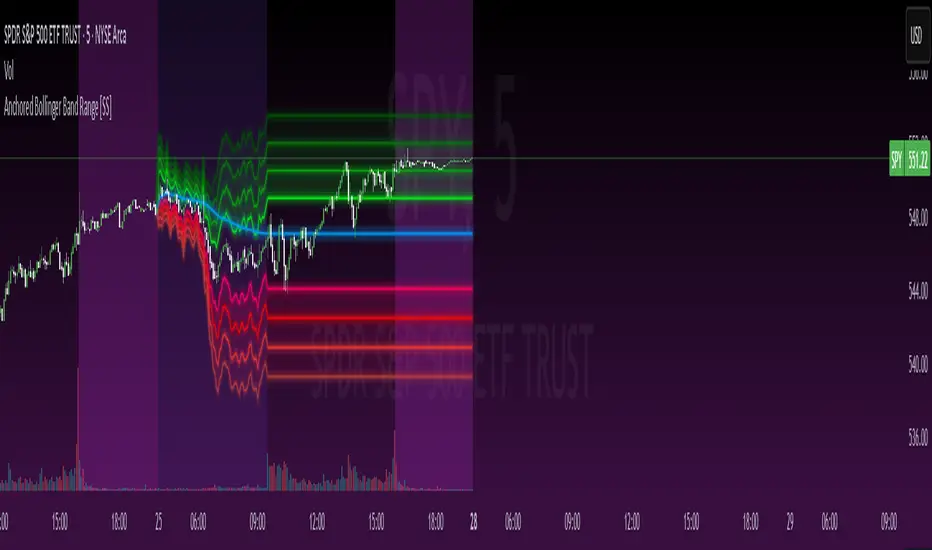
Anchored Bollinger Band Range [SS]This is the anchored Bollinger band indicator.
What it does?
The anchored BB indicator:
Takes a user defined range and calculates the Standard Deviation of the entire selected range for the high and low values.
Computes a moving average of the high and low during the selected period (which later becomes the breakout range average)
Anchors to the last high and last low of the period range to add up to 4 standard deviations to the upside and downside, giving you 4 high and low targets.
How can you use it?
The anchored BB indicator has many applicable uses, including
Identifying daily ranges based on premarket trading activity ( see below ):
Finding breakout ranges for intraday pattern setups ( see below ):
Identified pattern of interest:
Applying Anchored BB:
Identifying daily or pattern biases based on the position to the opening breakout range average (blue line). See the examples with explanations:
ex#1:
ex#2:
The Opening Breakout Average
As you saw in the examples above, the blue line represents the opening breakout range average.
This is the average high of the period of interest and the average low of the period of interest.
Price action above this line would be considered Bullish, and Bearish if below.
This also acts as a retracement zone in non-trending markets. For example:
Best Use Cases
Identify breakout ranges for patterns on larger timeframes. For example
This pattern on SPY, if we overlay the Anchored BB:
You want to see it actually breakout from this range and hold to confirm a breakout. Failure to exceed the BB range, means that it is just ranging with no real breakout momentum.
Identify conservative ranges for a specific period in time, for example QQQ:
Worst Use Cases
Using it as a hard and fast support and resistance indicator. This is not what it is for and ranges can be exceeded with momentum. The key is looking for whether ranges are exceeded (i.e. high momentum, thus breakout play) or they are not (thus low volume, rangy).
Using it for longer term outlooks. This is not ideal for long term ranges, as with any Bollinger/standard deviation based approach, it is only responsive to CURRENT PA and cannot forecast FUTURE PA.
User Inputs
The indicator is really straight forward. There are 2 optional inputs and 1 required input.
Period Selection: Required. Selects the period for the indicator to perform the analysis on. You just select it with your mouse on the chart.
Visible MA: Optional. You can choose to have the breakout range moving average visible or not.
Fills: Optional. You can choose to have the fills plotted or not.
And that is the indicator! Very easy to use and hope you enjoy and find it helpful!
As always, safe trades everyone! 🚀
Timed Ranges [mktrader]The Timed Ranges indicator helps visualize price ranges that develop during specific time periods. It's particularly useful for analyzing market behavior in instruments like NASDAQ, S&P 500, and Dow Jones, which often show reactions to sweeps of previous ranges and form reversals.
### Key Features
- Visualizes time-based ranges with customizable lengths (30 minutes, 90 minutes, etc.)
- Tracks high/low range development within specified time periods
- Shows multiple cycles per day for pattern recognition
- Supports historical analysis across multiple days
### Parameters
#### Settings
- **First Cycle (HHMM-HHMM)**: Define the time range of your first cycle. The duration of this range determines the length of all subsequent cycles (e.g., "0930-1000" creates 30-minute cycles)
- **Number of Cycles per Day**: How many consecutive cycles to display after the first cycle (1-20)
- **Maximum Days to Display**: Number of historical days to show the ranges for (1-50)
- **Timezone**: Select the appropriate timezone for your analysis
#### Style
- **Box Transparency**: Adjust the transparency of the range boxes (0-100)
### Usage Example
To track 30-minute ranges starting at market open:
1. Set First Cycle to "0930-1000" (creates 30-minute cycles)
2. Set Number of Cycles to 5 (will show ranges until 11:30)
3. The indicator will display:
- Range development during each 30-minute period
- Visual progression of highs and lows
- Color-coded cycles for easy distinction
### Use Cases
- Identify potential reversal points after range sweeps
- Track regular time-based support and resistance levels
- Analyze market structure within specific time windows
- Monitor range expansions and contractions during key market hours
### Tips
- Use in conjunction with volume analysis for better confirmation
- Pay attention to breaks and sweeps of previous ranges
- Consider market opens and key session times when setting cycles
- Compare range sizes across different time periods for volatility analysis

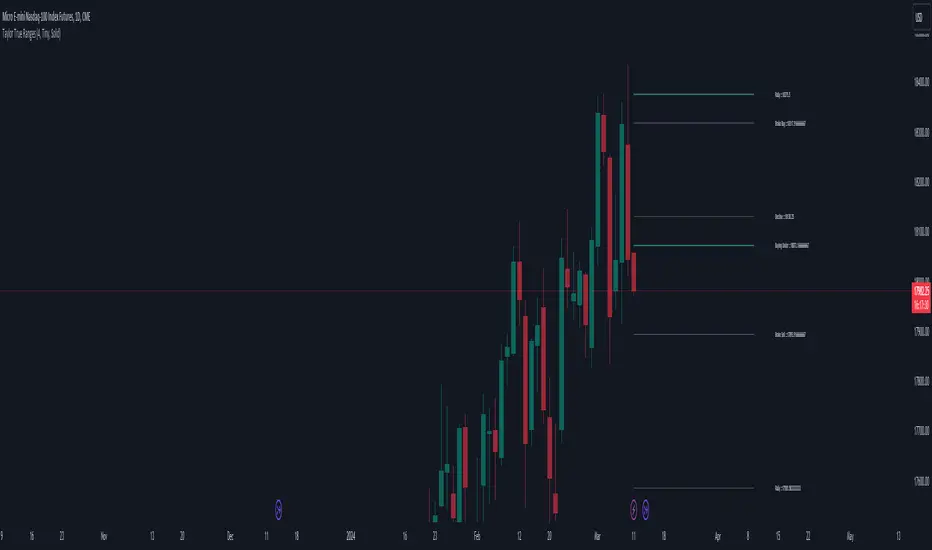
Taylor True Ranges - deviationsDescription:
The Taylor True Ranges - Deviations indicator in Pine Script 5.0 computes various price levels and averages based on Taylor's trading principles. It provides insights into potential buying and selling opportunities by analyzing deviations from average price movements. The indicator calculates and visualizes critical levels such as Decline Average, Buying Under Average, Pivot Brake Sell, Rally Average, Buying High Average, and Pivot Brake Buy. These levels are derived from historical price data and help traders identify key support and resistance zones, trend reversals, and breakout points.
Key Features:
Taylor's Trading Principles: The indicator implements Taylor's methodology to analyze price movements and identify trading opportunities based on deviations from average ranges.
Multiple Price Levels: It calculates and displays various price levels, including Decline Average, Buying Under Average, Pivot Brake Sell, Rally Average, Buying High Average, and Pivot Brake Buy.
Customizable Visualization: Traders can customize the visualization by toggling the display of individual price levels and adjusting the appearance settings such as line style, color, and text size.
Daily Lookback: The indicator supports a customizable daily lookback period, allowing traders to analyze historical price movements over a specified timeframe.
Usage:
Apply the Taylor True Ranges - Deviations indicator to your chart to analyze deviations from average price movements and identify potential trading opportunities.
Customize the indicator settings, including the daily lookback period, line style, color, and text size, to suit your trading preferences and analysis requirements.
Use the calculated price levels and averages as part of your technical analysis to make informed trading decisions, including identifying support and resistance levels, trend reversals, and breakout points.
Example:
Traders can use the Taylor True Ranges - Deviations indicator to analyze deviations from average price movements and identify key support and resistance levels. For instance, observing a Pivot Brake Sell level crossing above the current price might indicate a potential selling opportunity, while a Pivot Brake Buy level crossing below the price could signal a buying opportunity.
Qullamaggie Daily with ADR% and Compression RangeQullamaggie Daily
This Indicator is a Combination of Moving Averages (Simple and Exponential) as definied from Qullamaggie and used in his TC2000 Setup
Moving Averages:
- The Moving Averages are Guidelines for the current Trend and are not decive for the Entry
- They shall be a quick view and visual assistance to find strong momentum stock that are currently in a Phase of a "Flag Pattern"
ADR% 20 Day:
- Average Daily Range in % should indicate the Momentum of the Stock. It is similar but still works different as the Volalitily indicators.
- A stock is recommend to a have a ADR% above 5-6 to be considered a Momentum Leading Stock.
Consolidation Range:
- This Indicator should help to define Ranges in which the Volumen get compressed(increase) while the price movement is minimal
- A strong breakout is to be expected. The Range should be easier to be identified with this indication.

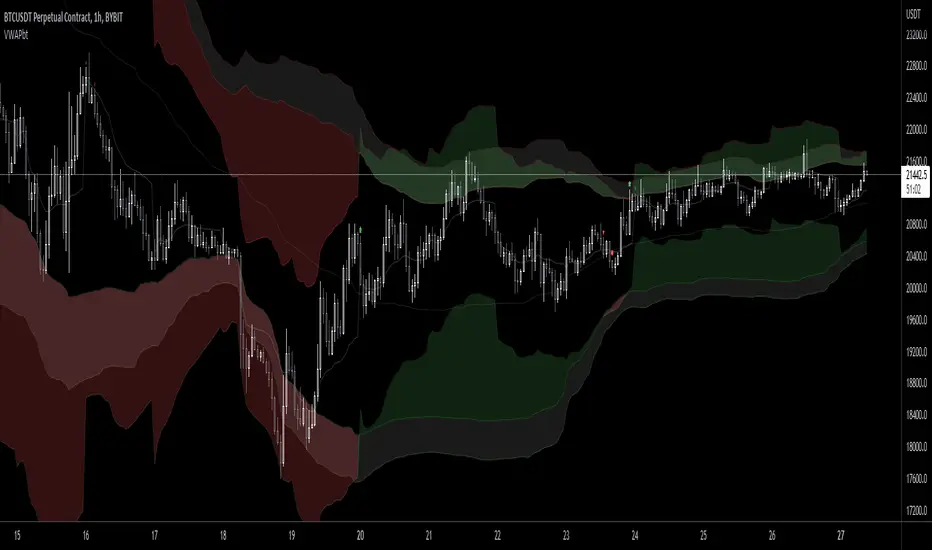
VWAP Band TrendThis indicator combines two features: VWAP bands for range trading and trends for trend-following.
The white bands offer support/resistance levels ideal for range trading: short when rejecting off the upper band, long when rejecting off the lower. Take profit either when hitting the (faint gray) midline and/or when hitting the band on the far side.
The trend analysis shows green or red ranges above or below the bands to indicate trend strength - larger swaths of green or red indicates strong trend while shorter swathes indicate weak. If the upper trend color doesn't match the lower trend color, the trend is undecided or transitioning.
Optionally, trend initiation indicators can be turned on to show above/below candles where a trend switch is taking place.
Demand VectorCreate lines based on the demand for long/short, extracted from price range.. this lines have nothing to do with volume and liquidity, its just a interpretation of price range.

Dual Session Range Boxes with FIB Lines█ OVERVIEW
The Dual Session Range Boxes with FIB Lines indicator is a powerful tool for identifying and visualizing Range Breakout or Inside Boxes Strategy setups with dual session tracking, customizable Fibonacci extensions, and trade zone levels. Perfect for traders who focus on session-based strategies across multiple markets.
█ FEATURES
◆ DUAL SESSION RANGES
- Range 1: Defines the Range (ORB) based on a specific time window
- Range 2: Extends the Range levels throughout a second session for trade management
- Both ranges can be independently configured with preset sessions or custom times
◆ SESSION PRESETS
- Tokyo Session (00:00 - 09:00)
- London Session (08:00 - 17:00)
- New York Session (14:00 - 21:00)
- Pre Market Session (10:00 - 15:30)
- Custom Time: Define your own session windows
◆ FIBONACCI EXTENSION LEVELS
- Automatically calculated from Range 1 High/Low
- Buy Side Levels: Projected above the range (green)
- Sell Side Levels: Projected below the range (red)
- 10 customizable Fib levels with individual on/off toggles:
- 23.6%, 38.2%, 50%, 61.8%, 78.6%, 100%, 127.2%, 161.8%, 200%, 261.8%
- Special color highlighting for key levels (50%, 100%, 200%)
- All percentage values are fully editable
◆ INSIDE TRADE ZONES
- Two horizontal lines drawn inside the Range 1 box
- Configurable percentage from High/Low (default: 10%)
- Helps identify premium/discount zones within the range
◆ LABELS & DISPLAY OPTIONS
- Show/hide price values on labels
- Show/hide percentage values on labels
- Adjustable label size (Tiny, Small, Normal, Large, Huge)
- Configurable label offset (distance above lines)
- Multiple rounding options for price display:
- 0.25 (quarter points - ideal for indices)
- 0.1 (tenth points)
- 0.01 (two decimals)
◆ STYLE CUSTOMIZATION
- Independent fill and border colors for both ranges
- Adjustable border width (1-5)
- Line style options: Solid, Dashed, Dotted
- Separate color settings for:
- Buy side Fibonacci levels
- Sell side Fibonacci levels
- Trade zone lines
- Special levels (50%, 100%, 200%)
◆ HISTORICAL DATA CONTROL
- Toggle to show/hide historical sessions
- Current session always remains visible
- Clean chart view when analyzing only the active session
█ HOW TO USE
1. Set your timezone in General settings
2. Configure Range 1 to capture your desired Opening Range period
3. Configure Range 2 to define how long levels should extend
4. Adjust Fibonacci levels based on your trading strategy
5. Use Trade Zones to identify key areas within the range
6. Toggle historical data on/off based on your analysis needs
█ USE CASES
- Opening Range Breakout (ORB) strategies
- Session-based trading (London, New York, Tokyo, Pre-Market)
- Fibonacci extension targets for breakout trades
- Identifying support/resistance from session ranges
- Multi-session analysis and confluence zones
█ NOTES
- Indicator works on timeframes lower than Daily
- All times are based on the selected timezone setting
- Range 2 only activates after Range 1 completes
- Fibonacci levels extend from Range 1 start to Range 2 end
Let me know if you like to have any enhancements.
Leave a like if you like it!

ACR(Average Candle Range) With TargetsWhat is ACR?
The Average Candle Range (ACR) is a custom volatility metric that calculates the mean distance between the high and low of a set number of past candles. ACR focuses only on the actual candle range (high - low) of specific past candles on a chosen timeframe.
This script calculates and visualizes the Average Candle Range (ACR) over a user-defined number of candles on a custom timeframe. It displays a table of recent range values, plots dynamic bullish and bearish target levels, and marks the start of each new candle with a vertical line. All calculations update in real time as price action develops. This script was inspired by the “ICT ADR Levels - Judas x Daily Range Meter°” by toodegrees.
Key Features
Custom Timeframe Selection: Choose any timeframe (e.g., 1D, 4H, 15m) for analysis.
User-Defined Lookback: Calculate the average range across 1 to 10 previous candles.
Dynamic Targets:
Bullish Target: Current candle low + ACR.
Bearish Target: Current candle high – ACR.
Live Updates: Targets adjust intrabar as highs or lows change during the current candle.
Candle Start Markers: Vertical lines denote the open of each new candle on the selected timeframe.
Floating Range Table:
Displays the current ACR value.
Lists individual ranges for the previous five candles.
Extend Target Lines: Choose to extend bullish and bearish target levels fully across the screen.
Global Visibility Controls: Toggle on/off all visual elements (targets, vertical lines, and table) for a cleaner view.
How It Works
At each new candle on the user-selected timeframe, the script:
Draws a vertical line at the candle’s open.
Recalculates the ACR based on the inputted previous number of candles.
Plots target levels using the current candle's developing high and low values.
Limitation
Once the price has already moved a full ACR in the opposite direction from your intended trade, the associated target loses its practical value. For example, if you intended to trade long but the bearish ACR target is hit first, the bullish target is no longer a reliable reference for that session.
Use Case
This tool is designed for traders who:
Want to visualize the average movement range of candles over time.
Use higher or lower timeframe candles as structural anchors.
Require real-time range-based price levels for intraday or swing decision-making.
This script does not generate entry or exit signals. Instead, it supports range awareness and target projection based on historical candle behavior.
Key Difference from Similar Tools
While this script was inspired by “ICT ADR Levels - Judas x Daily Range Meter°” by toodegrees, it introduces a major enhancement: the ability to customize the timeframe used for calculating the range. Most ADR or candle-range tools are locked to a single timeframe (e.g., daily), but this version gives traders full control over the analysis window. This makes it adaptable to a wide range of strategies, including intraday and swing trading, across any market or asset.

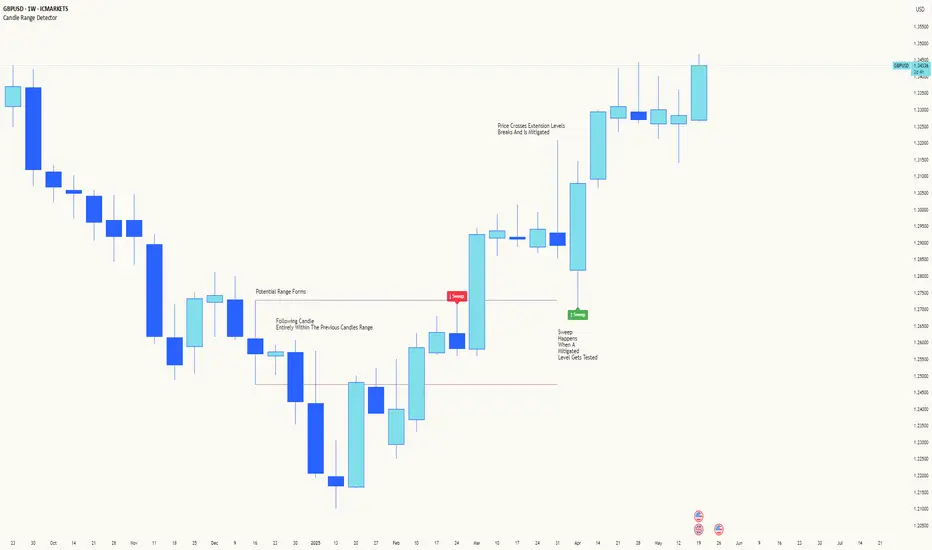
Candle Range DetectorCandle Range Detector
// Pine Script v6
// Detects candle-based ranges, mitigations, and sweeps with advanced logic
Overview
This indicator automatically detects price ranges based on candle containment, then tracks when those ranges are mitigated (broken) and when a sweep occurs. It is designed for traders who want to identify liquidity events and range breaks with precision.
How It Works
- Range Detection: A range is formed when a candle is fully contained within the previous candle (its high is lower and its low is higher). This marks a potential area of price balance or liquidity.
- Mitigation: A range is considered mitigated when price closes beyond its extension levels (configurable by normal or Fibonacci logic). This signals that the range has been invalidated or "taken out" by price action.
- Sweep Detection: After mitigation, the script watches for a sweep event: a candle that both trades through the range extreme and closes decisively beyond the log-mid of the candle itself. This is a strong sign of a liquidity grab or stop run.
- Alerts & Visuals: You can enable alerts and on-chart labels for sweeps. Only the most recent mitigated range can be swept, and each range can only be swept once.
- Timeframe Sensitivity: On weekly or monthly charts, a candle can both mitigate and sweep a range on the same bar. On lower timeframes, only one event can occur per bar.
Why It Works
- Candle containment is a robust way to identify natural price ranges and liquidity pools, as it reflects where price is consolidating or being absorbed.
- Mitigation marks the moment when a range is no longer defended, often leading to new directional moves.
- Sweeps are powerful signals of stop hunts or liquidity grabs, especially when confirmed by a close beyond the log-mid of the candle, indicating strong intent.
Visual Explanation
Tip: Use this tool to spot high-probability reversal or continuation zones, and to get alerted to key liquidity events in real time.
High and Low in a Given Date/Time RangeThis Pine Script v5 indicator plots horizontal lines at both the highest and lowest price levels reached within a user-defined date/time range.
Description:
Inputs:
The user specifies a start and an end date/time by providing the year, month, day, hour, and minute for each. These inputs are converted into timestamps based on the chart’s timezone.
How It Works:
Timestamp Conversion: The script converts the provided start and end dates/times into timestamps using the chart’s timezone.
Bar Check: It examines every bar and checks if the bar’s timestamp falls between the start and end timestamps.
Price Updates:
If a bar’s time is within the specified range, the indicator updates the highest price if the current bar's high exceeds the previously recorded high, and it updates the lowest price if the current bar's low is lower than the previously recorded low.
Drawing Lines:
A red horizontal line is drawn at the highest price, and a green horizontal line is drawn at the lowest price. Both lines start from the first bar in the range and extend dynamically to the current bar, updating as new high or low values are reached.
End of Range: Once a bar's time exceeds the end timestamp, the lines stop updating.
This tool offers a clear and straightforward way to monitor key price levels during a defined period without any extra fluff.

Relative Strength Index With Range ZoneRSI (Relative Strength Index) with 45-55 Range Zone
1. Introduction and Historical Background
The Relative Strength Index (RSI) is a momentum indicator developed in 1978 by J. Welles Wilder Jr. It measures the speed and magnitude of price changes to assess overbought and oversold conditions of an asset. This widely used oscillator ranges between 0 and 100.
Historically, the RSI was mainly used to detect trend reversals by identifying extreme levels: above 70 (overbought) and below 30 (oversold). However, its application has evolved, and new approaches refine its interpretation, such as adding a 45-55 neutral zone to identify consolidation (range) periods.
2. RSI Calculation
The RSI is calculated using the following formula:
RSI=100−(1001+RS)RSI=100−(1+RS100)
Where:
RS=Average gain over N periodsAverage loss over N periodsRS=Average loss over N periodsAverage gain over N periods
• RS (Relative Strength) is the ratio between the average gains and the average losses over N periods (typically 14 periods).
• Gains and losses are calculated based on daily price variations.
Example calculation with a 14-day period:
1. Compute daily gains and losses.
2. Take an exponential or simple moving average of these values over 14 days.
3. Apply the formula to get the RSI value.
3. Classic RSI Usage
The RSI is typically interpreted as follows:
• RSI > 70: Overbought → Possible correction or bearish reversal.
• RSI < 30: Oversold → Possible rebound or bullish reversal.
• RSI between 50 and 70: Bullish momentum.
• RSI between 30 and 50: Bearish momentum.
4. Adding the 45-55 Zone to Identify Range Phases
Adding a neutral zone between 45 and 55 helps identify consolidation periods, when price moves sideways without a strong trend.
• RSI between 45 and 55: The market is in a range, meaning neither buyers nor sellers dominate.
• RSI breaking out of this zone:
o Above 55: Indicates the start of a bullish trend.
o Below 45: Indicates the start of a bearish trend.
This zone is particularly useful for:
• Avoiding false signals by waiting for trend confirmation.
• Identifying ranging markets, favoring range trading strategies (buying at support, selling at resistance).
• Filtering trend-based entries, waiting for the RSI to exit the 45-55 zone.
5. Trading Strategies Using RSI with the 45-55 Range Zone
1. Range Trading:
• When the RSI oscillates between 45 and 55, it signals a lack of strong trend.
• Strategy:
o Identify a support and resistance level.
o Buy near support when the RSI touches 45.
o Sell near resistance when the RSI touches 55.
2. Breakout Trading:
• If the RSI exits the 45-55 zone:
o Above 55 → Buy (start of a bullish trend).
o Below 45 → Sell (start of a bearish trend).
• This breakout can be used as a confirmed entry signal.
3. Confirmation with Divergences:
• A bullish divergence (price making lower lows while RSI makes higher lows) is more relevant if the RSI moves above 55.
• A bearish divergence (price making higher highs while RSI makes lower highs) is stronger if the RSI drops below 45.
6. Conclusion
The RSI is a powerful tool for analyzing price momentum. Adding a 45-55 zone enhances its usage by clearly distinguishing:
• Consolidation phases (range markets).
• Trend beginnings when RSI breaks out of this range.
This approach improves RSI reliability by filtering out false signals and allowing traders to adapt their strategy based on market conditions.

Average Price Range Screener [KFB Quant]Average Price Range Screener
Overview:
The Average Price Range Screener is a technical analysis tool designed to provide insights into the average price volatility across multiple symbols over user-defined time periods. The indicator compares price ranges from different assets and displays them in a visual table and chart for easy reference. This can be especially helpful for traders looking to identify symbols with high or low volatility across various time frames.
Key Features:
Multiple Symbols Supported:
The script allows for analysis of up to 10 symbols, such as major cryptocurrencies and market indices. Symbols can be selected by the user and configured for tracking price volatility.
Dynamic Range Calculation:
The script calculates the average price range of each symbol over three distinct time periods (default are 30, 60, and 90 bars). The price range for each symbol is calculated as a percentage of the bar's high-to-low difference relative to its low value.
Range Visualization:
The results are visually represented using:
- A color-coded table showing the calculated average ranges of each symbol and the current chart symbol.
- A line plot that visually tracks the volatility for each symbol on the chart, with color gradients representing the range intensity from low (red/orange) to high (blue/green).
Customizable Inputs:
- Length Inputs: Users can define the time lengths (default are 30, 60, and 90 bars) for calculating average price ranges for each symbol.
- Symbol Inputs: 10 symbols can be tracked at once, with default values set to popular crypto pairs and indices.
- Color Inputs: Users can customize the color scheme for the range values displayed in the table and chart.
Real-Time Ranking:
The indicator ranks symbols by their average price range, providing a clear view of which assets are exhibiting higher volatility at any given time.
Each symbol's range value is color-coded based on its relative volatility within the selected symbols (using a gradient from low to high range).
Data Table:
The table shows the average range values for each symbol in real-time, allowing users to compare volatility across multiple assets at a glance. The table is dynamically updated as new data comes in.
Interactive Labels:
The indicator adds labels to the chart, showing the average range for each symbol. These labels adjust in real-time as the price range values change, giving users an immediate view of volatility rankings.
How to Use:
Set Time Periods: Adjust the time periods (lengths) to match your trading strategy's timeframe and volatility preference.
Symbol Selection: Add and track the price range for your preferred symbols (cryptocurrencies, stocks, indices).
Monitor Volatility: Use the visual table and plot to identify symbols with higher or lower volatility, and adjust your trading strategy accordingly.
Interpret the Table and Chart: Ranges that are color-coded from red/orange (lower volatility) to blue/green (higher volatility) allow you to quickly gauge which symbols are most volatile.
Disclaimer: This tool is provided for informational and educational purposes only and should not be considered as financial advice. Always conduct your own research and consult with a licensed financial advisor before making any investment decisions.

Consolidation Score ScreenerIn trading, a consolidation range is like a timeout after a big move in the price of a stock or symbol.
It's when the market takes a breather, neither pushing the price up nor down too hard.
Visually, it looks like the price moving sideways on a chart , with highs and lows staying within a certain range.
so this indicator is created to help myself and you decide if its a ranging market and what's the score of that consolidation range
The score ranges between 0 and 10 , where 10 is the max consolidation score , meaning this stock or the symbol is at its highest peak of consolidation .
What would you see using this indicator ?
Symbols circles , inside these circles it will print the consolidation score ..
in the middle of the indicator it will show the range of all the 20 symbols scores .
so it will give you like overall ranging value for your 20 symbols
Settings :
TimeFrame : TimeFrame input to select which time frame you want your indicator to analysis
Range length : The Range that you would want your indicator to take into consideration when doing its analysis .
Features :
20 symbols analysis
Multi timeframe capability
Enjoy .

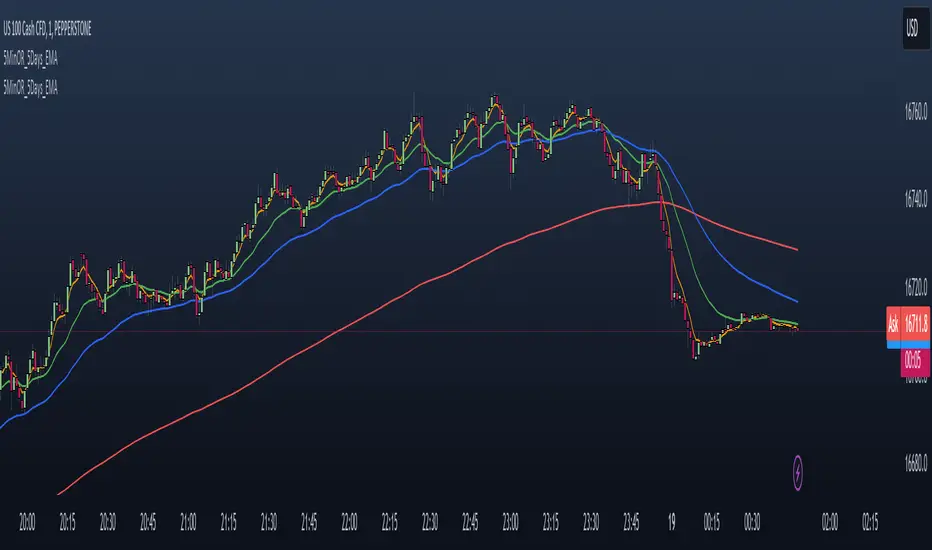
NAS100 - 5 Minute Opening Range with EMAsThis indicator is designed for traders who focus on the opening range breakout strategy and use EMAs as part of their trading decisions. The script markes the first 5 min opening candle and generates Buy and Sell signals calculating EMA.
Basic features are :
User Inputs: Allows users to enable/disable alerts and choose to display Exponential Moving Averages (EMAs) for 5, 20, and 50 periods.
Opening Range Calculation: It calculates the first five minutes of the trading day, adjusting for different chart timeframes.
New Day Detection: Determines if the current bar is the first bar of a new day.
Data Storage: Utilizes arrays to store opening range highs, lows, start bars, and last bars for the last five days.
Daily Updates: Updates the stored data at the start of each new day, maintaining data for only the last five days.
Opening Range Plotting: Plots the opening ranges (high and low) for the past five days, with special plotting and filling for the current day.
EMA Calculation and Plotting: Calculates and plots EMAs (5, 20, and 50 periods) if enabled.
Alert Conditions: Sets up conditions for alerts when the price crosses above or below the current day's opening range.
Signal Generation: Generates buy and sell signals based on the relationship of the closing price to the opening range and the position of EMA5 relative to EMA50.
Signal Plotting: Plots buy and sell signals as triangles on the chart.
Opening Range Gap + Std Dev [starclique]The ICT Opening Range Gap is a concept taught by Inner Circle Trader and is discussed in the videos: 'One Trading Setup For Life' and 2023 ICT Mentorship - Opening Range Gap Repricing Macro
ORGs, or Opening Range Gaps, are gaps that form only on the Regular Trading Hours chart.
The Regular Trading Hours gap occurs between 16:15 PM - 9:29 AM EST (UTC-4)
These times are considered overnight trading, so it is useful to filter the PA (price action) formed there.
The RTH option is only available for futures contracts and continuous futures from CME Group.
To change your chart to RTH, first things first, make sure you’re looking at a futures contract for an asset class, then on the bottom right of your chart, you’ll see ETH (by default) - Click on that, and change it to RTH.
Now your charts are filtering the price action that happened overnight.
To draw out your gap, use the Close of the 4:14 PM candle and the open of the 9:30 AM candle.
How is this concept useful?
Well, It can be used in many ways.
---
How To Use The ORG
One of the ways you can use the opening range gap is simply as support and resistance
If we extend out the ORG from the example above, we can see that there is a clean retest of the opening range gap high after breaking structure to the upside and showing acceptance outside of the gap after consolidating within it.
The ORG High (4:14 Candle Close in this case) was used as support.
We then see an expansion to the upside.
Another way to implement the ORG is by using it as a draw on liquidity (magnet for price)
In this example, if we looked to the left, there was a huge ORG to the downside, leaving a massive gap.
The market will want to rebalance that gap during the regular trading hours.
The market rallies higher, rejects, comes down to clear the current days ORG low, then closes.
That is one example of how you can combine liquidity & ICT market structure concepts with Opening Range Gaps to create a story in the charts.
Now let’s discuss standard deviations.
---
Standard Deviations
Standard Deviations are essentially projection levels for ranges / POIs (Point of Interests)
By this I mean, if you have a range, and you would like to see where it could potentially expand to, you’d place your fibonacci retracement tool on and high and low of the range, then use extension levels to find specific price points where price might reject from.
Since 0 and 1 are your Range High and Low respectively, your projection levels would be something like 1.5, 2, 2.5, and 3, for the extension from your 1 Fib Level, and -0.5, -1, -1.5, and -2 for your 0 Fib level.
The -1 and 2 level produce a 1:1 projection of your range low and high, meaning, if you expect price to expand as much as it did from the range low to range high, then you can project a -1 and 2 on your Fib, and it would show you what ICT calls “symmetrical price”
Now, how are standard deviations relevant here?
Well, if you’ve been paying attention to ICT’s recent videos, you would’ve caught that he’s recently started using Standard Deviation levels on breakers.
So my brain got going while watching his video on ORGs, and I decided to place the fib on the ORG high and low and see what it’d produce.
The results were very interesting.
Using this same example, if we place our fib on the ORG High and Low, and add some projection levels, we can see that we rejected right at the -2 Standard Deviation Level.
---
You can see that I also marked out the EQ (Equilibrium, 50%, 0.5 of Fib) of the ORG. This is because we can use this level as a take profit level if we’re using an old ORG as our draw.
In days like these, where the gap formed was within a consolidation, and it continued to consolidate within the ORG zone that we extended, we can use the EQ in the same way we’d use an EQ for a range.
If it’s showing acceptance above the EQ, we are bullish, and expect the high of the ORG to be tapped, and vice versa.
---
Using The Indicator
Here’s where our indicator comes in play.
To avoid having to do all this work of zooming in and marking out the close and open of the respective ORG candles, we created the Opening Range Gap + Standard Deviations Indicator, with the help of our dedicated Star Clique coder, a1tmaniac.
With the ORG + STD DEV indicator, you will be able to view ORG’s and their projections on the ETH (Electronic Trading Hours) chart.
---
Features
Range Box
- Change the color of your Opening Range Gap to your liking
- Enable or disable the box from appearing using the checkbox
Range Midline
- Change the color of your Opening Range Gap Equilibrium
- Enable or disable the midline from appearing using the checkbox
Std. Dev
- Add whichever standard deviation levels you’d like.
- By default, the indicator comes with 0.5, 1, 1.5, and 2 standard deviation levels.
- Ensure that you add a comma ( , ) in between each standard deviation level
- Enable or disable the standard deviations from appearing using the opacity of the color (change to 0%)
Labels / Offset
- Adjust the offset of the label for the Standard Deviations
- Enable or disable the Labels from appearing using the checkbox
Time
- Adjust the time used for the indicators range
- If you’d like to use this for a Session or ICT Killzone instead, adjust the time
- Adjust the timezone used for the time referenced
- Options are UTC, US (UTC-4, New York Local Time) or UK (UTC+1, London Time)
- By default, the indicator is set to US

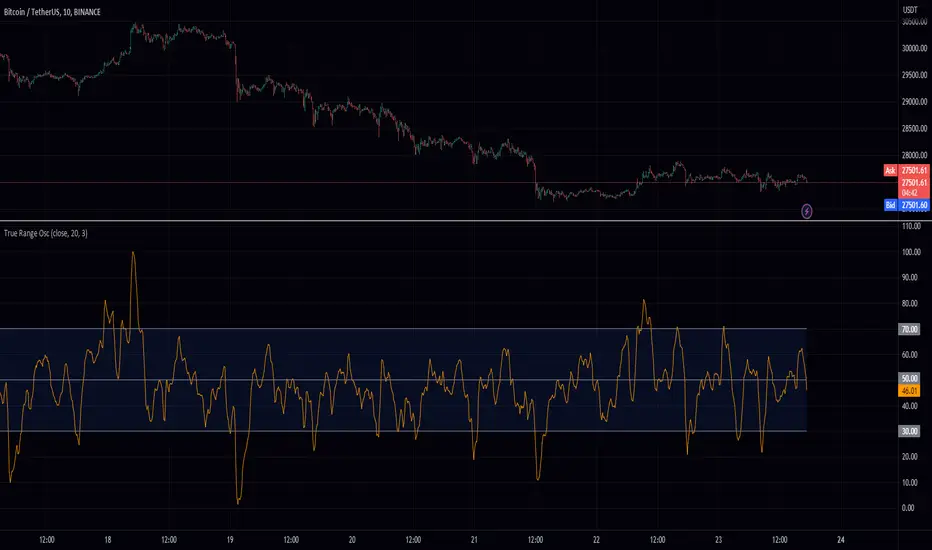
True Range OscHey fellow traders! I've just published a new indicator called the True Range Oscillator. It's designed to help you better understand price movements and volatility. The indicator calculates the average true range of the price data and uses a modified z-score-like approach to normalize it. The main difference is that it uses true range instead of standard deviation for normalization.
This oscillator identifies the highest and lowest values within a specified range, excluding any outliers based on standard deviations. It then scales the output between 0 and 100, so you can easily see how the current price action compares to its historical range. You can use the True Range Oscillator to spot potential trend reversals and overbought/oversold conditions.
Here are some features to explore:
Customize your price data source (open, high, low, or close).
Adjust the length and smoothing settings for the average true range calculation.
Find outliers with standard deviations, and tweak the outlier_level and dev_lookback options.
Visualize price action with plotted lines for the upper range (70), lower range (30), and center line (50), along with a shaded area between the upper and lower ranges for added clarity.
I hope you find this indicator useful in your trading journey!
Higher Time Frame Average True RangesPurpose: This script will help an options trader asses risk and determine good entry and exit strategies
Background Information: The true range is the greatest of: current high minus the current low; the absolute value of the current high minus the previous close; and the absolute value of the current low minus the previous close. The Average True Range (ATR) is a 14-day moving average of the true range. Traders use the ATR indicator to assess volatility in stocks and decide when to enter and exit trades. It is important to note the limitations of using True Range and ATR: These indications cannot tell you the direction of your options trade (call vs. put) and they cannot tell you whether a particular trend is about to reverse. However, it can be used to assess if volatility has peaked for a particular direction and time period.
How this script works: This indicator calculates true range for the daily (DTR), weekly (WTR), and monthly (MTR) time frames and compares it to the Average True Range (ATR) for each of those time frames (DATR, WATR, and MATR). The comparison is displayed into a colored table in the upper right-hand corner of the screen. When a daily, weekly, or monthly true range reaches 80% of its respective ATR, the row for that time frame will turn Orange indicating medium risk for staying in the trade. If the true range goes above 100% of the respective ATR, then the row will turn Red indicating high risk for staying in the trade. When the row for a time period turns red, volatility for the time period has likely peaked and traders should heavily consider taking profits. It is important to note these calculations start at different times for each time frame: Daily (Today’s Open), Weekly (Monday’s Open), Monthly (First of the Month’s Open). This means if it’s the 15th of the month then the Monthly True Range is being calculated for the trading days in the first half of the month (approximately 10 trade days).
The script also plots three sets of horizontal dotted lines to visually represent the ATR for each time period. Each set is generated by adding and subtracting the daily, weekly, and monthly ATRs from that time periods open price. For example, the weekly ATR is added and subtracted from Mondays open price to visually represent the true range for that week. The DATR is represented by red lines, the WATR is represented by the green lines, and the MATR is represented by the blue lines. These plots could also be used to assess risk as well.
How to use this script: Use the table to assess risk and determine potential exit strategies (Green=Low Risk, Orange=Medium Risk, Red=High Risk. Use the dotted lines to speculate what a stock’s price could be in a given time period (Daily=Red, Weekly=Green, and Monthly=Blue). And don’t forget the true range’s calculation and plots starts at the beginning of each time period!

_CM_BarRange_PercentileI know a Trader that went 18 months without a losing trade. This Trader averaged trading 700-800 contracts per month in the Futures markets.
The was not his only system but here were his rules.
He looked at the 60 minute bar and calculated the ranges of the bars over the last 3 months. IF the range of the Bar was Greater Than the 99th Percentile, He would Fade that move or take the trade in the opposite direction.
Thought process is If the Price Bar is Greater Than the 99th Percentile then typically the market reverses. This happens a lot of times at news events. If you’ve studied the markets long enough you know if a Nes based event causes a Huge Move, which we define as Greater than the 99th Percentile, the Market typically moves in the opposite direction.
***This is dependent on the Instrument your trading and the time frame your trading. Some Instruments and time frames this signals a continuation move.
I also added in the Low of the Range based on the 99th Percentile. Often times Low Range Bars…especially if they appear at the top of a swing move, or the bottom of a swing move…create a high probability entry once the High or Low of the bar is taken out in the opposite direction of the previous move…The Low Range bars show indecision after a strong move and create great reversal opportunities.
Works on All Time Frames…again depending on the instrument your trading.
On instruments that MOVE or have High Volatility like Crude and Oil you can get great signals on 1 minute bars.
***Code includes ability to pick ham many bars you want your Look Back Period To Be.
***You can change the percentages to use the 99th Percentile, or 95th percentile, etc…
***The Green Line is the Value of the High Range Percentile.
***The Red Line is the Value of the Low Range Percentile.
***Plots a Magenta Cross on the Red Line if the Range is Below the Low Range Percentile.
***Plots a yellow Cross on the Green Line if the Range is Greater Than the High Range Percentile.
***The Aqua line is the Midpoint of the Range. Or the Average Price Move.
***Colors the Price Bar Yellow if the Range exceeds the High Range Percentile.
***Colors The Bar Magenta if the Range is Less Than the Low Range Percentile
***All parameters can be turned on or off via Check Boxes in the Inputs Tab

ADR Daily & Session (Asia, London, NY) Range TrackerOVERVIEW:
The Daily & Session Range Tracker provides comprehensive range analysis for daily and intraday trading sessions (Asia, London, NY) . This indicator is essential for traders who need to understand market volatility and typical price movement ranges across different trading sessions.
KEY FEATURES:
• Daily Range Tracking: Tracks the daily candle range starting from 18:00 (6 PM), aligning with the institutional trading day open
• Session-Based Analysis: Monitors Asia (18:00-02:00), London (02:00-08:00), and NY (08:00-16:00) sessions
• Statistical Analysis: Displays Current, Average, and Median ranges for each period
• Customizable Lookback: Adjustable lookback period (1-20 days) for historical range calculation
• Clean Table Display: Organized data table positioned in the bottom-right corner
HOW TO USE:
1. Add the indicator to your chart
2. Adjust the lookback period to match your trading style (default: 10 days)
3. Customize session times if trading in a different timezone
4. Use the range data to set realistic profit targets and stop losses
5. Compare current range to average/median to gauge if price has room to move
SETTINGS:
• Lookback Period: Number of days to include in average/median calculations (1-20)
• Text Color: Customize the table text color for visibility
• Session Times: Adjust session start/end times for your timezone
PERFECT FOR:
✓ Day traders monitoring session volatility
✓ Scalpers setting realistic targets based on average ranges
✓ Swing traders understanding daily movement potential
✓ Risk management and position sizing decisions
NOTE: The daily range resets at 18:00 to align with institutional daily candle open times.

Universal Market Ranges█ OVERVIEW
Universal Market Ranges is a universal market indicator that, within a single tool, identifies trend direction and regime, shows price movement ranges relative to volatility, can be used as dynamic SL and TP levels, and offers optional signals generated separately for each zone.
The indicator is based on a smoothed moving average with an ATR-based significance filter and multi-level volatility bands, which organize the market into logical zones of increasing importance.
Instead of generating isolated signals, Universal Market Ranges provides full market context, allowing traders to make their own informed decisions.
█ CONCEPT
The core idea behind the indicator is full configurability, which allows it to be used for a wide range of trading purposes.
Depending on the settings and visibility of individual elements, Universal Market Ranges can function as:
- a complete trading system
- a clean trend indicator
- a single volatility channel
- a standalone filtered moving average
- a zone-based structure for position management (SL / TP)
By disabling selected bands, adjusting their multipliers, or modifying fill transparency, traders can tailor the indicator precisely to their trading style, market, and timeframe.
Moving Average Logic
The applied moving average is not classically weighted.
ATR acts here as a significance filter, determining whether a given price change is meaningful enough to affect the average.
When the price deviation from the MA exceeds a defined volatility threshold (ATR × multiplier), the moving average updates normally.
When price changes are too small and remain within market noise, the moving average remains unchanged.
As a result, the MA reacts only to significant price movements, ignoring minor fluctuations and consolidations.
█ ZONE STRUCTURE
- Trend Band (TB)
A channel used to define the trend regime.
- price breaking above the TB → trend shifts to bullish
- price breaking below the TB → trend shifts to bearish
The Trend Band can be visually disabled, while the trend logic continues to operate in the background.
- wider TB → less sensitive, fewer and later trend changes
- narrower TB → more sensitive, more frequent regime changes
- Inner Band (IB)
The primary zone of acceptable price deviation from the moving average.
- represents equilibrium and “comfortable” price movement
- Outer Band 1 (OB1)
A zone of clear market extension.
- first sign that price is moving away from equilibrium
- often used as a partial profit-taking level
- Outer Band 2 (OB2)
An extreme zone.
- very strong deviation from the moving average
- statistically rare price movements
- often marks the final phase of large impulses
█ FEATURES
Data Sources:
- Filtered moving average (SMA / EMA / RMA / WMA)
- ATR as the volatility measure for all zones
- Candle coloring based on the current trend regime
Signals (optional):
- Zone exit and return signals (IB / OB1 / OB2)
- Moving average cross in trend direction
- Trend regime change (TB breakout)
Visual Elements:
- Trend-based candle coloring
- Smooth fills between zones
- Labels with current price levels on the right side of the chart
Alerts:
- IB Breakout / Return
- OB1 & OB2 Exit / Return
- MA Cross in trend direction
- Trend Change (TB)
█ HOW TO USE
Adding the Indicator
Paste the code into the Pine Editor or search for
“Universal Market Ranges” on TradingView.
Key Settings:
- MA Length – moving average sensitivity
- ATR Length – band stability and width
- Minimum Deviation (ATR) – moving average update filter
→ lower values: MA updates more frequently but filters less noise
- Band Multipliers – define the significance of each zone
- MA Smoothing Type – determines the reaction character
█ USE CASES
Universal Market Ranges can be used for:
- trend trading – entries on trend regime changes
- defining dynamic SL and TP levels
- contrarian strategies – entries on price returns to zones
- analyzing price range and movement quality
Zone interpretation:
- price near the MA → market equilibrium
- price in OB1 → clear extension
- price in OB2 → extreme deviation from equilibrium
█ NOTES
- The indicator works on all instruments and timeframes
- Best results are achieved by adapting band multipliers to the market
- Can be combined with other technical analysis methods such as Fibonacci levels, FVG, and pivot levels
- This is not a signal-only system — it is a context-based analytical tool

Flout Ranges + STDVs [bilal]# Flout Ranges + STDVs
## What It Does
Automatically draws FLOUT, CBDR, and ASIA session ranges with standard deviation levels and highlight zones. Perfect for ICT-style trading and session-based strategies.
## Main Features
**📊 Session Ranges**
- FLOUT, CBDR, and ASIA ranges drawn automatically
- Works for both Indices and Forex (just toggle Forex Mode)
- Customizable colors and labels for each range
**📈 Standard Deviation Levels**
- Shows key STDV levels from your ranges
- FLOUT: -6 to +6 from midpoint
- CBDR/ASIA: 0 to 7 from range low
- Helps identify expansion targets and reversal zones
**🎯 Highlight Zones**
- Zone 1 (default 3.5-4.0 STDV): Common reversal area
- Zone 2 (default 5.5-6.0 STDV): Extended targets
- Shaded boxes make them easy to spot
- Automatically extends forward into London session
**📐 Smart Trendlines**
- Connects the open prices at key times
- Switches to X-pattern on trending FLOUT days
- Helps identify directional bias
## Quick Setup
1. Add indicator to your 1-5 minute chart
2. Toggle **Forex Mode** if trading forex (otherwise leave off for indices)
3. Turn on STDV lines for the ranges you want to see
4. Adjust highlight zones if needed (defaults work great)
## Why Use This?
- **Save Time**: No more manual drawing of ranges and levels
- **Stay Consistent**: Same levels calculated every session
- **Better Entries**: Use STDV zones for high-probability setups
- **Cleaner Charts**: Toggle what you need, hide what you don't
## Pro Tips
💡 Watch for reactions at 3.5-4.0 STDV zones - these are prime reversal areas
💡 Combine multiple ranges for allignements setups
---
*All times in New York timezone. Best used on 1-5 minute charts.*

ICT Sessions Ranges [SwissAlgo]ICT Session Ranges - ICT Liquidity Zones & Market Structure
OVERVIEW
This indicator identifies and visualizes key intraday trading sessions and liquidity zones based on Inner Circle Trader (ICT) methodology (AM, NY Lunch Raid, PM Session, London Raid). It tracks 'higher high' and 'lower low' price levels during specific time periods that may represent areas where market participants have placed orders (liquidity).
PURPOSE
The indicator helps traders observe:
Session-based price ranges during different market hours
Opening range gaps between market close and next day's open
Potential areas where liquidity may be concentrated and trigger price action
SESSIONS TRACKED
1. London Session (02:00-05:00 ET): Tracks price range during early London trading hours
2. AM Session (09:30-12:00 ET): Tracks price range during the morning New York session
3. NY Lunch Session (12:00-13:30 ET): Tracks price range during typical low-volume lunch period
4. PM Session (13:30-16:00 ET): Tracks price range during the afternoon New York session
CALCULATIONS
Session High/Low: The highest high and lowest low recorded during each active session period
Opening Range Gap: Calculated as the difference between the previous day's 16:00 close and the current day's 09:30 open
Gap Mitigation: A gap is considered mitigated when the price reaches 50% of the gap range
All times are based on America/New_York timezone (ET)
BACKGROUND INDICATORS
NY Trading Hours (09:30-16:00 ET): Optional gray background overlay
Asian Session (20:00-23:59 ET): Optional purple background overlay
VISUAL ELEMENTS
Horizontal lines mark session highs and lows
Subtle background boxes highlight each session range
Labels identify each session type
Orange shaded boxes indicate unmitigated opening range gaps
Dotted line at 50% gap level shows mitigation threshold
FEATURES
Toggle visibility for each session independently
Customizable colors for each session type
Automatic removal of mitigated gaps
All drawing objects use transparent backgrounds for chart clarity
ICT CONCEPTS
This tool relates to concepts discussed by Inner Circle Trader regarding liquidity pools, session-based analysis, and gap theory. The indicator assumes that session highs and lows may represent areas where liquidity is concentrated, and that opening range gaps may attract price until mitigated.
USAGE NOTES
Best used on intraday timeframes (1-15 minute charts)
All sessions are calculated based on actual price movement during specified time periods
Historical session data is preserved as new sessions develop
Gap detection only triggers at 09:30 ET market open
DISCLAIMER
This indicator is for educational and informational purposes only. It displays historical price levels and time-based calculations. Past performance of price levels is not indicative of future results. The identification of "liquidity zones" is a theoretical concept and does not guarantee that orders exist at these levels or that prices will react to them. Trading involves substantial risk of loss. Users should conduct their own analysis and risk assessment before making any trading decisions.
TIME ZONE
Set your timezone to: America/New_York (UTC-5)
