Opening Range Breakout Cloud Indicator by TenAMTraderOpening Range Breakout Cloud Indicator – by TenAMTrader
This indicator visually maps out the Opening Range of the trading day — the price high and low between a configurable start and end time (default: 9:30 AM–10:00 AM EST). It helps traders identify breakout levels, key intraday zones, and price behavior relative to the early range.
🔹 What It Shows:
Opening High, Low, and Midpoint lines for each day.
Clouds between the midpoint and high/low for visual clarity.
Optional Second Range (e.g., 9:30–9:45 AM) for more aggressive early signals.
Historical Ranges are preserved, allowing you to view previous days' levels on the chart.
Custom Alerts when price crosses the Opening High, Low, or Midpoint.
Full customization: colors, range times, and display toggles.
🔔 Use It For:
Spotting breakouts or rejections at key levels.
Finding early support/resistance zones.
Planning trades using intraday structure.
⚠️ Use this tool as part of a broader trading strategy. No indicator guarantees results — always trade at your own discretion.
Cerca negli script per "range"
ICT Dealing RangeICT Dealing Range
This indicator identifies and plots ICT (Inner Circle Trader) Dealing Ranges - key institutional areas where smart money accumulates or distributes positions before significant moves.
What is a Dealing Range?
A Dealing Range is a significant price area where institutional traders accumulate or distribute their positions. These ranges form through a specific sequence of price movements that indicate institutional order flow:
Bullish Dealing Range Sequence:
1. Initial High (H)
2. Initial Low (L)
3. Higher High (HH)
4. Lower Low (LL)
5. Break above HH (confirmation)
Bearish Dealing Range Sequence:
1. Initial Low (L)
2. Initial High (H)
3. Lower Low (LL)
4. Higher High (HH)
5. Break below LL (confirmation)
My Trading Strategy
Entry Methods:
1. Range Extreme Retests:
- After range formation, wait for price to return to either extreme
- Long entries at range bottom with stops below
- Short entries at range top with stops above
2. Mid-Line Strategy:
- Use the mid-line as a pivot point for reversals
- Long entries on mid-line bounce with stops below
- Short entries on mid-line rejection with stops above
Stop Loss Placement:
- When entering at extremes: Place stops beyond the mid
- When entering at mid-line: Place stops beyond the opposing extreme
- Always respect the structure's boundaries
Take Profit Targets:
- Minimum 2:1 Risk-Reward ratio
- For extreme entries: Target the opposite extreme
- For mid-line entries: Target the nearest extreme
Risk Management
- Never enter without a clear invalidation point
- Maintain minimum 2:1 RR ratio
- Consider market structure and higher timeframe context
Indicator Features
- Auto-detection of dealing range patterns
- Color-coded boxes (green for bullish, red for bearish)
- Optional mid-line display
- Customizable colors and styles
- Adjustable pivot lookback periods
Notes
This tool is based on ICT concepts but should be used in conjunction with other forms of analysis. The dealing range provides a framework for understanding institutional order flow, but proper risk management and market context are essential for successful trading.
Remember: The best trades often come from clean retests of these ranges after their initial formation. Patience in waiting for proper setups is key to successful implementation.

888 BOT #alerts█ 888 BOT #alerts (open source)
This is an Expert Advisor 'EA' or Automated trading script for ‘longs’ and ‘shorts’, which uses only a Take Profit or, in the worst case, a Stop Loss to close the trade.
It's a much improved version of the previous ‘Repanocha’. It doesn`t use 'Trailing Stop' or 'security ()' functions (although using a security function doesn`t mean that the script repaints) and all signals are confirmed, therefore the script doesn`t repaint in alert mode and is accurate in backtest mode.
Apart from the previous indicators, some more and other functions have been added for Stop-Loss, re-entry and leverage.
It uses 8 indicators, (many of you already know what they are, but in case there is someone new), these are the following:
1. Jurik Moving Average
It's a moving average created by Mark Jurik for professionals which eliminates the 'lag' or delay of the signal. It's better than other moving averages like EMA , DEMA , AMA or T3.
There are two ways to decrease noise using JMA . Increasing the 'LENGTH' parameter will cause JMA to move more slowly and therefore reduce noise at the expense of adding 'lag'
The 'JMA LENGTH', 'PHASE' and 'POWER' parameters offer a way to select the optimal balance between 'lag' and over boost.
Green: Bullish , Red: Bearish .
2. Range filter
Created by Donovan Wall, its function is to filter or eliminate noise and to better determine the price trend in the short term.
First, a uniform average price range 'SAMPLING PERIOD' is calculated for the filter base and multiplied by a specific quantity 'RANGE MULTIPLIER'.
The filter is then calculated by adjusting price movements that do not exceed the specified range.
Finally, the target ranges are plotted to show the prices that will trigger the filter movement.
Green: Bullish , Red: Bearish .
3. Average Directional Index ( ADX Classic) and ( ADX Masanakamura)
It's an indicator designed by Welles Wilder to measure the strength and direction of the market trend. The price movement is strong when the ADX has a positive slope and is above a certain minimum level 'ADX THRESHOLD' and for a given period 'ADX LENGTH'.
The green color of the bars indicates that the trend is bullish and that the ADX is above the level established by the threshold.
The red color of the bars indicates that the trend is down and that the ADX is above the threshold level.
The orange color of the bars indicates that the price is not strong and will surely lateralize.
You can choose between the classic option and the one created by a certain 'Masanakamura'. The main difference between the two is that in the first it uses RMA () and in the second SMA () in its calculation.
4. Parabolic SAR
This indicator, also created by Welles Wilder, places points that help define a trend. The Parabolic SAR can follow the price above or below, the peculiarity that it offers is that when the price touches the indicator, it jumps to the other side of the price (if the Parabolic SAR was below the price it jumps up and vice versa) to a distance predetermined by the indicator. At this time the indicator continues to follow the price, reducing the distance with each candle until it is finally touched again by the price and the process starts again. This procedure explains the name of the indicator: the Parabolic SAR follows the price generating a characteristic parabolic shape, when the price touches it, stops and turns ( SAR is the acronym for 'stop and reverse'), giving rise to a new cycle. When the points are below the price, the trend is up, while the points above the price indicate a downward trend.
5. RSI with Volume
This indicator was created by LazyBear from the popular RSI .
The RSI is an oscillator-type indicator used in technical analysis and also created by Welles Wilder that shows the strength of the price by comparing individual movements up or down in successive closing prices.
LazyBear added a volume parameter that makes it more accurate to the market movement.
A good way to use RSI is by considering the 50 'RSI CENTER LINE' centerline. When the oscillator is above, the trend is bullish and when it is below, the trend is bearish .
6. Moving Average Convergence Divergence ( MACD ) and ( MAC-Z )
It was created by Gerald Appel. Subsequently, the histogram was added to anticipate the crossing of MA. Broadly speaking, we can say that the MACD is an oscillator consisting of two moving averages that rotate around the zero line. The MACD line is the difference between a short moving average 'MACD FAST MA LENGTH' and a long moving average 'MACD SLOW MA LENGTH'. It's an indicator that allows us to have a reference on the trend of the asset on which it is operating, thus generating market entry and exit signals.
We can talk about a bull market when the MACD histogram is above the zero line, along with the signal line, while we are talking about a bear market when the MACD histogram is below the zero line.
There is the option of using the MAC-Z indicator created by LazyBear, which according to its author is more effective, by using the parameter VWAP ( volume weighted average price ) 'Z-VWAP LENGTH' together with a standard deviation 'STDEV LENGTH' in its calculation.
7. Volume Condition
Volume indicates the number of participants in this war between bulls and bears, the more volume the more likely the price will move in favor of the trend. A low trading volume indicates a lower number of participants and interest in the instrument in question. Low volumes may reveal weakness behind a price movement.
With this condition, those signals whose volume is less than the volume SMA for a period 'SMA VOLUME LENGTH' multiplied by a factor 'VOLUME FACTOR' are filtered. In addition, it determines the leverage used, the more volume , the more participants, the more probability that the price will move in our favor, that is, we can use more leverage. The leverage in this script is determined by how many times the volume is above the SMA line.
The maximum leverage is 8.
8. Bollinger Bands
This indicator was created by John Bollinger and consists of three bands that are drawn superimposed on the price evolution graph.
The central band is a moving average, normally a simple moving average calculated with 20 periods is used. ('BB LENGTH' Number of periods of the moving average)
The upper band is calculated by adding the value of the simple moving average X times the standard deviation of the moving average. ('BB MULTIPLIER' Number of times the standard deviation of the moving average)
The lower band is calculated by subtracting the simple moving average X times the standard deviation of the moving average.
the band between the upper and lower bands contains, statistically, almost 90% of the possible price variations, which means that any movement of the price outside the bands has special relevance.
In practical terms, Bollinger bands behave as if they were an elastic band so that, if the price touches them, it has a high probability of bouncing.
Sometimes, after the entry order is filled, the price is returned to the opposite side. If price touch the Bollinger band in the same previous conditions, another order is filled in the same direction of the position to improve the average entry price, (% MINIMUM BETTER PRICE ': Minimum price for the re-entry to be executed and that is better than the price of the previous position in a given %) in this way we give the trade a chance that the Take Profit is executed before. The downside is that the position is doubled in size. 'ACTIVATE DIVIDE TP': Divide the size of the TP in half. More probability of the trade closing but less profit.
█ STOP LOSS and RISK MANAGEMENT.
A good risk management is what can make your equity go up or be liquidated.
The % risk is the percentage of our capital that we are willing to lose by operation. This is recommended to be between 1-5%.
% Risk: (% Stop Loss x % Equity per trade x Leverage) / 100
First the strategy is calculated with Stop Loss, then the risk per operation is determined and from there, the amount per operation is calculated and not vice versa.
In this script you can use a normal Stop Loss or one according to the ATR. Also activate the option to trigger it earlier if the risk percentage is reached. '% RISK ALLOWED' wich is calculated according with: '%EQUITY ON EACH ENTRY'. Only works with Stop Loss on 'NORMAL' or 'BOTH' mode.
'STOP LOSS CONFIRMED': The Stop Loss is only activated if the closing of the previous bar is in the loss limit condition. It's useful to prevent the SL from triggering when they do a ‘pump’ to sweep Stops and then return the price to the previous state.
█ ALERTS
There is an alert for each leverage, therefore a maximum of 8 alerts can be set for 'long' and 8 for 'short', plus an alert to close the trade with Take Profit or Stop Loss in market mode. You can also place Take Profit limit and Stop Loss limit orders a few seconds after filling the position entry order.
- 'MAXIMUM LEVERAGE': It is the maximum allowed multiplier of the % quantity entered on each entry for 1X according to the volume condition.
- 'ADVANCE ALERTS': There is always a time delay from when the alert is triggered until it reaches the exchange and can be between 1-15 seconds. With this parameter, you can advance the alert by the necessary seconds to activate it earlier. In this way it can be synchronized with the exchange so that the execution time of the entry order to the position coincides with the opening of the bar.
The settings are for Bitcoin at Binance Futures (BTC: USDTPERP) in 15 minutes.
For other pairs and other timeframes, the settings have to be adjusted again. And within a month, the settings will be different because we all know the market and the trend are changing.

888 BOT #backtest█ 888 BOT #backtest (open source)
This is an Expert Advisor 'EA' or Automated trading script for ‘longs’ and ‘shorts’, which uses only a Take Profit or, in the worst case, a Stop Loss to close the trade.
It's a much improved version of the previous ‘Repanocha’. It doesn`t use 'Trailing Stop' or 'security()' functions (although using a security function doesn`t mean that the script repaints) and all signals are confirmed, therefore the script doesn`t repaint in alert mode and is accurate in backtest mode.
Apart from the previous indicators, some more and other functions have been added for Stop-Loss, re-entry and leverage.
It uses 8 indicators, (many of you already know what they are, but in case there is someone new), these are the following:
1. Jurik Moving Average
It's a moving average created by Mark Jurik for professionals which eliminates the 'lag' or delay of the signal. It's better than other moving averages like EMA , DEMA , AMA or T3.
There are two ways to decrease noise using JMA . Increasing the 'LENGTH' parameter will cause JMA to move more slowly and therefore reduce noise at the expense of adding 'lag'
The 'JMA LENGTH', 'PHASE' and 'POWER' parameters offer a way to select the optimal balance between 'lag' and over boost.
Green: Bullish , Red: Bearish .
2. Range filter
Created by Donovan Wall, its function is to filter or eliminate noise and to better determine the price trend in the short term.
First, a uniform average price range 'SAMPLING PERIOD' is calculated for the filter base and multiplied by a specific quantity 'RANGE MULTIPLIER'.
The filter is then calculated by adjusting price movements that do not exceed the specified range.
Finally, the target ranges are plotted to show the prices that will trigger the filter movement.
Green: Bullish , Red: Bearish .
3. Average Directional Index ( ADX Classic) and ( ADX Masanakamura)
It's an indicator designed by Welles Wilder to measure the strength and direction of the market trend. The price movement is strong when the ADX has a positive slope and is above a certain minimum level 'ADX THRESHOLD' and for a given period 'ADX LENGTH'.
The green color of the bars indicates that the trend is bullish and that the ADX is above the level established by the threshold.
The red color of the bars indicates that the trend is down and that the ADX is above the threshold level.
The orange color of the bars indicates that the price is not strong and will surely lateralize.
You can choose between the classic option and the one created by a certain 'Masanakamura'. The main difference between the two is that in the first it uses RMA () and in the second SMA () in its calculation.
4. Parabolic SAR
This indicator, also created by Welles Wilder, places points that help define a trend. The Parabolic SAR can follow the price above or below, the peculiarity that it offers is that when the price touches the indicator, it jumps to the other side of the price (if the Parabolic SAR was below the price it jumps up and vice versa) to a distance predetermined by the indicator. At this time the indicator continues to follow the price, reducing the distance with each candle until it is finally touched again by the price and the process starts again. This procedure explains the name of the indicator: the Parabolic SAR follows the price generating a characteristic parabolic shape, when the price touches it, stops and turns ( SAR is the acronym for 'stop and reverse'), giving rise to a new cycle. When the points are below the price, the trend is up, while the points above the price indicate a downward trend.
5. RSI with Volume
This indicator was created by LazyBear from the popular RSI .
The RSI is an oscillator-type indicator used in technical analysis and also created by Welles Wilder that shows the strength of the price by comparing individual movements up or down in successive closing prices.
LazyBear added a volume parameter that makes it more accurate to the market movement.
A good way to use RSI is by considering the 50 'RSI CENTER LINE' centerline. When the oscillator is above, the trend is bullish and when it is below, the trend is bearish .
6. Moving Average Convergence Divergence ( MACD ) and ( MAC-Z )
It was created by Gerald Appel. Subsequently, the histogram was added to anticipate the crossing of MA. Broadly speaking, we can say that the MACD is an oscillator consisting of two moving averages that rotate around the zero line. The MACD line is the difference between a short moving average 'MACD FAST MA LENGTH' and a long moving average 'MACD SLOW MA LENGTH'. It's an indicator that allows us to have a reference on the trend of the asset on which it is operating, thus generating market entry and exit signals.
We can talk about a bull market when the MACD histogram is above the zero line, along with the signal line, while we are talking about a bear market when the MACD histogram is below the zero line.
There is the option of using the MAC-Z indicator created by LazyBear, which according to its author is more effective, by using the parameter VWAP ( volume weighted average price ) 'Z-VWAP LENGTH' together with a standard deviation 'STDEV LENGTH' in its calculation.
7. Volume Condition
Volume indicates the number of participants in this war between bulls and bears, the more volume the more likely the price will move in favor of the trend. A low trading volume indicates a lower number of participants and interest in the instrument in question. Low volumes may reveal weakness behind a price movement.
With this condition, those signals whose volume is less than the volume SMA for a period 'SMA VOLUME LENGTH' multiplied by a factor 'VOLUME FACTOR' are filtered. In addition, it determines the leverage used, the more volume , the more participants, the more probability that the price will move in our favor, that is, we can use more leverage. The leverage in this script is determined by how many times the volume is above the SMA line.
The maximum leverage is 8.
8. Bollinger Bands
This indicator was created by John Bollinger and consists of three bands that are drawn superimposed on the price evolution graph.
The central band is a moving average, normally a simple moving average calculated with 20 periods is used. ('BB LENGTH' Number of periods of the moving average)
The upper band is calculated by adding the value of the simple moving average X times the standard deviation of the moving average. ('BB MULTIPLIER' Number of times the standard deviation of the moving average)
The lower band is calculated by subtracting the simple moving average X times the standard deviation of the moving average.
the band between the upper and lower bands contains, statistically, almost 90% of the possible price variations, which means that any movement of the price outside the bands has special relevance.
In practical terms, Bollinger bands behave as if they were an elastic band so that, if the price touches them, it has a high probability of bouncing.
Sometimes, after the entry order is filled, the price is returned to the opposite side. If price touch the Bollinger band in the same previous conditions, another order is filled in the same direction of the position to improve the average entry price, (% MINIMUM BETTER PRICE ': Minimum price for the re-entry to be executed and that is better than the price of the previous position in a given %) in this way we give the trade a chance that the Take Profit is executed before. The downside is that the position is doubled in size. 'ACTIVATE DIVIDE TP': Divide the size of the TP in half. More probability of the trade closing but less profit.
█ STOP LOSS and RISK MANAGEMENT.
A good risk management is what can make your equity go up or be liquidated.
The % risk is the percentage of our capital that we are willing to lose by operation. This is recommended to be between 1-5%.
% Risk: (% Stop Loss x % Equity per trade x Leverage) / 100
First the strategy is calculated with Stop Loss, then the risk per operation is determined and from there, the amount per operation is calculated and not vice versa.
In this script you can use a normal Stop Loss or one according to the ATR. Also activate the option to trigger it earlier if the risk percentage is reached. '% RISK ALLOWED'
'STOP LOSS CONFIRMED': The Stop Loss is only activated if the closing of the previous bar is in the loss limit condition. It's useful to prevent the SL from triggering when they do a ‘pump’ to sweep Stops and then return the price to the previous state.
█ BACKTEST
The objective of the Backtest is to evaluate the effectiveness of our strategy. A good Backtest is determined by some parameters such as:
- RECOVERY FACTOR: It consists of dividing the 'net profit' by the 'drawdown’. An excellent trading system has a recovery factor of 10 or more; that is, it generates 10 times more net profit than drawdown.
- PROFIT FACTOR: The ‘Profit Factor’ is another popular measure of system performance. It's as simple as dividing what win trades earn by what loser trades lose. If the strategy is profitable then by definition the 'Profit Factor' is going to be greater than 1. Strategies that are not profitable produce profit factors less than one. A good system has a profit factor of 2 or more. The good thing about the ‘Profit Factor’ is that it tells us what we are going to earn for each dollar we lose. A profit factor of 2.5 tells us that for every dollar we lose operating we will earn 2.5.
- SHARPE: (Return system - Return without risk) / Deviation of returns.
When the variations of gains and losses are very high, the deviation is very high and that leads to a very poor ‘Sharpe’ ratio. If the operations are very close to the average (little deviation) the result is a fairly high 'Sharpe' ratio. If a strategy has a 'Sharpe' ratio greater than 1 it is a good strategy. If it has a 'Sharpe' ratio greater than 2, it is excellent. If it has a ‘Sharpe’ ratio less than 1 then we don't know if it is good or bad, we have to look at other parameters.
- MATHEMATICAL EXPECTATION: (% winning trades X average profit) + (% losing trades X average loss).
To earn money with a Trading system, it is not necessary to win all the operations, what is really important is the final result of the operation. A Trading system has to have positive mathematical expectation as is the case with this script: ME = (0.87 x 30.74$) - (0.13 x 56.16$) = (26.74 - 7.30) = 19.44$ > 0
The game of roulette, for example, has negative mathematical expectation for the player, it can have positive winning streaks, but in the long term, if you continue playing you will end up losing, and casinos know this very well.
PARAMETERS
'BACKTEST DAYS': Number of days back of historical data for the calculation of the Backtest.
'ENTRY TYPE': For '% EQUITY' if you have $ 10,000 of capital and select 7.5%, for example, your entry would be $ 750 without leverage. If you select CONTRACTS for the 'BTCUSDT' pair, for example, it would be the amount in 'Bitcoins' and if you select 'CASH' it would be the amount in $ dollars.
'QUANTITY (LEVERAGE 1X)': The amount for an entry with X1 leverage according to the previous section.
'MAXIMUM LEVERAGE': It's the maximum allowed multiplier of the quantity entered in the previous section according to the volume condition.
The settings are for Bitcoin at Binance Futures (BTC: USDTPERP) in 15 minutes.
For other pairs and other timeframes, the settings have to be adjusted again. And within a month, the settings will be different because we all know the market and the trend are changing.

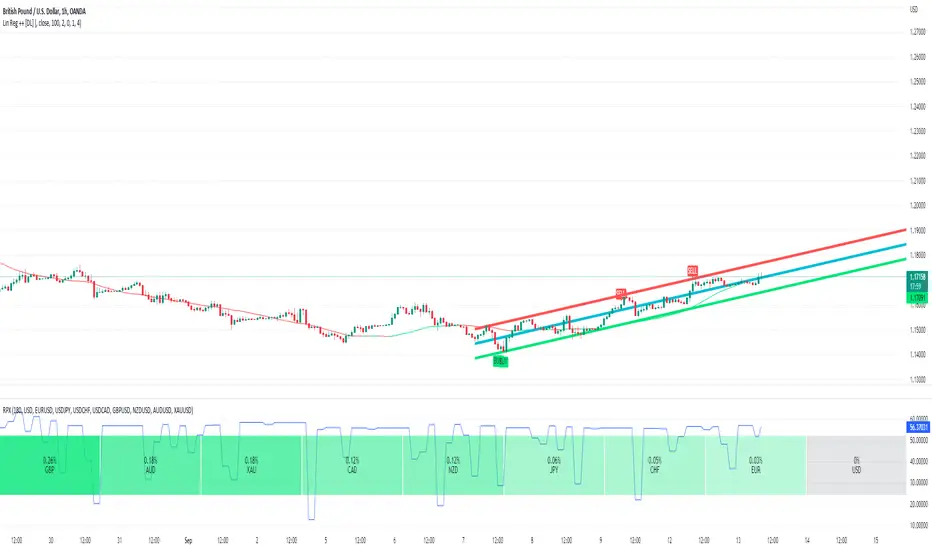
Linear Regression ++Due to public demand
Linear Regression Formula
Scraped Calculation With Alerts
Here is the Linear Regression Script For traders Who love rich features
Features
++ Multi time frame -> Source Regression from a different Chart
++ Customized Colors -> This includes the pine lines
++ Smoothing -> Allow Filtered Regression; Note: Using 1 Defaults to the original line. The default is 1
++ Alerts On Channel/Range Crossing
Usage
++ Use this for BreakOuts and Reversals
++ This Script is not to be used Independently
Risks
Please note, this script is the likes of Bollinger bands and poses a risk of falling in a trend range.
Signals may Keep running on the same direction while the market is reversing.
Requests
If you have any feature requests, comment below or dm me. I will answer when i can.
Feel free to utilize this on your chart and share your ideas
For developers who want to use this on their chart, Please use this script
The original formula for calculation is posted there
❤❤❤ I hope you love this. From my heart! ❤❤❤
Traded Range & True ATRBlack line = Trade Range from the last X periods.
Red Line = 61.8% of black line value.
Green bar = The current trade period range.
Default Value = 21 (21 days = I business month)
Generally speaking, a stock moves approximately the same value daily. Knowing the approximate value it likes to stay within calms the nerves when you see retracement of price occuring.
IE. Price average = 1.00 in a day. It move .75 within first hour then retraces in the opposite direction. There are still hours left in the trade day, so it is trading in its value range in order to not over extend itself.
This differs in calculation from the Wells Wilder version as it smooths out jumps and only examines the ranges between high and low.
A good rule of thumb is.
Stop Loss = Entry Price +/- (ATR * 1.5)
Take Profit = (1) Entry Price +/- ATR - 50% exit (Set Trailing Stop @ Entry Value), (2) Entry Price +/- ATR * 2 (50% of remaining).

3BBands (3 Spirolinas)The script combines 3 single Bollinger bands into one script for easy plotting and range modification. It can be used for analyzing a market with multiple time frames and ranges using Fibonacci series as the range.

Ultimate Overnight Trading Range + Levels (day, week, month) Define your Ultimate Overnight Trading Range:
~ Overnight Range Features ~
Three modes:
1. Default Mode (18:00 EST to 9:30 EST Open):
- Tracks the high and low from 18:00 EST until 9:30 EST market open
- Uses 5-minute candle data for precise boundary detection
2. Custom Time Range:
- Define your own start and end times
- Select from 14 major time zones
3. Custom Candle Selection:
- Select specific candles from 4-hour, 1-hour, or 30-minute timeframes
- Choose which candles define your overnight range - example: 22:00 and 2:00 EST 4-hr candle
- Use High/Low or Open/Close as your price source
~ Previous Period Levels ~
Automatically plots Open, Close, High, and Low from:
Previous Month
Previous Week
Previous Day
Toggle on/off whatever you want of course. Extend lines left and right etc.
Alerts:
You can set alerts on any of the plotted levels: Click on the indicator settings and select "Add Alert on..."
Configuring Overnight Range
Mode 1: Default (22:00 EST to Open)
- Simply select this mode—no additional configuration needed. The indicator will automatically track the overnight session from 22:00 EST until 9:30 EST.
Mode 2: Custom Time Range
- Select "Custom Time Range" from the Mode dropdown
- Choose your timezone from the list
- Set your desired Start Hour and Start Minute
- Set your desired End Hour and End Minute
Mode 3: Custom Candle Selection
- Select specific candles from 4-hour, 1-hour, or 30-minute timeframes
- Choose which candles define your overnight range - example: 22:00 and 2:00 EST 4-hr candle
- Use High/Low or Open/Close as your price source
Please let me know if any corrections or changes are needed. Thanks! :)

Session Range Boxes(MTF)📦 Indicator Name
Session Range Boxes (MTF)
Multi-Timeframe Directional Session Range Visualization
📘 Description
Session Range Boxes (MTF) is a multi-timeframe market structure tool that visually highlights price range behavior across different time sessions using clean, directional range boxes.
Each box represents the High–Low range of a completed or live session, automatically colored based on directional bias:
🟢 Bullish → Session Close > Session Open
🔴 Bearish → Session Close < Session Open
⚪ Neutral → Session Close = Session Open
This allows traders to instantly identify trend strength, balance zones, volatility expansion, and key support/resistance areas across multiple timeframes — all on a single chart.
🔍 What This Indicator Shows
For every enabled timeframe, the indicator:
Draws a range box from session open to session close
Continuously updates live session High & Low
Locks the final color once the session completes
Keeps historical boxes for structure and context
Supported timeframes:
Quarterly
Half-Yearly
Yearly
Monthly
Weekly
Daily
Hourly
30-Minute
15-Minute
5-Minute
⚙️ Default Behavior
By default, the indicator enables:
Weekly
Daily
Hourly
This default setup is intentionally chosen to suit most traders and provides:
Higher-timeframe structure (Weekly)
Swing context (Daily)
Intraday execution levels (Hourly)
🧠 How to Use It Effectively
📈 Higher-Timeframe Analysis (Swing / Positional Trading)
Recommended combinations:
Weekly + Daily
Monthly + Weekly
Use cases:
Identify dominant market bias
Spot compression vs expansion
Define higher-timeframe support & resistance zones
⚡ Intraday Trading (Day Trading)
Recommended combinations:
Daily + Hourly
Hourly + 30-Minute
Use cases:
Track intraday range development
Identify directional day types
Trade breakouts, rejections, or mean-reversion within session ranges
🚀 Scalping & Precision Entries
Recommended combinations:
Hourly + 15-Minute
30-Minute + 5-Minute
Use cases:
Fine-tune entries within larger session ranges
Align lower-timeframe trades with higher-timeframe bias
Spot micro range expansion and contraction
🎨 Customization Options
Bullish / Bearish / Neutral colors
Box fill transparency
Border transparency & color
Maximum historical boxes per timeframe
This allows you to keep charts clean, lightweight, and performance-friendly.
💡 Best Practices
Avoid enabling too many timeframes at once — clarity beats clutter
Use higher-timeframe boxes for bias, lower-timeframe boxes for entries
Combine with:
Market structure
Volume
VWAP
Liquidity concepts
Price action confirmation
Session Range Boxes (MTF) is a clean, powerful visual tool designed to help traders:
Understand session-based price behavior
Align trades across timeframes
Improve structure awareness without clutter
Whether you are a scalper, day trader, or swing trader, this indicator adapts seamlessly to your workflow.

Opening Range Break LRSThis script is designed for a trend-following, opening range breakout strategy. The main idea is to only trade breakouts that happen in the same direction as the short-term trend, which the script identifies using a linear regression slope.
1. Identify the Short-Term Trend
This is the first and most important step. The script does this for you using the Linear Regression and the bar coloring.
• If the bars are colored BLUE: The linear regression slope is positive. This means the script considers the short-term trend to be UP. A trader using this script would only look for long (buy) trades.
• If the bars are colored YELLOW: The linear regression slope is negative. This means the script considers the short-term trend to be DOWN. A trader using this script would only look for short (sell) trades.
This filter is designed to prevent you from trading a "false breakout" against the immediate momentum.
2. Watch the Opening Ranges Form
At the start of the trading session (8:30 AM by default), the script will begin drawing boxes for the 5, 15, 30, and 60-minute opening ranges you've enabled.
• The 5-minute box (e.g., gray) will be set after the 8:30 - 8:35 period.
• The 15-minute box (e.g., blue) will be set after the 8:30 - 8:45 period.
• ...and so on.
These boxes, which extend for the rest of the day, represent the key high and low levels established at the open. The "Live Box Extension" input simply keeps the right edge of the box a few bars away from the current price so you can see it clearly.
3. Look for a Filtered Breakout Signal
This is where the trend filter (Step 1) and the range boxes (Step 2) come together.
Bullish Trade Example (Long):
1. A trader sees the bars are colored BLUE (uptrend). They are now only looking for a break above one of the ORB highs.
2. They will ignore any break below the ORB lows, as that would be trading against the trend filter.
3. The price moves up and finally closes above the 15-minute ORB high.
4. The script will plot a green "Break 15" label. This is the trader's signal to enter a long trade.
Bearish Trade Example (Short):
1. A trader sees the bars are colored YELLOW (downtrend). They are now only looking for a break below one of the ORB lows.
2. They will ignore any break above the ORB highs.
3. The price moves down and closes below the 5-minute ORB low.
4. The script will plot a red "Break 5" label. This is the trader's signal to enter a short trade.
4. Use Multiple Timeframes for Context
The real power of this script is seeing all the ranges at once. A trader wouldn't just trade them in isolation.
• Confirmation: A "Break 5" signal is a quick, early signal. But if the price also breaks the "15" and "30" minute highs, it signals much stronger bullish consensus, which might encourage the trader to hold the trade longer.
• Support & Resistance: The other ORB levels act as a map for the day.
o As Targets: If a trader takes a "Break 15" long signal, the 30-minute ORB high and 60-minute ORB high become logical profit targets.
o As Warning Signs: If the price gives a "Break 5" long signal but is struggling right under the 15-minute high, a trader might wait for that 15-minute level to break before entering, seeing it as a key resistance level.
Summary: A Trader's Workflow
1. Morning (8:30 AM): Watch the script. What color are the bars? (Blue = longs only, Yellow = shorts only).
2. Wait: Let the 5, 15, 30, and 60-minute ranges form. The boxes will be drawn on the chart.
3. Execute: Wait for a "Break" signal (a label) that matches your trend direction.
4. Manage: Use the other ORB levels as potential profit targets or as confirmation of the move's strength.
5. Single Signal: The "Single Signal Only" input, if checked, ensures they only get one signal per timeframe (e.g., one "Break 15" long, and that's it for the day), which helps prevent over-trading in choppy conditions.

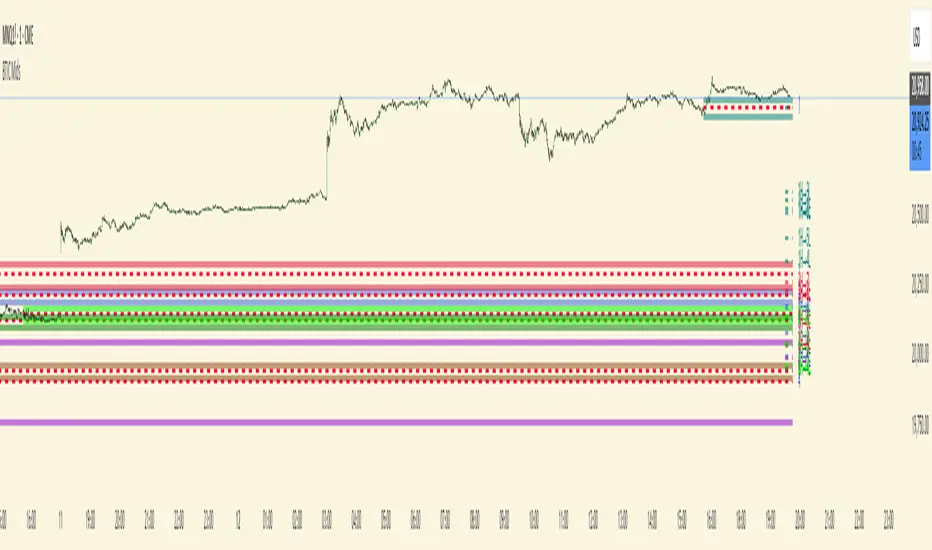
GARCH Range PredictorThis was inspired by deltatrendtrading's video on GARCH models to predict daily trading ranges and identify favorable trading conditions. Based on advanced volatility forecasting techniques, it predicts whether a trading day's true range will exceed a threshold, helping traders decide when to trade or skip a session.
Key Features
GARCH(1,1) Volatility Modeling: Uses log-transformed true ranges with exponential moving average centering
Forward-Looking Predictions: Makes predictions at session start before the day unfolds
Dynamic or Static Thresholds: Choose between fixed dollar thresholds or adaptive 20-day averages
Accuracy Tracking: Monitors prediction accuracy with overall and recent (20-day) hit rates
Visual Session Boxes: Colors trading sessions green (trade) or red (skip) based on predictions
Real-Time Statistics: Displays current predictions, thresholds, and performance metrics
How It Works
Data Transformation: Log-transforms daily true ranges and centers them using an EMA
Variance Modeling: Updates GARCH variance using: σ²ₜ = ω + α(residual²) + β(σ²ₜ₋₁)
Prediction Generation: Back-transforms log predictions to dollar values
Signal Generation: Compares predictions to threshold to generate trade/skip signals
Performance Tracking: Validates predictions against actual outcomes
Parameters
GARCH Parameters (ω, α, β): Control volatility persistence and mean reversion
EMA Period: Smoothing period for log range centering
Threshold Settings: Static dollar amount or dynamic multiplier of recent averages
Session Time: Define regular trading hours for analysis
Best Use Cases
Breakout and momentum strategies that perform better on high-range days
Risk management by avoiding low-volatility sessions
Futures day trading (optimized for MNQ/NQ detection)
Any strategy where daily range impacts profitability
Important Notes
Requires 5+ sessions for initialization and warm-up
Accuracy depends heavily on proper parameter tuning for your specific instrument
Default parameters may need adjustment for different markets
Monitor the hit rate to validate effectiveness on your timeframe

Script_Algo - ORB Strategy with Filters🔍 Core Concept: This strategy combines three powerful technical analysis tools: Range Breakout, the SuperTrend indicator, and a volume filter. Additionally, it features precise customization of the number of candles used to construct the breakout range, enabling optimized performance for specific assets.
🎯 How It Works:
The strategy defines a trading range at the beginning of the trading session based on a selected number of candles.
It waits for a breakout above the upper or below the lower boundary of this range, requiring a candle close.
It filters signals using the SuperTrend indicator for trend confirmation.
It utilizes trading volume to filter out false breakouts.
⚡ Strategy Features
📈 Entry Points:
Long: Candle close above the upper range boundary + SuperTrend confirmation
Short: Candle close below the lower range boundary + SuperTrend confirmation
🛡️ Risk Management:
Stop-Loss: Set at the opposite range boundary.
Take-Profit: Calculated based on a risk/reward ratio (3:1 by default).
Position Size: 10 contracts (configurable).
⚠️ IMPORTANT SETTINGS
🕐 Time Parameters:
Set the correct time and time zone!
❕ATTENTION: The strategy works ONLY with correct time settings! Set the time corresponding to your location and trading session.
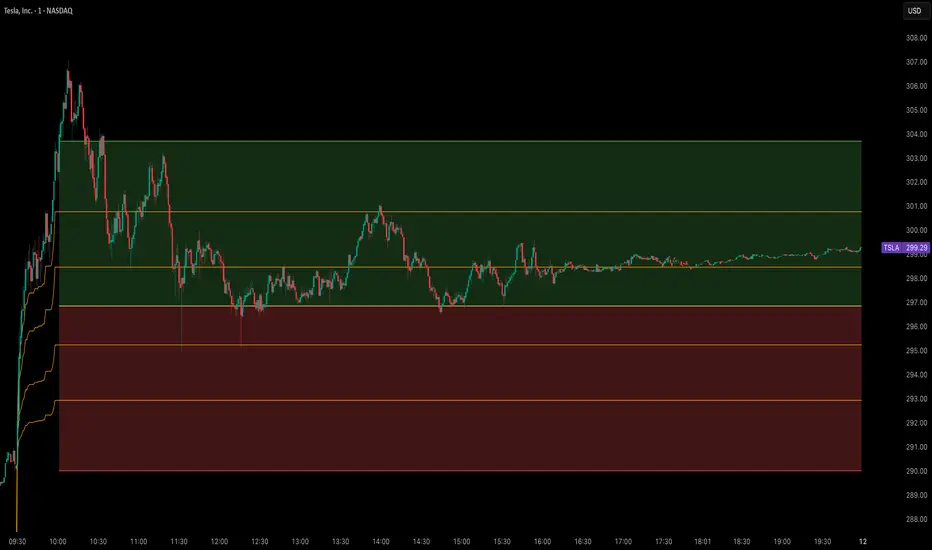
📊 This strategy is optimized for trading TESLA stock!
Parameters are tailored to TESLA's volatility, and trading volumes are adequate for signal filtering. Trading time corresponds to the American session.
📈 If you look at the backtesting results, you can see that the strategy could potentially have generated about 70 percent profit on Tesla stock over six months on 5m timeframe. However, this does not guarantee that results will be repeated in the future; remain vigilant.
⚠️ For other assets, the following is required:
Testing and parameter optimization
Adjustment of time intervals and the number of candles forming the range
Calibration of stop-loss and take-profit levels
⚠️ Limitations and Drawbacks
🔗 Automation Constraints:
❌ Cannot be directly connected via Webhook to CFD brokers!
Additional IT solutions are required for automation, thus only manual trading based on signals is possible.
📉 Risk Management:
Do not risk more than 2-3% of your account per trade.
Test on historical data before live use.
Start with a demo account.
💪 Strategy Advantages
✅ Combined approach – multiple signal filters
✅ Clear entry and exit rules
✅ Visual signals on the chart
✅ Volume-based false breakout filtering
✅ Automatic position management
🎯 Usage Recommendations
Always test the strategy on historical data.
Start with small trading volumes.
Ensure time settings are correct.
Adapt parameters to current market volatility.
Use only for stocks – futures and Forex require adaptation.
📚 Suitable Timeframes - M1-M15
Only highly liquid stocks
🍀 I wish all subscribers good luck in trading and steady profits!
📈 May your charts move in the right direction!
⚠️ Remember: Trading involves risk. Do not invest money you cannot afford to lose!

Opening Range v3 (Dynamic)Opening Range Signals v3 (Dynamic) - Indicator Guide
Created by: MecarderoAurum
Why This Indicator Exists: An Overview
The "Opening Range Signals" indicator is a sophisticated tool designed for day traders who focus their strategy on the price action that unfolds during the Regular Trading Hours (RTH) of the New York session (09:30 - 16:00 ET). The opening period of the market, often called the "initial balance," is a critical time where institutions and traders establish the early high and low for the day. Trading the breakout of this range is a classic and effective strategy, but it's often plagued by false moves and "head fakes."
This indicator was built to solve that problem. It not only identifies the initial range but also incorporates a powerful dynamic expansion feature. This allows the indicator to intelligently adapt to early session volatility, filter out false breakouts, and establish more reliable support and resistance levels for the rest of the trading day. It provides a clear, visual framework for executing opening range strategies with more confidence.
Key Features & How to Use Them
1. Customizable Opening Range
This is the foundation of the indicator. It draws the high and low of the initial trading period on your chart.
What it does: Establishes the initial support and resistance levels for the day.
How to use it: In the settings under "Time Settings," you can set the "Opening Range Duration" from 1 to 30 minutes. A shorter duration (e.g., 5 minutes) will be more sensitive and give earlier signals, while a longer duration (e.g., 30 minutes) will establish a wider, more robust range.
2. Dynamic Range Expansion
This is the indicator's most powerful and unique feature. It helps you avoid getting trapped in false breakouts.
What it does: If the price breaks out of the initial range but then quickly closes back inside, the indicator will automatically expand the range to include the full wick of the failed breakout. This tells you the market is still establishing its true range.
How to use it: In the settings under "Dynamic Range," you can:
"Enable Dynamic Range Expansion": This is on by default.
"Expansion Time Limit (Min)": Set how long the indicator should look for these failed breakouts. After this time, the range will be locked for the day.
3. Clear Visual Trading Signals
The indicator provides three distinct signals to help you interpret the price action around the opening range.
Breakout Body (Yellow plotshape):
What it means: The first confirmation that the price has decisively moved outside the established range. It appears when a candle's body closes entirely above the high or below the low.
How to use it: This is your alert that a potential breakout is underway. Do not enter yet; wait for confirmation.
Continuation (Green plotshape):
What it means: This signal appears on the candle immediately following a breakout if it shows momentum in the same direction. It confirms that the breakout has strength.
How to use it: This is a potential entry trigger. A continuation signal suggests the breakout is valid and may continue.
Failure (Red plotshape):
What it means: This signal appears if, after a breakout and continuation, the price quickly reverses and closes back inside the range. It's a strong indication of a false breakout.
How to use it: If you are in a breakout trade, a failure signal is a clear sign to exit. It can also be used as a setup for a reversal trade in the opposite direction.
Sample Strategy: The Breakout-Continuation Trade
This strategy uses the indicator's signals to trade a classic opening range breakout with added confirmation.
Setup:
Set the "Opening Range Duration" to your preferred time (e.g., 5 or 15 minutes).
Ensure the "Dynamic Range Expansion" is enabled to filter out early noise.
Entry Trigger:
Wait for a Breakout signal (yellow) to appear. This puts you on high alert.
Wait for a Continuation signal (green) on the very next candle. This is your entry trigger. Enter a long trade on a bullish continuation or a short trade on a bearish continuation.
Stop-Loss:
For a bullish (long) trade, a common stop-loss placement is just below the low of the continuation candle or, for a more conservative stop, just inside the opening range high.
For a bearish (short) trade, place your stop-loss just above the high of the continuation candle or just inside the opening range low.
Trade Management:
If a Failure signal (red) appears after you've entered, it indicates the breakout has failed. This is a strong signal to exit your trade immediately to protect your capital.
If the trade moves in your favor, you can manage it by taking profits at key levels or using a trailing stop.

Dealing rangeHi all!
This indicator will show you the current dealing range. The concept of dealing range comes from the inner circle trader (ICT) and gives you a range between an established swing high and an established swing low (the length of these pivots can be changed in settings parameter Length and defaults to 5/2 (left/right)). These swing points must have taken out liquidity to be considered "established". The liquidity that must be grabbed by the swing point has to be a pivot of left length of 1 and a right length of 1.
The dealing range that's created should be used in conjunction with market structure. This could be done through scripts (maybe the Market structure script that I published ()) or manually. It's a common approach to look for long opportunities when the trend is bullish and price is currently in the discount zone of the dealing range. If the trend is bearish then short opportunities are presented when the price is currently in the premium zone of the dealing range.
The zones within the dealing range are premium and discount that are split on the 50% level of the dealing range. These zones can be split into 3 zone with a Fair price (also called Fair value ) zone in between premium and discount. This makes the premium zone to be in the upper third of the dealing range, fair price in the middle third and discount in the lower third. This can be enabled in the settings through the Fair price parameter.
Enabled:
You can choose to enable/disable the visualisation of liquidity grabs and the External liquidity available above and below the swing points that created the dealing range.
Enabled:
Disabled:
Enabled on a higher timeframe (will display a box of the liquidity grab price instead of a label):
This dealing range is configurable to be created by a higher timeframe then the visible charts. Use the setting Higher timeframe to change this.
You can force candles to be closed (for liquidity and swing points). Please note that if you use a higher timeframe then the visible charts the candles must be closed on this timeframe.
Lastly you can also change the transparency of liquidity grabs and external liquidity outside of the dealing range. Use the Transparency setting to change this (a lower value will lead to stronger visuals).
If you have any input or suggestions on future features or bugs, don't hesitate to let me know!
Best of trading luck!

X HL RangeOverview:
The X Range indicator is a multi-timeframe visualization tool designed to display the high and low price ranges of previous candles from higher timeframes (HTFs) directly on a lower timeframe chart. It helps traders identify significant price zones and potential support/resistance levels by visually representing the price range of up to three previous candles for each selected timeframe.
Key Features:
Multi-Timeframe Support: The indicator supports three configurable higher timeframes (default: 60 min, 15 min, 5 min) which can be independently toggled on or off.
Custom Candle Range Display: For each enabled timeframe, users can choose to display the range of the most recent 1, 2, or 3 completed candles.
Dynamic Box Drawing: Price ranges are highlighted using rectangular boxes that extend across the chart to show where the highs and lows of each selected HTF candle occurred.
Custom Styling: Each timeframe's boxes can be individually styled with user-defined background and border colors to suit visual preferences or chart themes.
Efficient Redrawing: Boxes update in real-time as new higher timeframe candles complete, and previous boxes are removed to prevent chart clutter.
Use Case:
This indicator is particularly useful for intraday traders who want to align entries and exits with higher timeframe levels. By visualizing previous HTF ranges on a lower timeframe chart, traders gain contextual awareness of where price is likely to react or consolidate, aiding in decision-making for breakouts, reversals, or trend continuation setups.

BTIC Range MidpointsThis code analyzes and displays price ranges from 15:15-15:44 ET, the Basis Trade at Index Close session.
It draws horizontal lines showing:
The high of each session
The low of each session
The midpoint (50%) of each session
Connections between different session ranges (50% points between highs and lows)
Key features include:
Works only on 15-minute timeframes or lower
Stores up to 20 days of historical sessions (configurable)
Filters out ranges too far from current price
Color-codes different session ranges
Provides customizable line styles and colors
Labels each range with identifiers
The indicator essentially helps traders identify important price levels from BTIC sessions, which could serve as potential support/resistance areas for future price action.
Midnight Range Standard DeviationsCredit to Lex Fx for the basic framework of this script
This indicator is designed to assist traders in identifying potential trading opportunities based on the Intraday Concurrency Technique (ICT) concepts, specifically the midnight range deviations and their relationship to Fibonacci levels. It builds upon the work of Lex-FX, whom we gratefully acknowledge for the original concept and inspiration for this indicator.
Core Concept: ICT Midnight Range
The core of this indicator revolves around the concept of the midnight range. According to ICT, the high and low formed in a specific time window (typically the first 30 minutes after midnight, New York Time) can serve as a key reference point for intraday price action. The indicator identifies this range and projects potential support and resistance levels based on deviations from this range, combined with Fibonacci ratios.
How ICT Uses Midnight Range Deviations
ICT methodology often involves looking for price to move away from the initial midnight range, then return to it, or deviate beyond it, as key areas for potential entries.
Range Identification: The indicator automatically identifies the high and low of the midnight range (00:00 - 00:30 NY Time).
Deviation Levels: The indicator calculates and displays deviation levels based on multiples of the initial midnight range. These levels are often used to identify potential areas of support and resistance, as well as potential targets for price movement. These levels can be set in the additional fib levels section, which can be configured in increments of .5 deviations all the way up to 12 deviations.
Fibonacci Confluence: ICT often emphasizes the confluence of multiple factors. This indicator adds Fibonacci levels to the midnight range deviations. This allows traders to identify areas where Fibonacci retracements or extensions align with the deviation levels, potentially creating stronger areas of support or resistance.
Looking for Sweeps: ICT often uses these levels to look for times that the high and low are swept as potential areas of liquidity, indicating the start of potential continuations.
Time-Based Analysis: The time at which price interacts with these levels can also be significant in ICT. The indicator provides options to extend the range lines to specific times (e.g., 3 hours, 6 hours, 10 hours, 12 hours, or a custom defined time) after midnight, allowing traders to focus on specific periods of the trading day.
Indicator Settings Explained:
Time Zone (TZ): Defines the time zone used for calculating the midnight range. The default is "America/New_York".
Range High Color, Range Low Color, Range Mid Color: Customize the colors of the high, low, and mid-range lines.
Range Fill Color: Sets the fill color for the area between the range high and low.
Line Style: Choose the style of the range lines (solid, dashed, dotted).
Range Line Thickness: Adjust the thickness of the range lines for better visibility.
Show Fibonacci Levels: Enable or disable the display of Fibonacci deviation levels.
Fib Up Color, Fib Down Color: Customize the colors of the Fibonacci levels above (up) and below (down) the midnight range.
Show Trendline: Enables a trendline that plots the close price, colored according to whether the price is above the high, below the low, or within the midnight range.
Show Range Lines, Show Range Labels: Toggles the visibility of the range lines and their associated labels.
Label Size: Adjust the size of the labels for better readability.
Hide Prices: Option to display only the deviation values on labels, hiding price values.
Place Fibonacci Labels on Left Side: Option to switch label position from right side to left side.
Extend Range To (Hours from Midnight): This section gives you a wide variety of options on how far you want to extend the range to, you can do 3,6,10,12, and 23 hours. Alternatively, you can select the "Use Custom Length" and set a specific time in hours.
Additional Fib Levels: This section allows the trader to set additional deviation points in increments of .5 deviations from .5 all the way up to 12 deviations
TradingView Community Guidelines Compliance:
This indicator description adheres to the TradingView community guidelines by:
Being educational: It explains the ICT methodology and how the indicator can be used in trading.
Being transparent: It clearly describes all the indicator's settings and their purpose.
Providing credit: It acknowledges Lex-FX as the original author of the concept.
Avoiding misleading claims: It does not guarantee profits or imply that the indicator is a "holy grail."
Disclaimer: Usage of this indicator and the information provided is at your own risk. The author is not responsible for any losses incurred as a result of using this indicator.
Important Considerations:
This indicator is intended for educational purposes and to assist in applying the ICT methodology.
It should not be used as a standalone trading system.
Always combine this indicator with other forms of technical analysis and risk management techniques.
Backtest thoroughly on your chosen market and timeframe before using in live trading.
Trading involves risk. Only trade with capital you can afford to lose.

[F][IND] - Time Range HighlighterDescription:
Introducing the Time Range Highlighter script for TradingView – a precision tool designed to enhance your chart analysis experience with a focus on simplicity and functionality. This script caters to traders who find value in isolating specific time intervals for a more detailed market study, akin to the concept of trading "macros".
Key Features:
1. Effortless Customization:
Define and highlight your preferred time ranges effortlessly. Tailor the script to align with your trading strategy by setting specific start and end times for enhanced precision.
2. Multi-Interval Support:
Seamlessly analyze multiple time ranges concurrently. Toggle between highlighted intervals with ease, allowing for a comprehensive examination of various market conditions without cluttering your chart.
3. Enable/Disable On-Demand:
Maintain control over the clutter on your chart. The enable/disable feature lets you activate or deactivate the highlighted time ranges at your discretion, ensuring a clean and unobstructed view when needed.
4. Focused Chart Analysis:
By visually emphasizing chosen time intervals, the script facilitates a focused analysis of critical market movements, enabling traders to identify patterns and trends with efficiency. This feature is particularly beneficial for those employing trading "macros" to filter out noise and concentrate on key periods.
Usage Instructions:
1. Apply the Time Range Highlighter script to your TradingView chart.
2. Customize the script settings to define specific time ranges tailored to your trading preferences.
3. Toggle between enabled and disabled states as needed to maintain clarity on your chart.
4. Leverage the script to streamline your chart analysis process and make more informed trading decisions, especially when employing trading "macros" to focus on specific market intervals.
Disclaimer:
This indicator is provided for educational purposes only. Trading involves risk, and users should consult with a financial professional before making any trading decisions.
Your Feedback Matters!
Please feel free to comment or reach out if you have any improvement suggestions or if you would like to request the development of a specific indicator. Your feedback is invaluable!

Zazzamira 50-25-25 Trend System Alerts OnlyPublishing my trading system script. It consist of several conditions to happen in order to open a trade. Work best on ES/MES 5 minute timeframe.
I like to use it with this settings:
- UTC -6 (don't tick Exchange Timezone)
and rest as default
To enter a trade, the following conditions must be met: Entry 1: the opening range (8:30AM - 9:15AM UTC-6) must be defined and the price must close above or below the opening range on the 5-minute timeframe. This entry condition defines the trade direction (above = long / below = short). Once the opening range is defined, the Trend-Based Fib Extension is applied from the range high to the range low (and vice versa). Fib levels are required for Exit conditions. Entry 2: the 8 - 27 - 67 - 97 EMAs must be defined. If the EMAs value order is 8 > 27 > 67 > 97, long-only trades are allowed. If the EMAs value order is 8 < 27 < 67 < 97, short-only trades are allowed. This entry condition filters fake breakouts of Entry 1. Entry 3: no trades are allowed after 12:59 UTC-6 (2PM EST). Entry 4: if Entry 1, Entry 2, and Entry 3 conditions are valid and the price hasn't reached the 23.6% Fib line, an entry order can be set at the range high/long with 4 contracts. To exit a trade, the following conditions must be met: Exit 1 (Stop loss): set a trailing stop based on 2.1x ATR (14) from entry. Exit 2: take 50% profits at the 23.6% Fib and leave trailing stop untouched. Exit 3: if Exit 2 triggers, take 50% (25% of total entry) off at 61.8% Fib, leaving Exit 2 trailing stop values valid. Exit 4: exit the full position at the FIB 100% value. Exit 5: all trades must be closed at 3pm UTC-6 (4PM EST). So basically Take Profit are 50%-25%-25% of position.
Code has been written by © Hiubris_Indicators who has been an amazing coder and gave me the possibility to make this script public so a really big shoutout to him.
This indicator only works for alerts, please check version without alerts to backtest or tweaks. This indicator is meant to be used to automate the system via webhooks

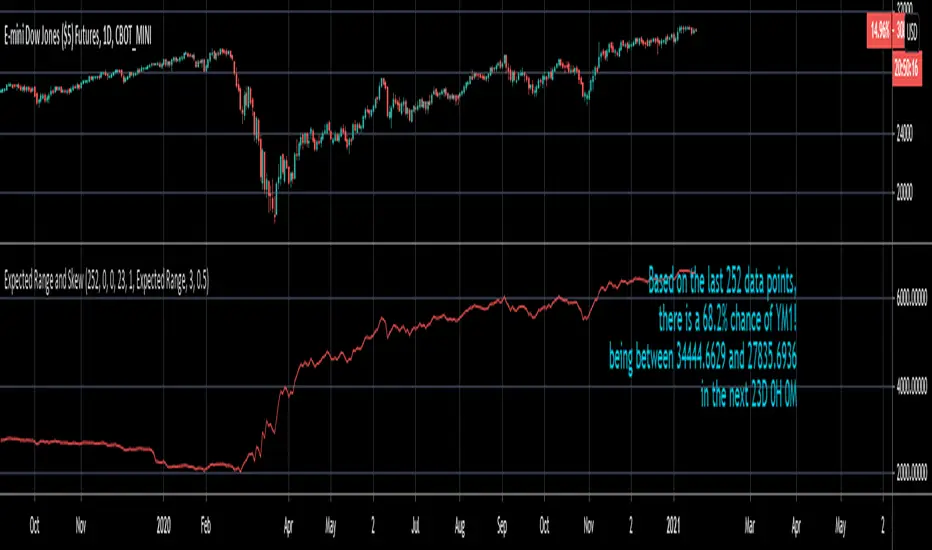
Expected Range and SkewThis is an open source and updated version of my previous "Confidence Interval" script. This script provides you with the expected range over a given time period in the future and the skew of that range. For example, if you wanted to know the expected 1 standard deviation range of MSFT over the next 20 days, this will tell you that. Additionally, this script will also tell you the skew of the expected range.
How to use this script:
1) Enter the length, this will determine the number of data points used in the calculation of the expected range.
2) Enter the amount of time you want projected forward in minutes, hours, and days.
3) Input standard deviation of the expected range.
4) Pick the type of data you want shown from the dropdown menu. Your choices are either the expected range or the skew of the expected range.
5) Enter the x and y coordinates of the label (optional). This is useful so it doesn't impede your view of the plot.
Here are a few notes about this script:
First, the expected range line gives you the width of said range (upper bound - lower bound), and the label will tell you specifically what the upper and lower bounds of the expected range are.
Second, this script will work on any of the default timeframes, but you need to be careful with how far out you try to project the expected range depending on the timeframe you're using. For example, if you're using the 1min timeframe, it probably won't do you any good trying to project the expected range over the next 20 days; or if you're using the daily timeframe it doesn't make sense to try to project the expected range for the next 5 hours. You can tell if the time horizon you're trying to project doesn't work well with the chart timeframe you're using if the current price is outside of either the upper or lower bounds provided in the label. If the current price is within the upper and lower bounds provided in the label, then the time horizon that you're projecting over is reasonable for the chart timeframe you're using.
Third, this script does not countdown automatically, so the time provided in the label will stay the same. For example, in the picture above, the expected range of Dow Futures over the next 23 days from January 12th, 2021 is calculated. But when tomorrow comes it won't count down to 22 days, instead it will show the range over the next 23 days from January 13th, 2021. So if you want the time horizon to change as time goes on you will have to update this yourself manually.
Lastly, if you try to set an alert on this script, you will get a warning about it possibly repainting. This is because of the label, not the plot itself. The label constantly updates itself, which triggers the warning. I tested setting alerts on this script both with and without the inclusion of the label, and without the label the repainting warning did not occur. So remember, if you set an alert on this script you will get a warning about it possibly repainting, but this is because of the label constantly updating, not the plot itself.
Fear Greed RangesFear Greed Ranges Indicator: A Practical Guide to Market Sentiment Analysis
Introduction: Understanding Market Psychology
The "Fear Greed Ranges" indicator is a specialized technical analysis tool designed to visualize market sentiment through the lens of the Relative Strength Index (RSI). Unlike traditional RSI displays that show only a line graph, this indicator transforms raw RSI data into intuitive, color-coded zones that immediately signal whether markets are driven by fear, greed, or balanced sentiment. By providing this visual context, it helps traders identify potential turning points and manage risk more effectively.
Rational Integration: Why RSI Forms the Core
The indicator's foundation rests on the well-established RSI oscillator, chosen for several compelling reasons. First, RSI has stood the test of time since its development by J. Welles Wilder Jr. in 1978, with decades of empirical validation across various asset classes. Second, its mathematical construction—comparing the magnitude of recent gains to recent losses—directly measures momentum, which often precedes price reversals at extremes. Third, RSI's bounded nature (0-100 range) makes it ideal for creating clearly defined zones without subjective interpretation.
The integration transforms this numerical oscillator into a spatial visualization system. Rather than simply reading RSI values, traders can immediately perceive market conditions through color psychology: red triggers caution, green suggests opportunity, and yellow indicates neutrality. This multi-sensory approach reduces cognitive load during fast-moving markets and helps overcome confirmation bias that might occur when interpreting raw numbers.
Component Synergy: How the System Works Together
The indicator comprises three interconnected layers that create a unified analytical framework:
Core Calculation Layer: The traditional RSI calculation processes price data using the specified period length (default 14 periods). This generates the fundamental sentiment metric that drives all subsequent visualizations. The RSI calculation serves as the "brain" of the indicator, continuously analyzing market momentum.
Sentiment Classification Layer: This layer applies threshold logic to categorize each RSI reading into one of three emotional states. Readings above 70 are classified as "Greed" (market potentially overbought), below 30 as "Fear" (market potentially oversold), and between 30-70 as "Neutral" (balanced market conditions). These thresholds are based on the conventional RSI interpretation framework that has been widely adopted in technical analysis.
Visual Translation Layer: The most innovative aspect transforms numerical classifications into immediate visual cues. The colored ribbon area creates a "sentiment atmosphere" around price action, while the background tint provides subtle contextual framing. Horizontal reference lines at 30, 50, and 70 offer precise anchoring points, and the floating label provides real-time status updates. These elements work in concert: the ribbon shows sentiment intensity, the background provides persistent context, and the reference lines offer precise measurement points.
Practical Application: How to Use the Indicator Effectively
For optimal results, traders should incorporate this tool into a comprehensive analysis framework:
Initial Setup: Apply the indicator to any financial chart (stocks, forex, cryptocurrencies, etc.) using the default 14-period setting for general purposes. For shorter timeframes, consider reducing the period to 10; for longer-term analysis, increase to 20-25 periods.
Signal Interpretation:
When the ribbon turns red and the background tints crimson, exercise caution with new long positions and consider profit-taking on existing holdings.
Green zones may indicate accumulation opportunities, particularly if accompanied by bullish divergence (price making lower lows while RSI makes higher lows).
Yellow areas suggest normal market fluctuation where trend-following strategies may be more appropriate than reversal anticipation.
Confirmation Protocol: Always wait for additional confirmation before acting on extreme readings. For greed zone signals, look for bearish candlestick patterns, resistance at key price levels, or decreasing volume. For fear zone signals, watch for bullish reversal patterns, support levels holding, or increasing volume on down moves.
Timeframe Harmony: Analyze multiple timeframes simultaneously. A greed signal on a daily chart carries more weight than one on a 15-minute chart. Look for alignment across timeframes for higher-probability setups.
Alert Utilization: Enable the built-in alert system to receive notifications when sentiment zones change, ensuring you never miss potential opportunities or risk scenarios.
Original Contribution: What Sets This Indicator Apart
While RSI indicators are ubiquitous, the "Fear Greed Ranges" implementation offers several distinctive advantages:
Cognitive Efficiency: By converting numerical data into immediate visual perception, the indicator reduces the mental processing required to assess market conditions. Traders can glance at a chart and instantly understand the sentiment landscape without calculating or interpreting raw values.
Contextual Persistence: The colored background maintains a subtle but constant reminder of the prevailing sentiment, preventing the common pitfall of overlooking extreme conditions that might develop gradually.
Dual-Layer Communication: The system operates on both conscious (reference lines, labels) and subconscious (color psychology) levels, engaging multiple cognitive pathways for more reliable signal recognition.
Integrated Risk Framework: By explicitly naming emotional extremes ("Fear" and "Greed"), the indicator constantly reminds traders of the psychological forces driving markets, encouraging more disciplined decision-making.
Important Considerations and Limitations
No technical indicator guarantees future performance, and this tool should form only one component of a comprehensive trading strategy. Several critical factors require attention:
Market Context Matters: During strong trending markets, RSI can remain in extreme zones for extended periods without immediate reversal. In such conditions, the indicator signals strength rather than imminent reversal.
Volatility Adjustments: Highly volatile instruments may generate frequent zone changes that could lead to overtrading if not filtered appropriately.
Complementary Tools: This indicator works best when combined with price action analysis, volume studies, support/resistance levels, and fundamental factors where applicable.
Personal Adaptation: Traders should backtest the indicator on their preferred markets and timeframes to understand its characteristics before live implementation, potentially adjusting the RSI period or zone thresholds to match specific instrument behaviors.
The "Fear Greed Ranges" indicator serves as a visual translator of market psychology, converting mathematical momentum readings into intuitive emotional landscapes. By making RSI interpretation more immediate and accessible, it helps traders maintain objectivity during emotionally charged market conditions and supports more disciplined execution of their trading strategies. Remember that successful trading involves risk management, continuous learning, and adapting tools to your individual approach—this indicator provides one lens through which to view the markets, not a complete trading system in itself.

Aivance Opening Range & Vol FactorAivance Opening Range & Volume Factor
Overview
The Aivance Opening Range & Volume Factor is a comprehensive tool designed for Day Traders and Scalpers who rely on the "Opening Drive" or "Opening Range Breakout" (ORB) strategies.
The first candle of the trading session often sets the tone for the entire day. This indicator not only visualizes the price action of that critical first candle but also contextualizes the Volume to help you determine if there is enough institutional participation to sustain a trend.
Key Features
1. Opening Volume Factor
Unlike standard volume indicators, this tool calculates a specific Volume Factor for the opening candle:
Formula: (Volume of 1st Candle / Total Volume of Previous Day) * 100
Why it matters: A high Volume Factor (thresholds vary significantly depending on the chart timeframe and asset) suggests strong institutional interest immediately at the open. This often increases the probability of a sustained trend day rather than a choppy range day.
2. Automatic Session Detection
No manual time inputs are required.
The indicator uses time("D") to automatically detect the start of the trading day.
RTH vs. ETH: It adapts to your chart settings. If you use "Regular Trading Hours" (RTH), it marks the 09:30 NY open. If you use "Extended Trading Hours" (ETH), it marks the pre-market open.
3. Visual Opening Range
Box & Lines: Draws a box highlighting the High/Low and the Body (Open/Close) of the opening candle.
Extension: Extends support/resistance lines across the session to help identify breakouts or retests of the opening range later in the day.
4. Smart "Pullback" Logic (Optional)
This script includes a unique filter called "Show only on Pullback":
Default (False): The range is drawn immediately when the first candle closes.
Enabled (True): The range is hidden until the market prints a candle in the opposite direction of the opening move.
Strategy: This helps filter out impulsive moves and encourages trading the "retest" or the failure of the initial drive, rather than chasing the first tick.
How to Use
Trend Confirmation: Look for a breakout of the Opening Box combined with a high Volume Factor.
Support/Resistance: Use the extended gray lines (High/Low of the first candle) as key pivot points for stop-losses or entry targets.
Context: Compare the Volume Factor across different days to establish a baseline for your specific asset (e.g., what constitutes "High Volume" for NQ vs. ES vs. AAPL).
Settings
Colors: Fully customizable colors for Long (Bullish) and Short (Bearish) opening ranges.
Volume Factor: Toggle the text label on/off and adjust size/color.
Logic: Toggle the "Pullback" requirement on/off.
Disclaimer: This tool is for informational purposes only and does not constitute financial advice. Always manage your risk.

eBacktesting - Learning: BreakoutseBacktesting - Learning: Breakouts highlights ranges & breakout behaviors in a clean, visual way.
It automatically:
- Detects consolidation ranges (tight price action) and draws a range box
- Marks a breakout only when a candle CLOSES outside the range (no wick-only breakouts)
Adds a label on the breakout candle (↑ bullish breakout / ↓ bearish breakout)
These indicators are built to pair perfectly with the eBacktesting extension, where traders can practice these concepts step-by-step. Backtesting concepts visually like this is one of the fastest ways to learn, build confidence, and improve trading performance.
Educational use only. Not financial advice.
