NSDT Regular CandlesWhen using Range charts on TradingView, the only candle appearance option is "Range Bars", which are those little thin ones that can be hard to see.
So I made this candle indicator that can be used to plot Regular Candles over the Range Bars for a standard view.
Here is the same chart - only showing the original Range Bars
Cerca negli script per "range"

Stockbee Momentum BurstThis is a script to color code bars based on the bullish- and bearish combination.
Bullish Combination
Percent: Price >= 4% from yesterday and Volume today > Yesterday
Dollar: Price >= 0.9 dollar from open
Base Requirements
- Price > Yesterday's close
- Price > Open
- Price is within 30% of high
- Todays price range >= Yesterdays price range
- Yesterday's move <= 2%
- Volume >= 100 000
Bearish Combination
Percent: Price <= 4% from yesterday and Volume today > Yesterday
Dollar: Price <= 0.9 dollar from open
Base Requirements
- Price < Yesterday's close
- Price < Open
- Price is within 30% of low
- Todays price range >= Yesterdays price range
- Yesterday's move >= -2%
- Minimum volume for each of last 3 days >= 100 000
Momentum Filter
These are based on the 10 and 20 EMA crossover, where the former above would indicate upward momentum and below downward momentum. This can help to narrow down the color code to continuation phases. The linked option will override all other momentum filters, bullish candles will be displayed when EMA 10 > 20 and bearish candles when EMA 10 < 20.

ATR+ Advanced Sessions ATR for DaterangeATR+ Advanced Sessions ATR for Daterange
The ATR+ adds the following additional filters to the stock ATR indicator by Tradingview:
- Calculates the overall average ATR for a user defined daterange, optionally filtered by trading session and selected weekdays, presented as a secondary line over the standard ATR line.
- Basic ATR line, with colour highlight to indicate the selected sessions, days and timeframe being calculated by the average ATR+ line.
- Average ATR+ line indicating the average of all ATRs within the defined timeframe, optionally filtered by instances of a selected trading session and selected weekdays.
- Customisable appearance.
- The ATR+ also includes the basic ATR configuration options typically found in the standard ATR by Tradingview, including period length and smoothing type. Defaults are set to the factory standards: 14 length, RMA smoothing type.
What Is the Average True Range (ATR)?
The ATR is a technical analysis tool that measures market volatility by decomposing the entire range asset price for that period. Investopedia describes the ATR as follows:
"The average true range (ATR) is a technical analysis indicator, introduced by market technician J. Welles Wilder Jr. in his book New Concepts in Technical Trading Systems, that measures market volatility by decomposing the entire range of an asset price for that period.
The true range indicator is taken as the greatest of the following: current high less the current low; the absolute value of the current high less the previous close; and the absolute value of the current low less the previous close. The ATR is then a moving average, generally using 14 days, of the true ranges."
For more information on the ATR and its calculations and use cases, see here:
Investopedia link here.
Tradingview link here.
Note
The indicator may time out if the number of bars being calculated is too long. If this happens, you will need to reduce the datetime range, or increase the chart timeframe in order to reduce the number of bars being calculated and the indicator will attempt to recalculate.

Dual Fibonacci Zone & Ranged Vol DCA Strategy - R3c0nTraderWhat does this do?
This is for educational purposes and allows one to backtest two Fibonacci Zones simultaneously. This also includes an option for Ranged Volume as a parameter.
Pre-requisites:
First off, this is a Long only strategy as I wrote it with DCA in mind. It cannot be used for shorting. Shorting defeats the purpose of a DCA bot which has a goal that is Long a position not Short a position. If you want to short, there are plenty of free scripts out there that do this.
You must have some base knowledge or experience with Fibonacci trading, understanding what is ADX, +DI (and -DI), etc.
You can use this script without a 3Commas account and see how 3Commas DCA Bot would perform. However, I highly recommend inexperienced uses get a free account and going through the tutorials, FAQ's and knowledgebase. This would give you a base understanding of the settings you will see in this strategy and why you will need to know them. Only then should you try testing this strategy with a paper bot.
Background
After I had created and released "Fibonacci Zone DCA Strategy", I began expanding and testing other ideas.
The first idea was to add Ranged Volume to the Fibonacci Zone DCA strategy which I wanted for providing further confirmation before entering a trade. The second idea was to add a second Fibonacci Zone that was just as configurable as the first Fibonacci Zone. I managed to add both and they can be easily enabled or disabled via the strategy settings menu.
Things Got Real Interesting
Things got real interesting when I started testing strategies with two Fibonacci zones. Here's a quick list of what I found I was able to do:
Mix and match exit strategies. I could set the Fib-1 zone strategy to exit with a take profit % and separately set the Fib-2 zone strategy to exit when the price crosses the top-high fib border
Trade the trend. A common phrase amongst traders is "the Trend is your friend" and with the help of an additional Fib Zone, I was able to trade the trend more often by using two different Fib Zone strategies which if configured properly can shorten time to re-deploy capital, increase number of closed trades, and in some cases increase net profit.
Trade both bull market uptrends and bear market downtrends in the same strategy. I found I could configure one Fib Zone strategy to be really good in uptrends and another Fib Zone strategy to be really good in downtrends. In some cases, with both Fib Zone strategies enabled together in a single strategy I got better results than if the strategies were backtested separately.
There are many other trade strategies I am finding with this. One could be to trade a convergence or divergence of the two different Fib Zones. This could possibly be achieved by setting one strategy to have different Fibonacci length.
Credits:
Thank you "EvoCrypto" for granting me permission to use "Ranged Volume" to create this strategy
Thank you "eykpunter" for granting me permission to use "Fibonacci Zones" to create this strategy
Thank you "junyou0424" for granting me permission to use "DCA Bot with SuperTrend Emulator" which I used for adding bot inputs, calculations, and strategy

Rescaled RangeRescaled Range is an implementation of the fractal rescaled ranges developed by Harold Edwin Hurst and Benoit Mandlebrot.
Settings include:
“Window Size” - the number of time periods in a window over which price changes are analyzed. This will generally correspond to your trading horizon and defaults to 15.
“Number of Windows” - the number of “Window Size” intervals to average the rescaled range value over. By looking at a number of such periods, the study captures potential volatility that may have occurred in the recent past. This should be set long enough to capture the current trend (defaults to 63), but not so long to include volatility regimes no longer in play.
Each window in the average is offset by 1 time period from the the others - like a moving average.
This study plots two lines - “Rescaled Range High” which indicates overbought conditions when the price moves above it and “Rescaled Range Low” which indicates oversold conditions when the price moves below it.
This study builds upon the bridge range work of Joe Catanzaro (joecat808) and Caleb Sandfort (calebsandfort). Bridge ranges are used to position the rescaled range with respect to the closing price.
Note: Your time series must have (Window Size + Number of Windows) or more periods of data to complete this study. For example, using the defaults, your time series should have (15+63) = 78 periods or more of data.

Consolidation Ranges [kingthies] Consolidation Range Analysis
Published by Eric Thies, January 2021
█ Indicator Summary
This tool calculates, analyzes and plots the visualization of a relative range over a given period of time
By adding to charts, users are enabled to see the impulsive nature of market cycles, along with their efforts to consolidate thereafter
The default period is 30, and should be adjusted to users preference
The default input is the current close price, on the chosen timeframe of the chart
█ Script Source
//
//@version=4
//© kingthies || This source code is subject to the terms of the Mozilla Public License 2.0 at mozilla.org
study("Consolidation Ranges ", shorttitle="CR ", overlay=true)
// !<------ User Inputs ----->
src = input(close, title='Range Input (Default set to Close'), lengthEMA=input(30,title='Length'),zoneToggle = input(true, title="Toggle Zone Highlights"), iCol = color.new(#FFFFFF, 100),
// !<---- Declarations & Calculations ---- >
trndUp = float(na),trndDwn = float(na), mid = float(na), e = ema(src, lengthEMA)
trndUp := src < nz(trndUp ) and src > trndDwn ? nz(trndUp ) : high, trndDwn := src < nz(trndUp ) and src > trndDwn ? nz(trndDwn ) : low, mid := avg(trndUp, trndDwn)
// !< ---- Plotting ----->
highRange = plot(trndUp == nz(trndUp ) ? trndUp : na, color=color.white, linewidth=2, style=plot.style_linebr, title="Top of Period Range")
lowRange = plot(trndDwn == nz(trndDwn ) ? trndDwn : na, color=color.white, linewidth=2, style=plot.style_linebr, title="Bottom of Period Range")
xzone = plot(zoneToggle ? src > e ? trndDwn : trndUp : na, color=iCol, style=plot.style_circles, linewidth=0, editable=false)
fill(highRange, xzone, color=color.lime,transp=70), fill(xzone, lowRange, color=color.red,transp=70)
//

Volume Range EventsChanges in the feelings (positive, negative, neutral) in the market concerning the valuation of an instrument are often preceded with sudden outbursts of buying and selling frenzies. The aim of this indicator is to report such outbursts. We can see them as expansions of volume, sometimes 10 times more than usual. and as extensions of the trading range, also sometimes 10 times more than usual (e.g. usual range is 10 cent suddenly a whole dollar.) The changes are calculated in such a way that these fit between plus and minus 100 percent, the bars are scaled in some sort of logarithmic way. The Emoline is the same as the one in the True Balance of Power indicator, which I already published
ONLY RISES ARE EVENTS
Sometimes analysts are tempted to give meaning to low volume or small ranges. These simply mean that the market has little interest in trading this instrument. I believe that in such cases the trader needs to wait for expansion and extension events to happen, then he can make a better guess of where the market is heading. As events often mark the beginning or ending of a trend, this indicator provides an early and clear signal, because it doesn’t bother us about non-events.
WHAT IS USUAL?
If the algorithm would use an average as a normal to scale volume or range events, then previous peaks will act as spoilers by making the average so high that a following peak is scaled too small. I developed a function, usual() , that kicks out all extremes of a ‘population of values’ and which returns the average of the non-extreme values. It can be called with any serial. This function is called by both algorithms that report volume and range peaks, which guarantees that the results are really comparable. As this function has a fixed look back of 8 periods, we might state that ‘usual’ is a short lived relative value. I think this doesn’t matter for the practical use of the indicator.
COLORING AND INTERPRETATION
I follow the categories in the ‘Better Volume Indicator’, published by LeazyBear, these are:
1. Climactic Volumes, event >40 % (this means peak is 1.5 X usual)
LIME: Climax Buying Volume, direction up, range event also > 30 %
RED: Climax Selling Volume, direction down, range event also > 30 %
AQUA: Climax Churning Volume, both directions, range event < 30%
2. Smaller Volumes, event <40 %
GREEN: Supportive Volume, both directions, if combined with range event
BLUE: Churning Volume, both directions, if not combined with range event (Professional Trading)
3. Just Range Events
BLACK histogram bars (Amateurish Trading)

New York | Asia | London - Session Range + ORB - [EntryLab]Session Ranges & 15min ORB – Asia, London, New YorkShort Title
This indicator plots the high and low of the three major trading sessions (Asia, London, New York) as well as the Opening Range Breakout (ORB) levels based on the first 15 minutes of each session.
Features: Full session high/low ranges for Asia (00:00–09:00 UTC), London (07:00–16:00 UTC), and New York (~13:30–20:00 UTC). Times are approximate UTC and may need adjustment depending on broker timezone or DST.
ORB: high and low calculated from the first 15-minute period (or equivalent bars) at the start of each session.
Customizable: toggle sessions on/off, change ORB duration, line styles, colors.
How to use:
Traders often monitor price action around prior session highs and lows to identify potential liquidity grabs or sweeps. The ORB provides additional confluence for gauging the session's potential directional bias or breakout levels.For example:A sweep of a prior session high/low can signal liquidity being taken.
Price breaking above/below the session's ORB high/low may indicate momentum in that direction for the current session.
This script combines multi-session range visualization with per-session ORB levels in one tool, which can help assess where liquidity pools may exist and where price could be drawn to fill or sweep certain areas.Best used on lower timeframes (e.g., 1m–15m) for intraday analysis. Session times are fixed (no automatic DST handling); users can modify them in the code if needed.Not financial advice. Trading involves significant risk of loss. Use at your own discretion and always test thoroughly.

10 Youtube Opening Range Strategies + Backtest 1. Quick Flip Scalper
A strategy centered on fading or following the initial move relative to the Opening Range (OR).
LONG Rules:
Reversal Mode: If the Opening Range is Bearish (Red), enter Long when price drops below the Opening Range Low (ORL).
Continuity Mode: If the Opening Range is Bullish (Green), enter Long when price drops below the Opening Range Low (ORL) (Buying the deep pullback/trap).
SHORT Rules:
Reversal Mode: If the Opening Range is Bullish (Green), enter Short when price breaks above the Opening Range High (ORH).
Continuity Mode: If the Opening Range is Bearish (Red), enter Short when price breaks above the Opening Range High (ORH) (Selling the deep pullback/trap).
2. First Candle Scalper
Identical to the Quick Flip Scalper but restricts entries to the very first retest only.
LONG Rules:
Same as Quick Flip Long, but only triggers once per session.
SHORT Rules:
Same as Quick Flip Short, but only triggers once per session.
3. Smart Money Trap (SMT)
Identifies a "fakeout" breakout followed immediately by a reversal candlestick pattern.
LONG Rules:
Condition: The previous candle low was below the ORL, but the candle closed back inside (above ORL).
Trigger: Must have a Bullish Engulfing or Bullish Rejection pattern closing above the ORL.
SHORT Rules:
Condition: The previous candle high was above the ORH, but the candle closed back inside (below ORH).
Trigger: Must have a Bearish Engulfing or Bearish Rejection pattern closing below the ORH.
4. Trident Pattern (TG Capital)
A London-session exclusive strategy requiring a Fair Value Gap (FVG) and a Doji confirmation.
LONG Rules:
Filter: Price is Above the 200 EMA (if enabled).
Setup: A Bullish FVG forms.
Confirmation: A Doji candle wicks down into the 50% level of the FVG.
Trigger: Enter on the next candle close.
SHORT Rules:
Filter: Price is Below the 200 EMA (if enabled).
Setup: A Bearish FVG forms.
Confirmation: A Doji candle wicks up into the 50% level of the FVG.
Trigger: Enter on the next candle close.
5. OTE Framework (MBB Trader)
Simulates an Optimal Trade Entry by combining a Liquidity Sweep with a Market Structure Shift (SMR).
LONG Rules:
Sweep: Price drops below the lowest low of the last 20 candles.
Structure: A Bullish SMR forms (Low → High → Lower Low → Higher High).
SHORT Rules:
Sweep: Price breaks above the highest high of the last 20 candles.
Structure: A Bearish SMR forms (High → Low → Higher High → Lower Low).
6. Liquidity Trap (Marco Trades)
A contrarian strategy that buys/sells purely on sweeps of major structural levels.
LONG Rules:
Trigger: Price sweeps (drops below) the lowest low of the last 50 candles.
SHORT Rules:
Trigger: Price sweeps (breaks above) the highest high of the last 50 candles.
7. Trojan Horse (Trader Mayne)
Uses Trend EMAs (50 & 200) to identify direction, then enters on a Lower Timeframe Breaker.
LONG Rules:
Trend: 50 EMA > 200 EMA (Uptrend).
Trigger: Price sweeps a recent 10-candle low, then immediately breaks a recent 5-candle high.
SHORT Rules:
Trend: 50 EMA < 200 EMA (Downtrend).
Trigger: Price sweeps a recent 10-candle high, then immediately breaks a recent 5-candle low.
8. Simplified SMT (9:30 Range)
Focuses on the 9:30 AM range. Waits for a breakout and a confirmed failure to sustain it.
LONG Rules:
Context: Price previously broke above the ORH.
Trigger: Price returns to the ORH (Retest) with a Bullish Engulfing/Rejection pattern.
SHORT Rules:
Context: Price previously broke below the ORL.
Trigger: Price returns to the ORL (Retest) with a Bearish Engulfing/Rejection pattern.
9. 9:30 One-Candle (Scarface)
Uses the high/low of the single 9:30 candle as the range.
LONG Rules:
Setup: Price closes above the 9:30 High.
Trigger: Price pulls back and touches/dips into the 9:30 High (Retest).
SHORT Rules:
Setup: Price closes below the 9:30 Low.
Trigger: Price pulls back and touches/wicks into the 9:30 Low (Retest).
10. London Breakout (Joovier)
Based on the 3 AM - 9 AM EST box.
LONG Rules:
Trigger: A candle's Body (Open and Close) forms completely above the Box High after the session opens.
SHORT Rules:
Trigger: A candle's Body (Open and Close) forms completely below the Box Low after the session opens.
⚠️ DISCLAIMER & LIMITATION OF LIABILITY
1. NO AFFILIATION / INDEPENDENT PROJECT This script is an independent coding project created solely for testing, research, and entertainment purposes. The creator of this indicator is not associated, affiliated, endorsed by, or in any way connected to the strategy authors or influencers mentioned within the tool (including but not limited to TG Capital, MBB Trader, Marco Trades, Trader Mayne, Scarface, or Joovier).
The strategy names are used strictly for identification purposes to credit the original concept creators.
This code represents an independent interpretation of public trading concepts. It may not reflect the exact, proprietary, or private methods taught by these individuals.
This is not an official product from any of the aforementioned parties.
2. FOR EDUCATIONAL PURPOSES ONLY This indicator is strictly for educational and informational purposes. It is not a signal service and does not constitute investment, financial, or trading advice. The buy/sell labels generated by this script are merely visual representations of specific code logic and should not be interpreted as instructions to execute trades.
3. EXCLUSION OF LIABILITY By using this script, you explicitly agree that:
The creator assumes no responsibility or liability for any direct, indirect, consequential, or incidental losses or damages resulting from the use of this tool.
You engage in trading entirely at your own risk.
You release the creator from any legal responsibility regarding your trading activities or financial results.
4. HYPOTHETICAL PERFORMANCE The statistics displayed on the "Dashboard" (Win Rate, P&L, etc.) are hypothetical and based on historical backtesting data.
Past performance is not indicative of future results.
These results do not account for slippage, spreads, commission fees, or real-time liquidity issues.
Strategies that performed well in the past may fail in current or future market conditions.
5. HIGH-RISK WARNING Trading in financial markets (Stocks, Forex, Crypto, Futures) involves a high degree of risk and is not suitable for all investors. You could lose some or all of your initial investment. You should not trade with money that you cannot afford to lose.
IF YOU DO NOT AGREE WITH THESE TERMS, DO NOT USE THIS SCRIPT.

[turpsy] Midnight Opening Range-Fractal Midnight Open Range-Fractal Combined Trading System
Overview
This indicator combines Midnight Opening Range (MOR) analysis with HTF candle structure and fractal patterns to provide a comprehensive intraday trading framework. Unlike simple mashups, this system integrates three complementary methodologies that work together to identify high-probability trading zones.
Core Components & Synergy
1. MOR (Midnight Opening Range) Indicator
- Tracks the first 30 minutes of each trading day (00:00-00:30)
- Draws historical and current session boxes with quartile levels (25%, 50%, 75%)
- Custom opening price lines for key market times (NY Open 9:30, London Close, etc.)
- Concept:
Price tends to respect the opening range boundaries; quartiles act as support/resistance
2. HTF (Higher Timeframe) Candles
- Displays up to 6 higher timeframe candles alongside your chart
- Shows Fair Value Gaps (FVG) and Volume Imbalances (VI)
- Presents First Presented FVG (PFVG) - the initial gap after a fractal
- Concept:
HTF structure provides context for LTF entries; FVGs are magnetic price targets
3. Fractal Pattern Detection with CISD
- Identifies swing highs/lows using HTF candle structure
- CISD (Change in State of Delivery) lines mark confirmed fractal breaks
- Chart sweeps show liquidity grabs
- Concept: Fractals mark key market structure; CISD confirms directional bias
4. Killzones & Session Analysis
- Asia, London, NewYork AM/PM, and Lunch sessions
- Session highs/lows with pivot tracking
- Day/Week/Month opens and separators
- Concept: Specific sessions show characteristic volatility and directional behavior
5. ADR/CDR Analysis
- Average Daily Range and Current Daily Range tracking
- Shows percentage of ADR completed
- Concept: Helps gauge if there's room for continuation or if exhaustion is likely
How They Work Together
1. Context: It uses HTF candles and MOR boxes to identify the bigger picture structure
2. Timing: It uses Killzones to show when institutional activity is highest
3. Entry: It uses Fractals with CISD confirm structure breaks; FVGs provide entry zones
4. Risk Management: ADR/CDR helps set realistic profit targets and assess if move is extended
Original Contributions
This script significantly improves upon the base components by:
- Integrating 1-minute data feed for accurate Midnight Open Range calculations on all timeframes
- Adding PFVG detection synchronized with fractal patterns
- Creating logarithmic midpoint calculations between HTF candles
- Implementing chart sweep detection for liquidity analysis
- Adding CISD projection lines at 0.5, 1.0, 1.5, 2.0 extensions
How to Use
1. Enable desired HTF timeframes and MOR settings
2. Watch for PFVG formation after HTF candle closes
3. Look for CISD line breaks during killzone sessions
4. Enter at FVG mitigation zones aligned with MOR quartiles
5. Monitor ADR% to gauge move potential
Credits
- HTF Candles base structure: fadizeidan & tradeforopp
- Midnight opening range: trades-dont-lie
- I made the Significant modifications and integration

Session Range Control [PointAlgo]Session Range Control (SRC)
The Session Range Control (SRC) indicator provides a structured view of intraday price behavior by tracking where the current price sits within the session’s high–low range and how today’s volatility compares to the Average Daily Range (ADR). It combines range analytics, momentum context, volatility interpretation, and visual cues to help traders understand session strength and shifts in intraday conditions.
Core Concept
Every trading session forms a unique high and low. SRC continuously reads these values and calculates the Position in Range, expressed on a scale from 0% to 100%:
0% → Price at Day Low
100% → Price at Day High
50% → Mid-range equilibrium
By normalizing price into a percentage, traders can quickly interpret where market pressure is concentrated during the session.
Trend Zones and Market State
SRC divides the range into logical zones to show the likely sentiment of the session:
1. Strong Uptrend Zone (Above Threshold)
When price consistently holds above the user-defined upper threshold (e.g., 60%), the indicator marks a Strong Uptrend.
This typically reflects:
Persistent intraday buying pressure
Price acceptance near the upper part of the range
Reduced likelihood of deep pullbacks
2. Strong Downtrend Zone (Below Threshold)
When price remains below the lower threshold (e.g., 40%), SRC signals a Strong Downtrend, indicating:
Dominant intraday selling
Consistent pressure keeping price near session lows
3. Bullish / Bearish Zones
Between the midline and strong thresholds, SRC displays softer trend zones:
Above 50% = Bullish Zone
Below 50% = Bearish Zone
These zones help classify whether price is trending, balanced, or drifting.
4. Neutral Territory
When price hovers around the mid-level without conviction, the indicator treats it as a neutral or undecided phase.
Signal Logic :
SRC includes built-in momentum shift signals based on range transitions:
Long Signal
Triggered when price crosses upward through 50%, often showing:
A shift from intraday weakness to strength
Buyers gaining control of the session
Short Signal
Triggered when price crosses downward through 50%, suggesting:
Loss of intraday strength
Sellers taking control
These signals help highlight potential turning points inside the session.
Extreme Levels :
SRC highlights the top and bottom 10% of the range:
> 90% = Extreme High (Overbought intraday condition)
< 10% = Extreme Low (Oversold intraday condition)
These conditions can be useful for identifying overextended movements or potential reaction zones.
ADR Comparison and Volatility Context :
The indicator also measures how today’s price range compares to the Average Daily Range (ADR):
Range Expanding: Today’s range is significantly larger than the ADR
Indicates heightened volatility
Often associated with trending or breakout environments
Range Compressing: Today’s range is much smaller
Suggests low volatility
Common before breakout phases
Characteristic of consolidation or balanced markets
This volatility context helps traders assess whether the session is behaving within normal boundaries or deviating significantly.
Dashboard Overview :
When enabled, the dashboard summarizes key intraday metrics in a structured table:
Trend status (Strong Uptrend, Strong Downtrend, Bullish, Bearish, Neutral)
Range position (%)
Signal status (Long Cross, Short Cross, Extreme High/Low, or None)
Day range calculation
Range vs ADR (%)
Day High / Day Low
Current price level
Simplified action label based on current conditions
This provides a quick reference system to interpret both trend and volatility at a glance without analyzing the full chart visually.
Visual Elements
SRC includes:
Colored dynamic plot for easy trend recognition
Horizontal reference lines at key levels (0%, 50%, 100%, strong-trend thresholds)
Background shading during extreme zone conditions
A separate ADR comparison plot
These visuals ensure the indicator remains intuitive regardless of chart style or timeframe.
Alerts
The script includes alert conditions for:
Long cross
Short cross
Strong trend detection
Extreme high / extreme low
These allow users to automate notifications during key market events without manually monitoring the chart.
Customization Options
Users can configure:
ADR length
Strong trend thresholds
Dashboard visibility
Dashboard position on chart
This makes SRC adaptable to different trading instruments and intraday styles.
Usage Notes
Works best on intraday timeframes where session boundaries are clearly defined.
Designed for analytical interpretation—trend bias, volatility phase, and range structure.
Can complement other tools such as moving averages, volume, or market structure analysis.
Disclaimer :
This indicator is intended for chart analysis and educational purposes only.
It does not generate financial, investment, or trading advice.
Users should validate signals with additional research and apply proper risk management.

Forex Session TrackerForex Session Tracker - Professional Trading Session Indicator
The Forex Session Tracker is a comprehensive and visually intuitive indicator designed specifically for forex traders who need precise tracking of major global trading sessions. This powerful tool helps traders identify active market sessions, monitor session-specific price ranges, and capitalize on volatility patterns unique to each trading period.
Understanding when major financial centers are active is crucial for forex trading success. This indicator provides real-time visualization of the Tokyo, London, New York, and Sydney trading sessions, allowing traders to align their strategies with peak liquidity periods and avoid low-volatility trading windows.
---
Key Features
📊 Four Major Global Trading Sessions
The indicator tracks all four primary forex trading sessions with precision:
- Tokyo Session (Asian Market) - Captures the Asian trading hours, ideal for JPY, AUD, and NZD pairs
- London Session (European Market) - Monitors the most liquid trading period, perfect for EUR, GBP pairs
- New York Session (American Market) - Tracks US market hours, essential for USD-based currency pairs
- Sydney Session (Pacific Market) - Identifies the opening of the trading week and AUD/NZD activity
Each session is fully customizable with individual color schemes, making it easy to distinguish between different market periods at a glance.
🎯 Session Range Visualization
For each active trading session, the indicator automatically:
- Draws rectangular boxes that highlight the session's time period
- Tracks and displays session HIGH and LOW price levels in real-time
- Creates horizontal lines at session extremes for easy reference
- Positions session labels at the center of each trading period
- Updates dynamically as new highs or lows are formed within the session
This visual approach helps traders quickly identify:
- Session breakout opportunities
- Support and resistance zones formed during specific sessions
- Range-bound vs. trending session behavior
- Key price levels that institutional traders are watching
📱 Live Information Dashboard
A sleek, professional information panel displays:
- Real-time session status - Instantly see which sessions are currently active
- Color-coded indicators - Green dots for active sessions, gray for closed sessions
- Timezone information - Confirms your current timezone settings
- Customizable positioning - Place the dashboard anywhere on your chart (Top Left, Top Right, Bottom Left, Bottom Right)
- Adjustable size - Choose from Tiny, Small, Normal, or Large text sizes for optimal visibility
The dashboard provides at-a-glance awareness of market conditions without cluttering your chart analysis.
⚙️ Extensive Customization Options
Every aspect of the indicator can be tailored to your trading preferences:
Session-Specific Controls:
- Enable/disable individual sessions
- Customize colors for each trading period
- Adjust session times to match your broker's server time
- Toggle background highlighting on/off
- Show/hide session high/low lines independently
General Settings:
- UTC Offset Control - Adjust timezone from UTC-12 to UTC+14
- Exchange Timezone Option - Automatically use your chart's exchange timezone
- Background Transparency - Fine-tune the opacity of session highlighting (0-100%)
- Session Labels - Show or hide session name labels
- Information Panel - Toggle the live status dashboard on/off
Style Settings:
- Turn session backgrounds ON/OFF directly from the Style tab
- Maintain clean charts while keeping all analytical features active
🔔 Built-in Alert System
Stay informed about session openings with customizable alerts:
- Tokyo Session Started
- London Session Started
- New York Session Started
- Sydney Session Started
Set up notifications to never miss important market opening periods, even when you're away from your charts.
---
How to Use This Indicator
For Day Traders:
1. Identify High-Volatility Periods - Focus your trading during London and New York session overlaps for maximum liquidity
2. Monitor Session Breakouts - Watch for price breaks above/below session highs and lows
3. Avoid Low-Volume Periods - Recognize when major sessions are closed to avoid false signals
For Swing Traders:
1. Mark Key Levels - Use session highs and lows as support/resistance zones
2. Track Multi-Session Patterns - Observe how price behaves across different trading sessions
3. Plan Entry/Exit Points - Time your trades around session openings for better execution
For Currency-Specific Traders:
1. JPY Pairs - Focus on Tokyo session movements
2. EUR/GBP Pairs - Monitor London session activity
3. USD Pairs - Track New York session volatility
4. AUD/NZD Pairs - Watch Sydney and Tokyo sessions
---
Technical Specifications
- Pine Script Version: 5
- Overlay Indicator: Yes (displays directly on price chart)
- Maximum Bars Back: 500
- Drawing Objects: Up to 500 lines, boxes, and labels
- Performance: Optimized for real-time data processing
- Compatibility: Works on all timeframes (recommended: 5m to 1H for session tracking)
---
Installation & Setup
1. Add to Chart - Click "Add to Chart" after copying the script to Pine Editor
2. Configure Timezone - Set your UTC offset or enable "Use Exchange Timezone"
3. Customize Colors - Choose your preferred color scheme for each session
4. Adjust Display - Enable/disable features based on your trading style
5. Set Alerts - Create alert notifications for session starts
---
Best Practices
✅ Combine with Price Action - Use session ranges alongside candlestick patterns for confirmation
✅ Watch Session Overlaps - The London-New York overlap (1300-1600 UTC) typically shows highest volatility
✅ Respect Session Highs/Lows - These levels often act as intraday support and resistance
✅ Adjust for Your Broker - Verify session times match your broker's server clock
✅ Use Multiple Timeframes - View sessions on both lower (15m) and higher (1H) timeframes for context
---
Why Choose Forex Session Tracker Pro?
✨ Professional Grade Tool - Built with clean, efficient code following TradingView best practices
✨ Beginner Friendly - Intuitive design with clear visual cues
✨ Highly Customizable - Adapt every feature to match your trading style
✨ Performance Optimized - Lightweight code that won't slow down your charts
✨ Actively Maintained - Regular updates and improvements
✨ No Repainting - All visual elements are fixed once the session completes
---
Support & Updates
This indicator is designed to provide reliable, accurate session tracking for forex traders of all experience levels. Whether you're a scalper looking for high-volatility windows or a position trader marking key institutional levels, the Forex Session Tracker Pro delivers the insights you need to make informed trading decisions.
Happy Trading! 📈
---
Disclaimer
This indicator is a tool for technical analysis and should be used as part of a comprehensive trading strategy. Past performance does not guarantee future results. Always practice proper risk management and never risk more than you can afford to lose. Trading forex carries a high level of risk and may not be suitable for all investors.

ADR - Average Daily Range [KasTrades]This is an Average Daily Range (ADR) indicator.
There are two settings for ADR:
Two Look back period ADR range (e.g. 7 and 14 days)
One Look back period ADR (e.g. 5 days only)
Two day ADR ranges are typically used in equities and index futures whereas one day ADR is typically used in forex.
The opening time by default is 17:00 New York (Eastern) time. The ranges are always calculated from the opening price of the first bar on the respected timeframe.

Monday's Range Superpowerkyu🔔 Settings
You can customize the colors and toggle ON/OFF in the indicator settings.
Works on daily, hourly, and minute charts.
Easily visualize Monday’s high, low, and mid-line range.
📌 1. Support & Resistance with Monday’s Range
Monday High: Acts as the first resistance of the week.
◽ Example: If price breaks above Monday’s high after Tuesday, it signals potential bullish continuation → long setup.
Monday Low: Acts as the first support of the week.
◽ Example: If price breaks below Monday’s low, it signals bearish continuation → short setup.
📌 2. Mid-Line Trend Confirmation
Monday Mid-Line = average price of Monday.
Price above mid-line → bullish bias.
Price below mid-line → bearish bias.
Use mid-line breaks as entry confirmation for long/short positions.
📌 3. Breakout Strategy
Break of Monday’s High = bullish breakout → long entry.
Break of Monday’s Low = bearish breakout → short entry.
Place stop-loss inside Monday’s range for a conservative approach.
📌 4. False Breakout Strategy
If price breaks Monday’s high/low but then falls back inside Monday’s range, it is a False Breakout.
Strategy: Trade in the opposite direction.
◽ False Breakout at High → short.
◽ False Breakout at Low → long.
Stop-loss at the wick (extreme point) of the failed breakout.
📌 5. Range-Based Scalping
Use Monday’s high and low as a trading range.
Sell near Monday’s High, buy near Monday’s Low, repeat until breakout occurs.
📌 6. Weekly Volatility Forecast
Narrow Monday range → higher chance of strong trend later in the week.
Wide Monday range → lower volatility expected during the week.
📌 7. Pattern & Trend Analysis within Monday Range
Look for candlestick patterns around Monday’s High/Low/Mid-Line.
◽ Example: Double Top near Monday’s High = short setup.
◽ Repeated bounce at Mid-Line = strong long opportunity.
✅ Summary
The Monday’s Range (Superpowerkyu) Indicator helps traders:
Identify weekly support & resistance
Confirm trend direction with Mid-Line
Trade breakouts & false breakouts
Apply range scalping strategies
Forecast weekly volatility
⚡ Especially, the False Breakout strategy is powerful as it captures failed moves and sudden sentiment reversals.

Objective Doji Highlight (Range-Relative)This indicator highlights Doji candles using an objective, mathematics-based rule: a bar is Doji when the absolute difference between its open and close is less than or equal to a user-defined fraction (x) of that bar’s high–low range.
How it works:
Compute body size as the absolute difference between open and close.
Compute the bar’s range as high minus low.
Classify as Doji when body size ≤ x × range.
Only Doji candles are colored; non-Doji bars remain unchanged.
Inputs
Doji threshold (x of range): tolerance (0–1) controlling how small the body must be relative to the range.
Doji Candle Color: visual color for detected Doji candles.
Example:
If x = 0.10 and a candle has high = 100 and low = 90 (range = 10), the maximum allowed body is 1.
If the difference between open and close is ≤ 1, the candle is marked as Doji.
Why it can be useful
Doji candles are often studied as signs of market indecision. This tool provides a clear, parameter-based way to identify them consistently across any timeframe, without discretionary interpretation.
Notes & limitations
Works with standard candlesticks (not Heikin Ashi, Renko, or other synthetic bar types).
Visualization and research only: it does not produce buy/sell signals and makes no performance claims.
No repainting from future data; the logic uses only the current bar’s prices.

Opening Range BreakoutOpen Range Breakout (ORB) – Trading Strategy Documentation
Definition:
The Open Range Breakout (ORB) is a short-term trading strategy that identifies the price range established during the initial period of market opening (typically the first 15 to 60 minutes) and uses the high and low of that range as key reference levels for potential breakout entries.
Components:
Open Range High: The highest price traded during the defined opening period.
Open Range Low: The lowest price traded during the same period.
Breakout Trigger: A price move above the Open Range High or below the Open Range Low, signaling potential continuation momentum.
How It Works:
Define the Opening Period: Select a time window (e.g., 30 minutes) at market open to establish the initial range.
Identify Range Boundaries: Record the high and low prices during this period.
Monitor for Breakout: Watch for price to break and close above the Open Range High (bullish breakout) or below the Open Range Low (bearish breakout).
Enter Trade: Enter long on a confirmed break above the Open Range High, or short on a break below the Open Range Low. Entry may be triggered on a retest of the broken level or with volume confirmation.
Set Stop-Loss and Target:
Stop-loss: Placed just inside the open range (e.g., below the high for long, above the low for short).
Profit target: Based on volatility (e.g., ATR multiple) or support/resistance levels.
Key Assumptions:
Early price action reflects initial market sentiment.
A breakout from this range indicates strong directional momentum likely to continue.
Best Conditions:
High liquidity markets (e.g., major indices, large-cap stocks).
Volatile or news-driven trading sessions.
Used primarily in intraday trading.
Limitations:
Prone to false breakouts during low-volume or choppy markets.
Requires strict risk management due to reliance on timing and confirmation.
Conclusion:
The ORB strategy capitalizes on early market momentum by trading breakouts from the initial price range. Its effectiveness depends on precise range definition, timely execution, and disciplined risk control.

Open Range Breakout Strategy With Multi TakeProfitHello everyone,
For a while, I’ve been wanting to develop new scripts, but I couldn’t decide what to create. Eventually, I came up with the idea of coding traditional and well-known trading strategies—while adding modern features such as multi–take profit options. For the first strategy in this series, I chose the Open Range Strategy .
For those unfamiliar with it, the Open Range Strategy is a trading approach where you define a specific time period at the beginning of a trading session—such as the first 15 minutes, 30 minutes, or 1 hour—and mark the highest and lowest prices within that range. These levels then act as reference points for potential breakouts: if the price breaks above the range, it may signal a long entry; if it breaks below, it may indicate a short entry. This method is popular among day traders for capturing early momentum in the market.
Since this strategy is generally used as an intraday strategy , I added a Trade Session feature. This allows you to define the exact time window during which trades can be opened. Once the session ends, all positions are automatically closed, ensuring trades remain within your chosen intraday period.
Even though it’s a relatively simple concept, I’ve come across many different variations of it. That’s why I created a highly customizable project. Under the Session Settings, you can select the time window you want to define as your range. Whether it’s the first 15-minute candle or the entire first hour, the choice is entirely yours.
For stop-loss placement, there are two different options:
Middle of the Range – The stop loss is placed at the midpoint between the high and low of the defined range, offering a balanced buffer for both bullish and bearish setups.
Top/Bottom of the Range – The stop loss is placed just beyond the range’s high for short trades or just below the range’s low for long trades, providing a more conservative risk approach.
I’ve always been a big fan of the multi take-profit feature, so I added two different take-profit targets to this project. Take profits are calculated based on a Risk-to-Reward Ratio, which you can adjust in the settings. You can also set different position sizes for each target, allowing you to scale out of trades in a way that suits your strategy.
The result is a flexible, user-friendly strategy script that brings together a classic approach with modern risk management tools—ready to be tailored to your trading style

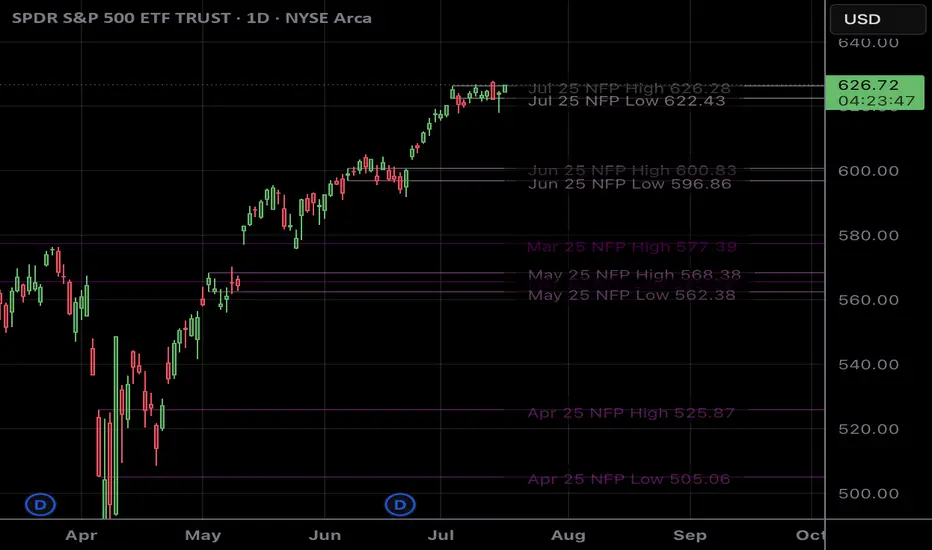
NFP RangesPlots the NFP daily ranges for NFP days. Includes extended hours ranges when the time frame is sub 1D, otherwise, only the daily range is taken.
NFP Dates are pre-populated through 2029 and historically through 2022. Will update script to include farther-out dates before they become necessary.
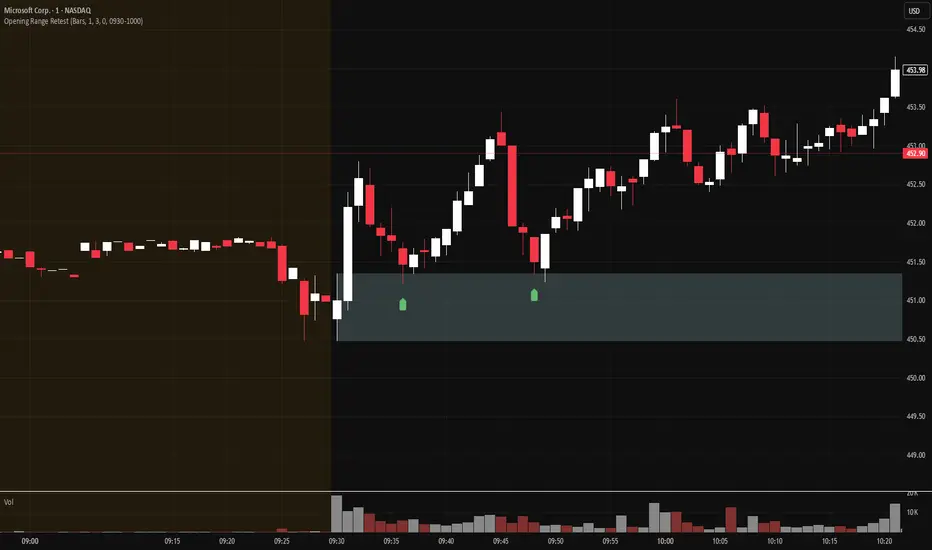
Opening Range Retest█ OVERVIEW
This indicator shows the opening range as a box. It also draws markers and triggers alerts when the opening range is retested. The opening range time is configurable, as is the period of time that must elapse before each return to the opening range is considered a retest.
█ FEATURES
Opening range time configurable in bars or minutes
Configurable "resting" period between the end of the opening range or since the last retest before a new retest is considered valid
Configurable tolerance so that a retest can trigger sooner
Active time range can be used to filter alerts and markers to a specific time window
Visual box showing the opening range, which can be optionally limited to the above-mentioned active time window
Well-documented, high-quality, open-source code for those interested
█ CONCEPTS
This indicator can be used for an opening range retest trading strategy, where long or short positions are taken on the retest of the opening range.
The opening range can be user-configured, so it is suitable for use with any opening range time period (e.g., 1-min, 5-min, 15-min, etc.).
The markers and alerts are equivalent, in the sense that whenever a marker appears, an alert will also trigger (assuming the user has set an alert up).
The alert active time range is simply used as a filter for markers and alerts, meaning that these will not draw or trigger outside of the specified time range.
█ LIMITATIONS
The indicator is intended for equities that have a highly active regular market open. For other security types, it will draw the opening range box from whenever TradingView specifies the market open time.
Gold ORB Strategy (15-min Range, 5-min Entry)The Gold ORB (Opening Range Breakout) Strategy is designed for day traders looking to capitalize on the price action in the early part of the trading day, specifically using a 15-minute range for identifying the opening range and a 5-minute timeframe for breakout entries. The strategy trades the Gold market (XAU/USD) during the New York session.
Opening Range: The strategy defines the Opening Range (ORB) between 9:30 AM EST and 9:45 AM EST using the highest and lowest points during this 15-minute window.
Breakout Entries: The strategy enters trades when the price breaks above the ORB high for a long position or below the ORB low for a short position. It waits for a 5-minute candle close outside the range before entering a trade.
Stop Loss and Take Profit: The stop loss is placed at 50% of the ORB range, and the take profit is set at twice the ORB range (1:2 risk-reward ratio).
Time Window: The strategy only executes trades before 12:00 PM EST, avoiding late-day market fluctuations and consolidations.

True Range & ATRDescription : This indicator plots both the True Range (TR) and the Average True Range (ATR) in a separate pane below the main chart.
- TR represents the absolute price movement range within each candle.
- ATR is a smoothed version of TR over a user-defined period (default: 14), providing insight into market volatility.
- TR is displayed as a histogram for a clearer view of individual candle ranges.
- ATR is plotted as a line to show the smoothed trend of volatility.
This indicator helps traders assess market volatility and potential price movements.

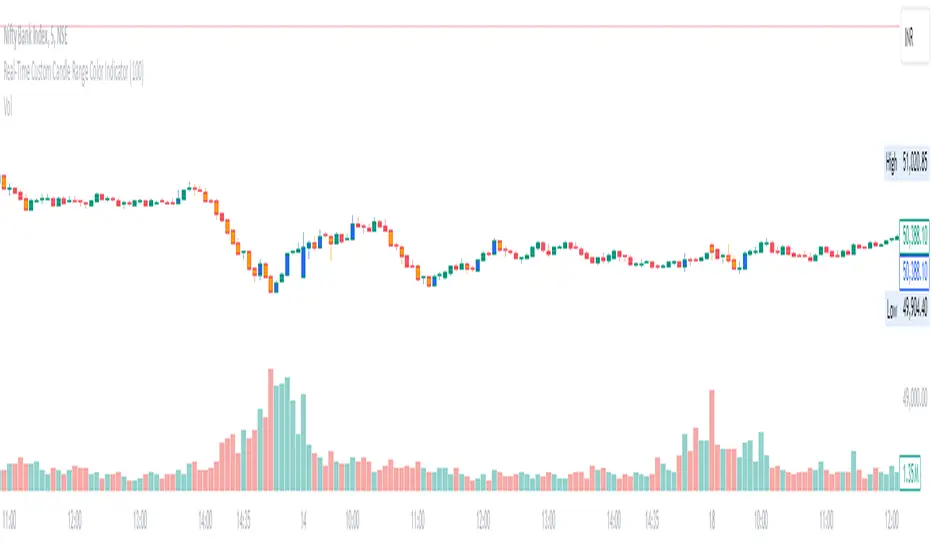
Real-Time Custom Candle Range Color Indicator
The script allows the user to input a custom range value (default set to 100 points) through the userDefinedRange variable. This value determines the minimum range required for a candle to change color.
Calculating Candle Range:
The script calculates the range of each candle by subtracting the low from the high price.
Determining Bullish or Bearish Candles:
It checks whether the close price is higher than the open price to determine if a candle is bullish (isBullish variable).
Coloring Candles:
Based on the custom range input, the script changes the color of the candles:
If the candle's range is greater than or equal to the custom range and it is bullish, the candle color is set to blue (bullishColor).
If the range condition is met and the candle is bearish, the color is set to orange (bearishColor).
If the range condition is not met, the color is set to na (not applicable).
Plotting Colored Candles:
The plotcandle function is used to plot candles with colors based on the custom range and bullish/bearish conditions. The candles will have a higher z-order to be displayed in front of default candles.
Displaying High and Low Price Points:
Triangular shapes are plotted at the high and low price levels using the plotshape function, with colors representing bullish (blue) and bearish (orange) conditions.
In trading, this indicator can help traders visually identify candles that meet a specific range criteria, potentially signaling strength or weakness in price movements. By customizing the range parameter, traders can adapt the indicator to different market conditions and trading strategies. It can be used in conjunction with other technical analysis tools to make informed trading decisions based on candlestick patterns and price movements.
Market Open Range Breakaway v1.2Script Name: Market Open Range Breakaway 1.2
This TradingView script, "Market Open Range Breakaway," highlights the market's opening range for a user-selected day of the week. It calculates the high and low prices during a specified period after the market opens, plots these levels, and tracks the opening price. The script dynamically adjusts for time zones and only displays data during market hours on the chosen day, with optional background shading for the defined range period.
Purpose: Identifies and highlights the market's opening range for a selected day of the week.
Features: Calculates and plots the high, low, and open price during the market's opening range.
Configurable range duration (e.g., 15, 30, or 60 minutes).
Automatically adjusts for different time zones.
Displays levels only during market hours on the target day.
Optional background shading for the opening range.
Inputs: Target day of the week.
Opening range duration.
Use Case: Ideal for traders looking to analyze breakout levels or price movements around the opening range.
