First Candle Session Levels - Automatic Opening Range Tracker x3Automatically marks the high and low of the first candle(s) from up to three customizable time periods on your chart. Perfect for traders who track opening ranges and use them as key support/resistance levels.
What This Indicator Does:
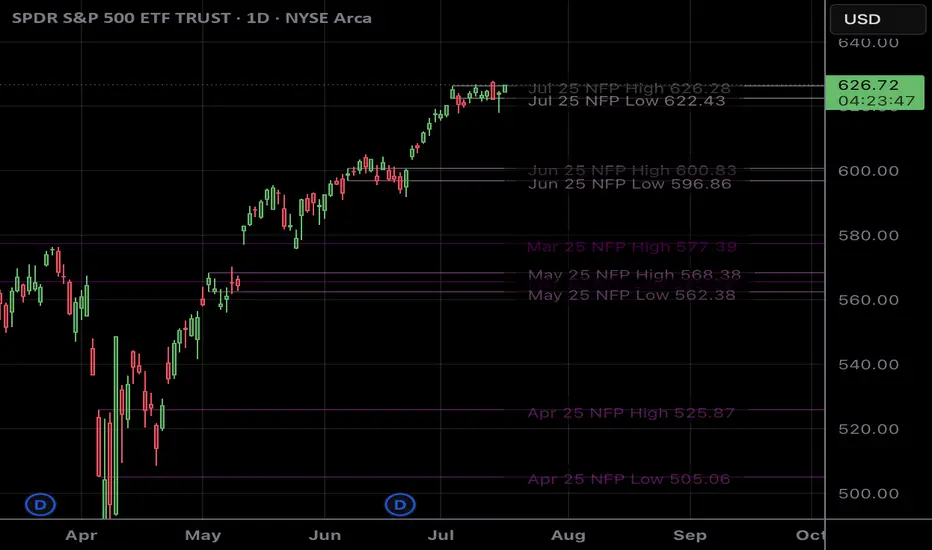
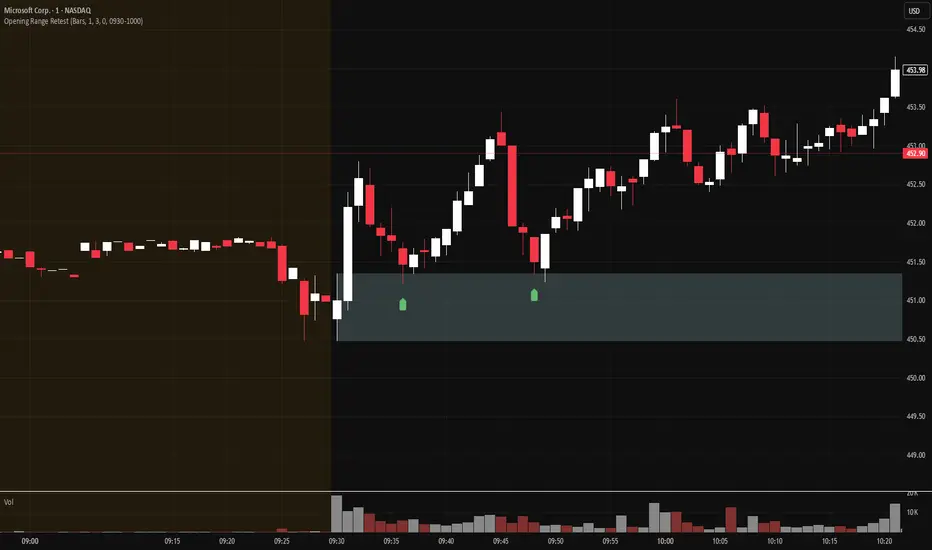
Sets horizontal lines at the high and low of the first candle (or first few candles) at specific times you define. These lines extend forward across your chart, making it easy to see how price interacts with these crucial levels throughout the trading day.
Key Features:
✓ Track 3 independent time periods simultaneously
✓ Adjustable candle count (1-60) - use just the first candle or combine multiple for wider ranges
✓ Each time period has independent color settings for easy identification
✓ Choose from solid, dashed, or dotted line styles
✓ Customize timezone for each period to match any global market
✓ Lines automatically clear each new day to avoid clutter
✓ Option to extend lines forward or keep them within the time period
✓ Works on any timeframe
Perfect For:
Opening range breakout strategies
Support/resistance trading
Tracking multiple market opens (NY, London, Asia)
Identifying key decision levels
Clean, automatic level marking without manual drawing
How to Use:
Add indicator to your chart
Set your desired time (e.g., 10:00 for 10:15 AM)
Choose your timezone
Customize colors and line styles
The indicator automatically draws horizontal lines at the high/low of that candle
Enable or disable each of the three sessions independently depending on which time periods matter to your strategy. Great for intraday traders on 15-minute to 1 hour charts who want automated level tracking.
Clean, simple, effective - let the indicator do the work while you focus on trading!
Indicatore Pine Script®