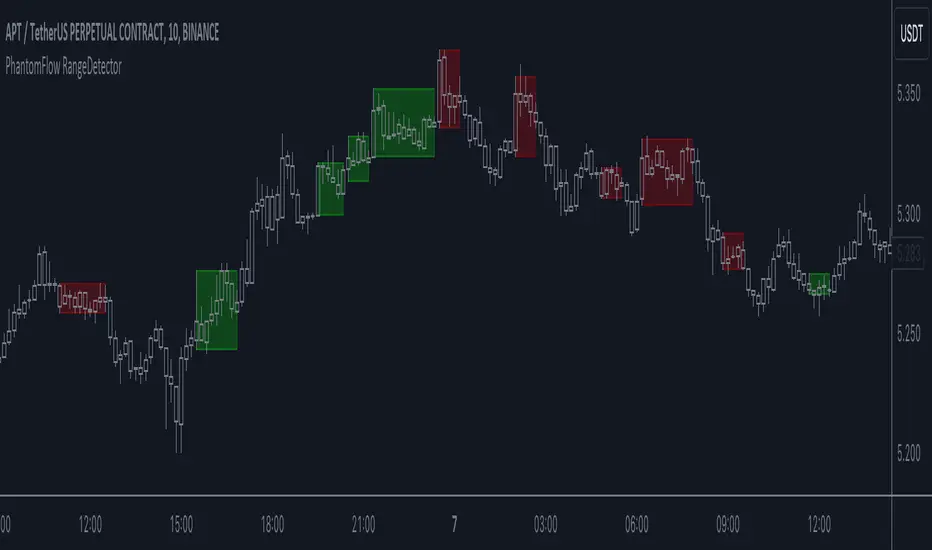
PhantomFlow RangeDetectorPhantomFlow RangeDetector analyzes the current price action of the market and draws ranges depending on the minimum number of bars in the zone of one candle you specify. Each range is colored depending on the closing direction of the candle outside this range. Accordingly, in trend trading, it is advisable to look for long trades from the green zones, and short trades from the red zones (with standard color settings).
If you have a basic understanding of the market context, you can consider such zones in a mirror retest to find trades with higher RR.
Cerca negli script per "range"
EMAflowPRO -Ranges-DISCLAIMER: Always, please keep in mind that market conditions change, past results cannot guarantee the same results in the future.
EMAflowPRO - Ranges-
EMAflowPRO ranges indicator will detect key movements in the market that fit certain conditions and based on that create key tradable zones by providing dynamic and static range levels.
Before reading further please take a look at the indicator values names on the right in the main chart above - these names are linked to the content below when we talk about range structure. The examples included in charts are linked to the area we're discussing (if something was said - most likely closest chart demonstrates it - Also arrows present entries; can be limit or can be market buy/sell in to the wicks.)
Let's find out what indicator does...
Static range logic:
Indicator uses combination of market timing indicators (counting relationship between candles) , fisher transform, stoch rsi, bollinger bands to detect important market price action that show strenght - based on that it will project a static range where key goal is to predict where market will be extremely oversold, extremely overbought or where market could change bias etc.
The setups it provides are very similar to those that come out of harmonic patterns - but it was developed with unique approach without knowing what harmonic patterns are.. so it's not completly the same.
Range is represented by 3 tradable areas (actual trade ideas on charts - arrow points towards a level - on the right there is a scale with a number- limit order can be placed there )
Top of the range - It serves as a shorting area or if top is converted to support can also signal a potential breakout or start of new trend.
Example of a short the top of the range:
29732 - is area where wicks can be sold in to , or limit sell is placed - with higher leverage sl should be tight, with lower sell orders can be spread out up to the middle with sl just above 30500, targets can be choosen based on the provious range top as % moves point.
Example of longing the levels on the recent rise - price staying above middle of the top of the range keeps bias on the upside and potentially signals a break out or start of new trend
Uppper, Middle, Lower part of the range: Sideway area - middle of the range decides direction , above favors the upper levels , below favors the lower levels.
Very nice example where white line is middle of the range and shows that even in strong trend - range projection is able to accurately predict key pullback areas that provide substantial gain. See image below - again settign limit orders where middle of the range is allows you to get a comfortable entry with very big risk reward ratio.
Bottom of the range - market is extremely oversold
Spx example of our recent range from last year's summer - again chart includes both EMAflow indicator and EMAflow ranges as all indicators are extremely complementary and present two sides of the medal sideway and trend view.
Chart only contains ranges but shows the same pair and time:
If price goes below middle of the bottom of the range it could signal a break down or start of new bearish trend.
Dynamic range logic
Since sometimes static range gets broken out or is not respected and the price action is not yet sufficient to generated a new one we included a dynamic supply demand part where dynamic range is generated working in a similar way but does add clarity when static range fails.
example of this can be seen when ftx caused a btc dump we broke through the bottom of the range but dynamic range later showed us new bottom we could trade.
Confluence between both can also provide even more sure levels to place limit orders or to market buy or sell when wicks in to that area occurs.
Minuses:
Since ranges tend to work best when market is sideway - a second part is recommended with EMAflowPRO where focus on moving averages helps you navigate stronger trends.
Not all tfs are well synced with ranges on various assets so you will need to flip through few ones to find the best timeframes that historically worked the best - if you come across an asset that doens't look good you should just change timeframe to higher until you see something that fits or change asset until you get something that looks clear.
Settings:
EMAflow - Ranges - allows you to preset minimum potential of a trade setup you want to look for - default is 6% that ensures you can get a good setup on lower and higher tfs.

Fibonacci Range Detector ║ BullVision🔬 Overview
The Fibonacci Range Mapper is a dynamic technical tool designed to identify, track, and visualize price ranges using Fibonacci levels. Whether you're trading manually or prefer automated structure recognition, this indicator helps you contextualize market moves and locate key price zones with precision.
⚙️ Core Logic
🔍 Range Detection (Auto & Manual Modes)
In Auto mode, the indicator uses an advanced ZigZag system based on ATR or percentage thresholds to confirm market swings and construct Fibonacci-based ranges.
In Manual mode, traders can define their own swing low and high to generate precise custom ranges.
📐 Fibonacci Mapping
Each detected range is automatically plotted with key Fibonacci retracement levels — 0%, 25%, 50%, 75%, 100% — along with optional extensions (127.2% and 161.8%) to anticipate price continuations or reversals.
📋 Live Data Table
An integrated info panel dynamically displays crucial metrics:
• Range size
• Current price zone (Discount / Mid / Premium)
• Position within range (%)
• Distance to range extremes
• Range status (Pending or Confirmed)
🕰️ Historical Memory
Up to 20 past ranges can be stored and visualized simultaneously, helping traders recognize repeated price behaviors and contextual support/resistance levels.
🎨 Visual Highlights
Zones of interest (0–25% = Discount, 75–100% = Premium) are color-coded with custom transparency, and labels can be toggled for clarity. The current active range updates in real time as structure evolves.
🔧 User Customization
• Detection Method: Choose between ATR or % ZigZag for automated swing identification
• Confirmation Delay: Set how many bars to wait before confirming a new high
• Manual Overrides: Select exact price levels when you want full control
• Extensions & Labels: Toggle additional lines and info to suit your charting style
• Visual Table Position: Customize where the data table appears on screen
• Color Scheme: Define your own zone gradients for better visual interpretation
📈 Use Cases
This indicator is ideal for traders who want to:
• Identify value zones within local or macro price structures
• Plan trades around Fibonacci retracement and extension levels
• Detect shifts in market structure using an adaptive ZigZag logic
• Track recurring price ranges and historical reaction points
• Enhance technical confluence with clean, visual price mapping
⚠️ Important Notes
This tool is not a buy/sell signal generator — it is a visual framework for structure-based analysis.
Use it in conjunction with your existing strategy and risk management process.
Always confirm with broader context and multi-timeframe alignment.

Session Range ProjectionsSession Range Projections
Purpose & Concept:
Session Range Projections is a comprehensive trading tool that identifies and analyzes price ranges during user-defined time periods. The indicator visualizes high-probability reversal zones and profit targets by projecting Fibonacci levels from custom session ranges, making it ideal for traders who focus on time-based market structure analysis.
Key Features & Calculations:
1. Custom Time Range Analysis
- Define any time period for range calculation - from traditional sessions (Asian, London, NY) to custom periods like opening ranges, hourly ranges, or 4-hour blocks
- Automatically captures the highest and lowest prices within your specified timeframe
- Supports multiple timezone selections for global market analysis
- Flexible enough for intraday scalping ranges or longer-term swing trading setups
2. Premium & Discount Zones
- Automatically divides the range into premium (above 50%) and discount (below 50%) zones
- Visual differentiation helps identify institutional buying and selling areas
- Color-coded boxes clearly mark these critical price zones
3. Optimal Trade Entry (OTE) Zones
- Highlights the 79-89% retracement zone in premium territory
- Highlights the 11-21% retracement zone in discount territory
- These zones represent high-probability reversal areas based on institutional order flow concepts
4. Fibonacci Projections
- Projects 11 customizable Fibonacci extension levels from the range extremes
- Levels extend both above and below the range for symmetrical analysis
- Each level can be individually toggled and color-customized
- Default levels include common retracement ratios: -0.5, -1.0, -2.0, -2.33, -2.5, -3.0, -4.0, -4.5, -6.0, -7.0, -8.0
How to Use:
Set Your Time Range: Input your desired session start and end times (24-hour format)
Select Timezone: Choose the appropriate timezone for your trading session
Customize Display: Toggle various visual elements based on your preferences
Monitor Price Action: Watch for reactions at projected levels and OTE zones
Set Alerts: Configure sweep alerts for when price breaks above/below range extremes
Input Parameters Explained:
Time Range Settings
Range Start/End Hour & Minute: Define your analysis period
Time Zone: Ensure accurate session timing across different markets
Visual Settings
Range Box: Toggle the premium/discount zone visualization
Horizontal Lines: Customize high/low line appearance
Internal Range Levels: Show/hide equilibrium and OTE zones
Labels: Configure text display for key levels
Fibonacci Projections: Enable/disable extension levels
Display Settings
Historical Ranges: Show up to 10 previous session ranges
Alert Type: Choose between high sweep, low sweep, or both
Trading Applications:
Session-Based Trading: Analyze specific market sessions (Asian, London, New York, opening ranges, hourly ranges)
Reversal Trading: Identify high-probability reversal zones at OTE levels
Breakout/Reversal Trading: Monitor range breaks/reversals with built-in sweep alerts
Risk Management: Use Fibonacci projections as profit targets or rejection areas
Multi-Timeframe Analysis: Apply to any timeframe for various trading styles
Important Notes:
This indicator is for educational purposes only and should not be considered financial advice
Past performance does not guarantee future results
Always use proper risk management when trading
The indicator automatically manages historical data to maintain chart performance

Trend-Range IdentifierTrend trading algorithms fail in ranging market and Swing trading algorithm fail in trending market. Purpose of this indicator is to identify if the instrument is trending or ranging so that you can apply appropriate trading algorithm for the market.
Process:
ATR is calculated based on the input parameter atrLength
Range/Channel containing upLine and downLine is calculated by adding/subtracting atrMultiplier * atr to close price.
This range/channel will remain same until the price breaks either upLine or downLine.
Once price crosses one among upLine and downLine, then new upLine/downLine is calculated based on latest close price.
If price breaks upLine, the trend is considered to be up until the next line break or no lines are broken for rangeLength bars. During this state, candles are colored in lime and upLine/downLine are colored in green.
If price breaks downLine, the trend is considered to be down until the next line break or no lines are broken for rangeLength bars. During this state, candles are colored in orange and upLine/downLine are colored in red.
If close price does not break either upLine or downLine for rangeLength bars, then the instrument is considered to be in range. During this state, candles are colored in silver and upLine/downLine are colored in purple.
In ranging duration, we display one among Keltner Channel, Bollinger Band or Donchian Band as per input parameter : rangeChannel . Other parameters used for calculation are rangeLength and stdDev
I have not fully optimized parameters. Suggestions and feedback welcome.

cephxs + fadi / Previous Time Based Dealing RangesPREVIOUS TIME BASED DEALING RANGES
Visualize previous and current higher timeframe dealing ranges with dual-box OHLC representation, extending reference lines, and HTF candle displays.
Open Source Fork of @fadizeidan 's HTF Candles Indicator
OVERVIEW
This indicator displays time-based dealing ranges from higher timeframes directly on your chart. It shows the complete price action structure of previous (or current/forming) periods using a dual-box system: one box for the full High-Low range and another for the Open-Close body. Reference lines extend from key levels to help identify potential support, resistance, and mean reversion zones.
Perfect for traders who use ICT concepts, market structure analysis, or any methodology that relies on understanding where price has been relative to previous dealing ranges.
KEY FEATURES
Dual-Box Range Visualization: Each range displays two boxes - the full H-L range (outer) and the O-C body (inner) - giving immediate visual context of candle structure
Multiple Timeframes: Support for 90m, 4H, 6H, 1D, 1W, 1M, and 3M ranges
Previous/Current Mode: View completed ranges (Previous) or the forming range (Current) with real-time updates
Auto Mode: Automatically selects the appropriate range based on your chart timeframe
Reference Lines: Extending lines from High, Mid, Low (or Quadrants: H/75/M/25/L) with trade-into detection
HTF Candle Display: Visual HTF candles positioned to the right of price for context
6H Session Support: Session-aware ranges for Asia, London, NY AM, and NY PM with labeled names
Open Line: Vertical line marking the range's opening price/time
Imbalance Detection: Fair Value Gaps and Volume Imbalances highlighted on HTF candles
MODE OPTIONS
Previous/Current: Previous shows the last completed range. Current shows the forming range with dynamic H/L/C updates
Auto/Manual: Auto selects range by chart TF. Manual lets you choose specific ranges
Extend Box (Current): In Current mode, extends the box's right edge as price develops
AUTO MODE TIMEFRAME LOGIC
Auto mode now selects up to 3 ranges automatically based on chart timeframe, providing multi-timeframe context:
Chart ≤ 3m → 90m + 6H + 1D
Chart 4m-14m → 6H + 1D + 1W
Chart 15m-59m → 1D + 1W (+ 1M available)
Chart 1H-3H → 1D + 1W + 1M
Chart 4H-23H → 1W + 1M + 3M
Chart ≥ 1D → 1M + 3M
INPUTS
Mode
Mode: Previous/Current - Choose completed or forming range
Auto/Manual: Auto selects range by chart TF, Manual lets you choose
Extend Box (Current): Extends box right edge with price (Current mode only)
Show Range Boxes: Toggle box visibility (lines remain visible when off)
Filter Lines by Distance: When boxes are hidden, hide reference lines that are too far from current price (Really Close / Balanced / Slightly Far)
Previous Ranges
Range 1: Enable/disable, select timeframe (90m/4H/6H/1D/1W/1M/3M), max display count (1-2)
Range 2: Second range layer for multi-timeframe analysis
Range 3: Third range layer for additional context
Reference Lines
Line Mode: Levels (H/M/L) or Quadrants (H/75/M/25/L)
Line Style: Solid, dashed, or dotted
Line Thickness: 1-4 pixels
Show Labels: Toggle reference line labels
Label Offset: Distance of labels from current price (1-20 bars)
HTF Candle Levels: Show mini H/M/L lines on HTF candles
Open Line: Vertical line at range open with customizable style
Range Boxes & Colors
Per-Range Colors: Customize box and line colors for each timeframe (90m, 4H, 6H, 1D, 1W, 1M, 3M)
HTF Candle Styling
Show HTF Candles: Toggle HTF candle display
Body/Border/Wick Colors: Customize bull and bear candle appearance
Padding/Buffer/Width: Control candle spacing and size
Labels
HTF Label: Show timeframe label above/below candles
Remaining Time: Countdown timer to candle close
Label Position: Top, Bottom, or Both
Label Alignment: Align across timeframes or follow individual candles
Imbalance
Fair Value Gap: Highlight FVGs on HTF candles
Volume Imbalance: Highlight VIs on HTF candles
HOW TO USE
Add the indicator to your chart
Choose Previous or Current mode based on your analysis preference
Use Auto mode for intelligent range selection, or Manual to select specific timeframes
Reference lines extend from range levels - watch for price reactions at H/M/L
In Current mode, observe how the range develops with real-time updates
Use the HTF candles on the right for quick multi-timeframe context
REFERENCE LINE LABELS
Labels follow this format:
Previous mode: pD-H (previous Daily High), pW-M (previous Weekly Mid), p6H-London-L (previous 6H London Low)
Current mode: D-H (Daily High), W-M (Weekly Mid), 6H-Asia-L (6H Asia Low)
6H SESSION NAMES
Asia: 18:00-00:00 ET
London: 00:00-06:00 ET
NYAM: 06:00-12:00 ET
NYPM: 12:00-18:00 ET
RECOMMENDED TIMEFRAMES
Tick/Second charts: 90m ranges
1-5 minute charts: 6H or 1D ranges
15-60 minute charts: 1D or 1W ranges
4H charts: 1W or 1M ranges
Daily charts: 1M or 3M ranges
Or simply use Auto mode to let the indicator choose the optimal range.
TIPS
The Mid (M) level often acts as equilibrium - watch for mean reversion plays
High and Low levels are natural support/resistance zones
In Current mode, watch how price interacts with the forming range boundaries
Combine with your existing analysis for confluence
The Open Line helps identify the "true open" of each range for gap analysis
DISCLAIMER
This indicator is for educational and informational purposes only.
Past performance does not guarantee future results.
Always use proper risk management and never risk more than you can afford to lose.
Trading involves substantial risk of loss and is not suitable for all investors.
CREDITS
Original indicator by @fadizeidan.
Enhanced by cephxs/fstarcapital
CHANGELOG
Pro + v1.1: Reupload + Added 90m ranges for ultra-low timeframe analysis, distance-based line filtering (lines-only mode), third range slot.
Open sourced so users can add more slots.
Enjoy 🤙

Multi-Session Opening RangesThe Multi-Session Opening Ranges indicator plots the Opening Range (OR) levels for three major trading sessions: Asia, London, and New York. It displays the high (ORH), low (ORL), and midline of each session's opening range, helping traders identify key price levels for potential breakouts, reversals, or support/resistance zones.
This indicator is highly customizable, allowing users to tailor the appearance and behavior of each session independently.
Features
Multi-Session Support: Visualizes Opening Ranges for Asia, London, and New York sessions, with customizable session times and timezones.
Customizable Lines: Adjust the color, style (solid, dashed, dotted), and width of ORH, ORL, and midline for each session.
Offset Control: Set a custom offset (in bars) for lines and labels to position them away from price action for better visibility.
Fill Customization: Choose the fill color for the area between ORH and ORL for each session.
Historical Data Option: Toggle the display of historical OR levels to focus on current session data or analyze past ranges.
Timezone Flexibility: Select from a wide range of timezones to align session times with your trading needs.
Label Customization: Adjust the size of labels (tiny, small, normal, large, huge) for clarity on any chart.
How It Works
The indicator identifies the high and low prices during the user-defined opening range period for each session (default: 5 minutes). It then draws:
ORH (Opening Range High): The highest price during the session's opening range.
ORL (Opening Range Low): The lowest price during the session's opening range.
Midline: The average of ORH and ORL, plotted as a dashed line by default.
Filled Area: A semi-transparent fill between ORH and ORL to highlight the range.
Lines and labels extend until the start of the next session or can be offset by a user-specified number of bars for better chart readability. The indicator supports historical data display for analyzing past session ranges.
Inputs
Display:
Show Historical Data: Enable/disable historical OR levels.
Timezone: Select the timezone for session calculations (e.g., UTC-4, UTC+1, etc.).
Asia/London/New York Sessions:
Show Session: Enable/disable the session.
Session Time: Define the start and end time for the opening range (e.g., "0930-0935:1234567" for 9:30–9:35 AM, all days).
Asia/London/New York Style:
ORH/ORL/Midline Color: Set the color for each line.
ORH/ORL/Midline Style: Choose solid, dashed, or dotted styles.
ORH/ORL/Midline Width: Adjust line thickness (1–5).
OR Fill Color: Customize the fill color for the OR area.
Lines/Labels Offset: Set the offset (in bars, -50 to 50) to shift lines and labels relative to price action.
General Style:
Label Size: Set the size of ORH and ORL labels (tiny, small, normal, large, huge).
Usage
Add the indicator to your chart.
Configure session times to match your trading instrument and timezone.
Customize colors, line styles, widths, and offsets for each session to suit your chart preferences.
Use the ORH, ORL, and midline levels to identify key price zones for trading strategies, such as breakouts or reversals.
Notes
Ensure session times do not overlap to avoid conflicts in visualization.
Large offsets may place lines/labels outside the visible chart area; adjust as needed.
The indicator is optimized for intraday timeframes but works on any timeframe.

Consolidation Range Detector [Pt]█ Author's Note:
After extensively reviewing the existing consolidation detection tools in the TradingView library, I found that none fully met my expectations. Some tools were overly sensitive, producing too many invalid ranges, while others lacked the necessary sensitivity. Consequently, I decided to develop my own tool. I hope that you, fellow traders, find it valuable and enjoy using it.
█ Description:
The Consolidation Range Detector is a sophisticated TradingView tool designed to identify and visualize periods of price consolidation on any financial chart. This indicator employs advanced algorithms to detect ranges where price movements are confined, helping traders spot potential breakout zones and make informed trading decisions.
█ Key Features:
► Customizable Detection Sensitivity: Adjust the sensitivity of the detection algorithm to suit your trading strategy, ensuring a precise fit within the consolidation range.
► Dynamic Coloring: Choose between random or fixed colors for the consolidation ranges, with options to match different background color schemes (Dark, Light, Neutral).
► Visual Clarity: Highlight detected consolidation ranges directly on the chart with customizable color schemes to enhance visibility and provide clear visual cues.
► ATR-Based Validation: Ensures detected consolidation ranges are significant and reliable by using the Average True Range (ATR) for validation.
█ User-Defined Inputs:
► Minimum Detection Bars: Set the minimum number of bars required to detect a consolidation range.
► Max Range Multiplier: Define the maximum range for detection as a multiple of the ATR.
► Detection Sensitivity: Adjust the sensitivity of the detection algorithm. Higher values mean a tighter fit within the consolidation range.
► Color Options: Choose the color for the consolidation range boxes and decide whether to use random colors.
► Color Scheme (Background): Select a color scheme for the chart background (Dark, Light, Neutral).
█ How It Works:
► Range Detection: The indicator scans the chart for potential consolidation ranges based on user-defined parameters. It calculates the average price and ATR to determine the significance of the range.
► Validation: Each detected range is validated based on criteria such as ATR threshold, range validity, average price comparison, and the number of touches at the range boundaries.
► Visualization: Validated ranges are highlighted on the chart with colored boxes, providing a clear visual cue of potential consolidation zones.
█ Usage Examples:
► Example 1:
The image below showcases the Consolidation Range Detector in action on a chart of S&P 500 E-mini Futures. The indicator highlights several consolidation ranges with different colors, demonstrating its ability to adapt to varying market conditions and visually emphasize key areas of price consolidation. The annotations for breakouts and price reactions are manually marked to illustrate the practical application of the tool in identifying potential trading opportunities based on these key areas.
█ Practical Applications:
► Identify Breakout Zones: Use the detected consolidation ranges to identify potential breakout zones, helping to anticipate significant price movements.
► Identify Key Price Levels: The tool helps in pinpointing key price levels where there is a high probability of significant price reactions, providing crucial insights for trading strategies.
► Enhance Technical Analysis: Integrate the Consolidation Range Detector into your existing technical analysis toolkit to improve the accuracy of your trading decisions.
█ Conclusion:
The Consolidation Range Detector is a powerful tool for traders looking to identify periods of price consolidation and potential breakout zones. With its customizable settings and advanced detection algorithms, it provides a reliable and visual method to enhance your trading strategy. Whether you're a beginner or an experienced trader, this indicator can add significant value to your technical analysis.
█ Cautionary Note:
While the Consolidation Range Detector is a powerful tool, it's important to combine it with other indicators and analysis methods for comprehensive trading decisions. Always consider market context and external factors when interpreting detected consolidation ranges.

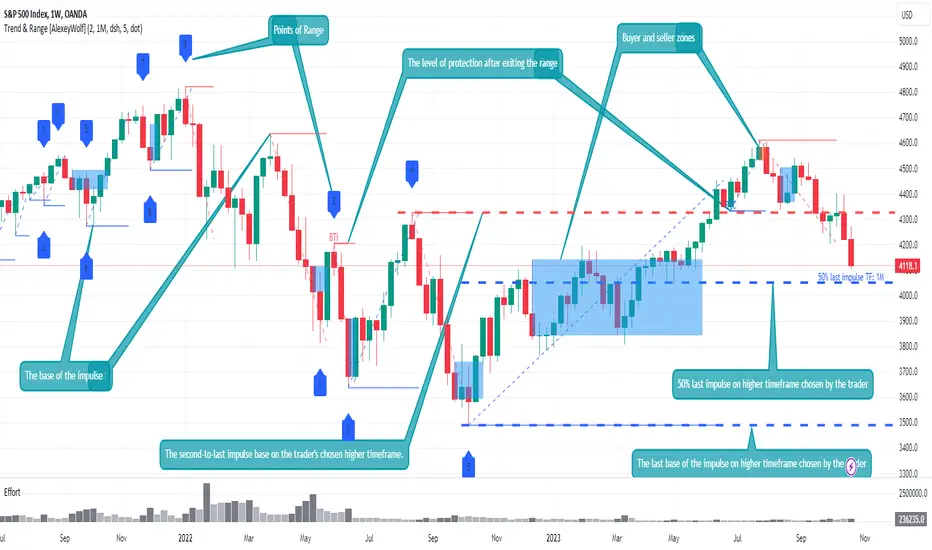
Advanced VSA: Trend and Range LevelsThe indicator is designed for traders who are more interested in market structures and price action using volumes. Analyzing volumes, key market levels, market phases (trend or range/sideways), and multiple timeframes can help the trader build a clearer and more comprehensive view of the market. The data analysis algorithm is developed based on VSA methods, elements of the ICT concept, and the results of my research to assist trader in gaining a better understanding of the market and uncovering information that might go unnoticed.
The key idea is to consider multiple timeframes in trading. Understanding larger market movements from higher timeframes can provide a deeper context when making trading decisions, aiming to assist in more effective entries and exits. This is achieved by identifying the trend and its support levels on multiple timeframes, identifying ranges and their current boundaries, as well as buyer and seller interest zones.
Key Features
Trend Identification: The indicator determines the trend and its current support level. All significant price &movements occur in the form of impulses (either by sellers or buyers). An impulse consists of one or several consecutive candlesticks, at least one of which has a closing price beyond the boundaries of the previous impulse. The indicator displays the base of the impulse and/or the entire impulse. The base of the impulse represents the trend's support level.
Range Identification: The indicator can identify ranges and their current boundaries. Institutional traders take positions within price ranges, and many market reversals occur after flats. A range is a sequential price movement up and down within a specific price range. A range is formed by a minimum of 4 points, 2 above and 2 below, and is defined by its boundaries. The indicator detects ranges based on two (two consecutive impulses in one direction) or three impulses (the first and third in one direction, and the second in the opposite direction). The indicator displays the current boundary points of the range and the level of protection after exiting the range and initiating a trend.
Buyer and seller zones within impulses: After the impulse ends, a correction occurs. It is advisable to look for entry points during this correction in the direction of the impulse from the zone of interest of the owner of the impulse: the buyer's zone for a long impulse and the seller's zone for a short impulse. A zone consists of a series of consecutive candlesticks grouped on the chart in a specific manner.
Multi-Timeframe Trend Identification: The indicator also identifies the trend on two higher timeframes and displays the two latest bases of impulses from those higher timeframes on the chart.
Additional Features
Identification of Test Levels and Effort. A test is the price's return to a zone or to a candle of effort, followed by a continuation in the direction of the initial price movement. It is characterized by the test level. An effort or effort candle is a single candle that is individually larger in volume than the previous 2.
Example Use Cases
You can display the base levels of impulses from a 4-hour time frame and a daily time frame on a 15-minute chart to keep track of important levels from higher timeframes.
By exploring different timeframes, you can identify consolidations (range/sideways movements) and trade within them in the direction of the trend from higher timeframes.
If the market is in a trending phase (the presence of a trend is determined by two consecutive impulses in the same direction), look for trades in the direction of the impulse, following these priorities:
When the impulse base level is protected by the host of the impulse.
During corrections, look for buy trades in the buyer's zone for an uptrend and sell trades in the seller's zone for a downtrend.
During corrections, look for buy trades from a buyer's effort candle for an uptrend and sell trades from a seller's effort candle for a downtrend.
If the market is in a consolidation phase (range), look for trades:
When the current or maximum/minimum historical boundaries of the consolidation (range) are protected, look for trades towards the opposite current boundary.
If the price exits the consolidation/range (closes outside all consolidation boundaries, including both current and historical boundaries), then during corrections, look for trades in the direction of the exit.
Settings
Trend: Display base levels of impulses and/or the entire impulse. Sideways Ranges (Sideways Markets): Display the required number of sideways ranges on the chart, along with protection levels for exiting the sideways range. There are two modes for finding sideways ranges. The first mode requires touching points. The second mode (advanced) does not require precise touching of points if there are increased volumes at the extreme points of the sideways range. Touching these volumes is sufficient for the price.
Zones: Display zones on the chart. Choose the types of displayed zones and their colors. They are divided into three types. The first type is the most promising for finding trades. Type 3 represents more aggressive trades.
Test Levels: Display test levels for zones and efforts on the chart. There are three types of test levels. The first type is the most promising for finding trades. Type 3 is not recommended for finding trades as it represents the most aggressive trades.
Higher Time Frames: Choose 2 timeframes and the types of displayed impulse base lines.
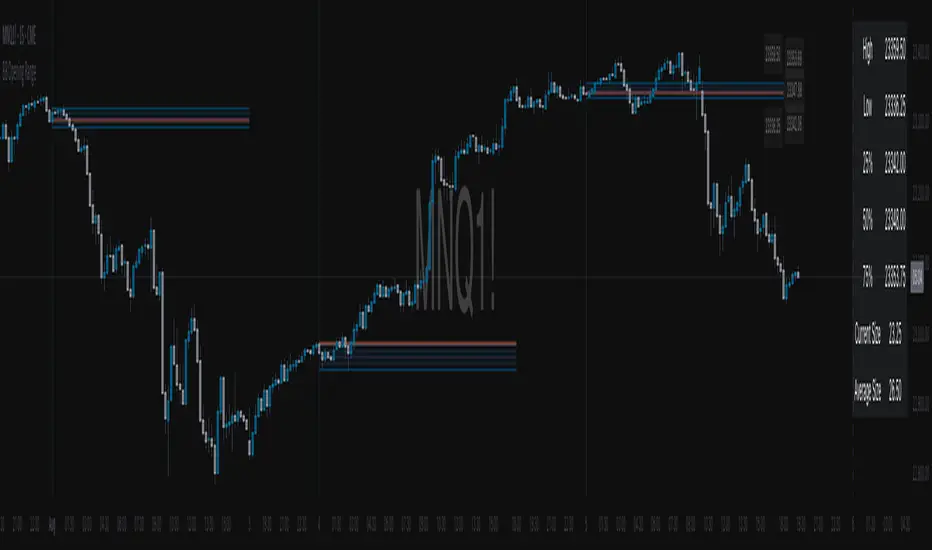
Low Volatility Range Breaks [BigBeluga]Low Volatility Range Breaks
The Low Volatility Range Breaks indicator is an advanced technical analysis tool designed to identify periods of low volatility and potential breakout opportunities. By visualizing low volatility ranges as ranges and tracking subsequent price movements, this indicator helps traders spot potential high-probability trade setups.
🔵 KEY FEATURES
● Low Volatility Detection
Identifies periods of low volatility based on highest and lowest periods and user-defined sensitivity
Uses a combination of highest/lowest price calculations and ATR for dynamic adaptation
● Volatility Box Visualization
Creates a box to represent the low volatility range
Box height is adjustable based on ATR multiplier
Includes a mid-line for reference within the box
● Breakout Detection
Identifies when price breaks above or below the volatility box
Labels breakouts as "Break Up" or "Break Dn" on the chart
Changes box appearance to indicate a completed breakout
● Probability Tracking
Counts the number of closes above and below the box's mid-line
Displays probability counters for potential upward and downward moves
Resets counters after a confirmed breakout
🔵 HOW TO USE
● Identifying Low Volatility Periods
Watch for the formation of volatility boxes on the chart
These boxes represent periods where price movement has been confined
● Anticipating Breakouts
Monitor price action as it approaches the edges of the volatility box
Use the probability counters to gauge the likely direction of the breakout
● Trading Breakouts
Consider posible entering trades when price breaks above or below the volatility box
Use the breakout labels ("Break Up" or "Break Dn") as a trading opportunity
● Managing Risk
Use the opposite side of the volatility box as a potential invalidation level
Consider the box height for position sizing and risk management
● Trend Analysis
Multiple upward breakouts may indicate a developing uptrend
Multiple downward breakouts may suggest a forming downtrend
Use in conjunction with other trend indicators for confirmation
🔵 CUSTOMIZATION
The Low Volatility Box Breaks indicator offers several customization options:
Adjust the volatility length to change the period for highest/lowest price calculations
Modify the volatility level to fine-tune the sensitivity of low volatility detection
Adjust the box height multiplier to change the size of volatility boxes
By fine-tuning these settings, traders can adapt the indicator to various market conditions and personal trading strategies.
The Low Volatility Range Breaks indicator provides a unique approach to identifying potential breakout opportunities following periods of consolidation. By visually representing low volatility periods and tracking subsequent price movements, it offers traders a powerful tool for spotting high-probability trade setups.
This indicator can be particularly useful for traders focusing on breakout strategies, mean reversion tactics, or those looking to enter trades at the beginning of new trends. The combination of visual cues (boxes and breakout labels) and quantitative data (probability counters) provides a comprehensive view of market dynamics during and after low volatility periods.
As with all technical indicators, it's recommended to use the Low Volatility Range Breaks indicator in conjunction with other forms of analysis and within the context of a well-defined trading strategy. While this indicator can provide valuable insights into potential breakouts, it should be considered alongside other factors such as overall market trends, volume, and fundamental analysis when making trading decisions.

Opening Range with Breakouts & Targets [LuxAlgo]Opening Range with Breakouts & Targets is based on the long-standing Opening Range Breakout strategy popularized by traders such as Toby Crabel and Mark Fisher.
This indicator measures and displays the price range created from the first period within a new trading session, along with price breakouts from that range and targets associated with the range width.
🔶 USAGE
The Opening Range (OR) can be a powerful tool for making a clear distinction between ranging and trending trading days. Using a rigid structure for drawing a range, provides a consistent basis to make judgments and comparisons that will better assist the user in determining a hypothesis for the day's price action.
NOTE: During a suspected "Range Day", the Opening Range can be used for reversion strategies, typically targeting the opposite extreme of the range or the mean of the range. However, more commonly the Opening Range is used for breakouts on suspected "Trend Days", targeting further upward or downward market movement.
The common Opening Range Breakout Strategy (ORB) outlines a structure to enter and exit positions based on rigid points determined by the Opening Range. This methodology can be adjusted based on markets or trading styles.
Determine Opening Range High & Low: These are the high and low price within a chosen period of time after the market opens. This can be customized to the user's trading style and preference. Common Ranges are from 5-60 mins.
Watch for a Breakout with Volume: A Breakout occurs when price crosses the OR High (ORH) or OR Low (ORL), an increase in volume is typically desired when witnessing these breakouts to confirm a stronger movement.
Manage Risk: Based on user preference and the appropriately determined amount of risk, multiple ways can be determined to manage risk by using Opening Range.
For Example: A stop-loss could be set at OR Mean (ORM) or the opposite side of the range, while a profit target could optionally be set at the first price target generated by the script.
Alternatively, a user might want to use a Moving Average (MA) as an adaptive stop-loss and use price targets to scale out. These are just 2 examples of the possible options, both capable with this tool.
🔹 Signals
Signals will fire based on the break of the opening range, this is indicated by arrows above and below the range boundaries.
Optionally, a bias can be added to these signals to aid in mitigating false signals by using a directional filter based on the current day's OR relative to the previous day's OR.
Regardless of the signal bias being enabled, the Opening Range Zone will always be colored directionally according to this.
If the current day's OR is above the previous day's OR, the Zone will be Green.
If the current day's OR is below the previous day's OR, the Zone will be Red.
By enabling the signal bias, signals in the opposite direction of the daily bias will fire on the cross of the first target in that direction.
🔹 Targets
In this indicator, targets are not limited and will generate infinitely based on a % width of the Opening Range.
Additionally, there are 2 display methods for these targets.
Extended: Extends the targets to the current bar and displays all targets that have been crossed so far within the session.
Adaptive: Extends only the 2 closest targets surrounding price, allowing for a display consisting of fewer lines at one time.
🔶 DETAILS
🔹 Historical Display
This indicator can be utilized in multiple ways, for use in real-time, and for historical analysis to form methods. Because of this, the indicator has an option to display only the current day's data or the entire historical data. This can also help clean up the chart when it is in use.
🔹 Time Period
The specific time period to create the opening range is entirely up to each user's preference, by default it is set to 30 mins; however, this time period can be edited with full control if desired.
Simply toggle on the "Custom Range" and input a range of time to create the range.
🔹 Session Moving Average
The Session Moving Average is a common Moving Average, which resets at the beginning of a new session. This allows for an unbiased MA that was created entirely from the current session's price action.
Note: The start of the session is determined by the start of the Opening Range if using a custom range of time.
🔶 SETTINGS
Show Historical Data: Choose to display only the current session's data or the full history of data.
Opening Range Time Period: Select the time period to form the opening range from. This operates on Session Start, so it will change with the chart.
Custom Range: Opt for a custom Range by enabling this and inputting your range times as well as your needed timezone.
Breakout Signal Bias: Select if the Breakout Signals will use a Daily Directional Bias for firing.
Target % of Range: Sets the % of the Range width that will be used as an increment for the Targets to display in.
Target Cross Source: Choose to use the Close price or High/Low price as the crossing level for Target displays. When this source crosses a target it will generate more targets.
Target Display: Choose which style of display to use for targets.
Session Moving Average: Optionally enable a Moving average of your choice that resets at the beginning of each session (start of opening range).

Consolidation Range with Signals (Zeiierman)█ Overview
Consolidation Range with Signals (Zeiierman) is a precision tool for identifying and trading market consolidation zones, where price contracts into tight ranges before significant movement. It provides dynamic range detection using either ADX-based trend strength or volatility compression metrics, and offers built-in take profit and stop loss signals based on breakout dynamics.
Whether you trade breakouts, range reversals, or trend continuation setups, this indicator visualizes the balance between supply and demand with clearly defined mid-bands, breakout zones, and momentum-sensitive TP/SL placements.
█ How It Works
⚪ Multi-Method Range Detection
ADX Mode
Uses the Average Directional Index (ADX) to detect low-trend-strength environments. When ADX is below your selected threshold, price is considered to be in consolidation.
Volatility Mode
This mode detects consolidation by identifying periods of volatility compression. It evaluates whether the following metrics are simultaneously below their respective historical rolling averages:
Standard Deviation
Variance
Average True Range (ATR)
⚪ Dynamic Range Band System
Once a range is confirmed, the system builds a dynamic band structure using a volatility-based filter and price-jump logic:
Middle Line (Trend Filter): Reacts to price imbalance using adaptive jump logic.
Upper & Lower Bands: Calculated by expanding from the middle line using a configurable multiplier.
This creates a clean, visual box that reflects current consolidation conditions and adapts as price fluctuates within or escapes the zone.
⚪ SL/TP Signal Engine
On detection of a breakout from the range, the indicator generates up to 3 Take Profit levels and one Stop Loss, based on the breakout direction:
All TP/SL levels are calculated using the filtered base range and multipliers.
Cooldown logic ensures signals are not spammed bar-to-bar.
Entries are visualized with colored lines and labeled levels.
This feature is ideal for traders who want automated risk and reward reference points for range breakout plays.
█ How to Use
⚪ Breakout Traders
Use the SL/TP signals when the price breaks above or below the range bands, especially after extended sideways movement. You can customize how far TP1, TP2, and TP3 sit from the entry using your own risk/reward profile.
⚪ Mean Reversion Traders
Use the bands to locate high-probability reversion zones. These serve as reference zones for scalping or fade entries within stable consolidation phases.
█ Settings
Range Detection Method – Choose between ADX or Volatility compression to define range criteria.
Range Period – Determines how many bars are used to compute trend/volatility.
Range Multiplier – Scales the width of the consolidation zone.
SL/TP System – Optional levels that project TP1/TP2/TP3 and SL from the base price using multipliers.
Cooldown – Prevents repeated SL/TP signals from triggering too frequently.
ADX Threshold & Smoothing – Adjusts sensitivity of trend strength detection.
StdDev / Variance / ATR Multipliers – Fine-tune compression detection logic.
-----------------
Disclaimer
The content provided in my scripts, indicators, ideas, algorithms, and systems is for educational and informational purposes only. It does not constitute financial advice, investment recommendations, or a solicitation to buy or sell any financial instruments. I will not accept liability for any loss or damage, including without limitation any loss of profit, which may arise directly or indirectly from the use of or reliance on such information.
All investments involve risk, and the past performance of a security, industry, sector, market, financial product, trading strategy, backtest, or individual's trading does not guarantee future results or returns. Investors are fully responsible for any investment decisions they make. Such decisions should be based solely on an evaluation of their financial circumstances, investment objectives, risk tolerance, and liquidity needs.

ORB opening range breakoutThis indicator plots the opening range high and low for a selected period of time in minutes after the market opens on an intraday chart to allow the user to visualize the high and low of the opening range for use in the Opening Range Breakout (ORB) strategy.
The Opening Range Breakout (ORB) strategy is a trading approach that involves identifying the price range within the first few minutes of a market session and then waiting for the price to break out of that range. This indicator facilitates this strategy through the use of shaded regions and/or price levels.
Features
Able to plot the high and low for any opening range above 1 min on any intraday timeframe
Fully customizable ORB region, price level, price axis, label
The inclusion of the Bollinger band along with it's Moving Average serves multiple purposes to assist the user in the opening range breakout strategy
Highlights to the user the deviation from the Moving Average due to an opening range breakout so that the user is better informed on whether to avoid entering a position, exit a position, or monitor the situation more closely
Highlights area of support or resistance formed by the Moving Average of Bollinger Band
Inform the user of the current trend direction to serve as confluence during an opening range breakout
What sets this indicator apart from others
In other ORB indicators, the opening range must be a multiple of the current chart's timeframe, restricting users on the intraday timeframes that can be used. E.g. if the user is using the 15 minutes opening range, they are restricted to use the 1, 3, 5, 15 minute(s) chart.
This indicator gives the user the flexibility to set any opening range above 1 min on any intraday timeframe. E.g. if the user is using the 15 minutes opening range, they are free to use any intraday timeframe on their chart, such as 1 hour or 2 hours chart.
How to use
Input the opening time range of interest in minutes
Check the "ORB region" checkbox to shade the ORB region
Check the "PRICE LEVEL" checkbox to draw a horizontal line of the high and low
Check the "PRICE AXIS" checkbox to plot the values on the price axis
Check the "LABEL" checkbox to draw a label of the high and low

IND-Range Box [Salar Kamjoo]Hello to all dear traders,
One of the trading methods in financial markets is Range Box Trading. Ranges are specific price levels where the market reaches equilibrium, meaning the buying force is roughly equal to the selling force. Consequently, the market neither moves significantly upwards nor downwards; it oscillates within a particular range. The indicator I have designed for you is based on this concept. It utilizes the number of candles and their oscillations to identify specific ranges on the chart. These ranges are drawn based on the maximum and minimum of the box.
The optimal time for trading and using this indicator is when the market is less volatile, specifically outside of the overlapping London and New York sessions. Additionally, be cautious during news releases as they might lead to stop-hunting scenarios. Therefore, the best time to employ this indicator is when the market is relatively calm.
This indicator has 4 settings:
Setting Number 1: Number of Candles
This setting determines the number of candles involved in calculating the range boxes. A higher value indicates longer range boxes will be identified for you, while a lower value results in quicker recognition of range boxes. However, a smaller value may reduce the reliability of the identified range boxes. The recommended value for this setting may vary for each currency pair and time frame.
s3.tradingview.com
Setting Number 2: Range Percentage
This setting determines the maximum percentage difference between the high and low of the identified range box. (These settings are interconnected with Setting Number 3, as your choice in Setting Number 3—whether to base the range box calculation on the high or low, or on the candle close—will impact how this range percentage is applied.)
s3.tradingview.com
Setting Number 3: Calculation Basis
This setting determines whether the maximum width of the range box is based on the highest or lowest points, or if it is calculated based on the closing prices of the candles.
s3.tradingview.com
s3.tradingview.com
Setting Number 4: Number of Extended Candles
This visual setting determines the extension of your range box forward by a specified number of candles.
Another valuable feature of this indicator is the ability to configure alerts. By setting up alerts, you can promptly receive notifications whenever a range box is identified on the chart. This ensures that you are promptly informed about potential trading opportunities.
If you have any questions feel free to ask in the comments section.
be profitable :)

BB Opening Range
Master session-based trading with precision range analysis and dynamic extensions
📊 Overview
The BB Opening Range Indicator is a comprehensive session analysis tool that captures, visualizes, and extends price ranges for any defined trading session. Whether you're tracking overnight ranges, opening ranges, or custom session periods, this indicator provides institutional-grade visualization with intelligent range extensions and detailed quadrant analysis.
🎯 Key Features
Dynamic Session Tracking
Define custom session times (default: Midnight 00:00-00:30)
Automatic timezone adjustment for precise session detection
Handles sessions that cross midnight seamlessly
Visual session start/end markers with customizable lines
Intelligent Range Extension
Futures Close (17:00) - Extends ranges until 5:00 PM ET
End of Week - Maintains ranges through Friday close
Always - Continuous extension for persistent levels
Session End Only - Basic range without extension
Advanced Quadrant Analysis
Automatically divides ranges into four equal zones (0-25%, 25-50%, 50-75%, 75-100%)
Color-coded quadrants for instant visual reference
Optional quadrant border lines at 25%, 50%, and 75% levels
Customizable colors and opacity for each quadrant
Historical Range Analytics
Tracks multiple historical ranges (configurable 1-50)
Calculates average range size over customizable lookback period (up to 200 days)
Compares current range to historical average
Maintains clean chart with automatic old range cleanup
Professional Visualization
Clean, institutional-style range boxes with customizable borders
Opening price line overlay
Optional info table showing key levels and statistics
Smart label positioning that follows price action
Predictive next session indicator
📈 Use Cases
Opening Range Breakout Trading
Track the first 30-60 minutes of regular trading hours to identify key support/resistance levels for the day.
Overnight Range Analysis
Monitor overnight/globex sessions to gauge pre-market sentiment and identify potential gaps.
Custom Session Ranges
Define any time period relevant to your strategy - London open, New York open, Asian session, or custom intervals.
Multi-Timeframe Analysis
View how price respects historical session ranges across different timeframes for confluence.
⚙️ Settings Guide
Session Settings
Session Name: Label your session for easy identification
Session Time: Define start and end times (24-hour format)
Extend Until: Choose how long ranges remain visible
Lookback Days: Period for calculating average range size
Max Ranges: Number of historical ranges to display
Display Options
Show Quadrants: Toggle quadrant visualization
Show Info Table: Display statistics table
Table Position: Choose table location on chart
Session Lines: Show/hide session start and next session markers
Open Price Line: Display opening price within range
Label Settings
High/Low Labels: Show range extremes
Quadrant Labels: Display 25%, 50%, 75% levels
Open Price Label: Mark session opening price
Current Range Only: Limit labels to most recent range
Visual Styling
Border Settings: Customize box and quadrant borders
Line Widths: Adjust border and quadrant line thickness
Color Scheme: Full control over all visual elements
VWAP RangeThe VWAP Range indicator is a highly versatile and innovative tool designed with trading signals for trading the supply and demand within consolidation ranges.
What's a VWAP?
A VWAP (Volume Weighted Average Price) represents an equilibrium point in the market, balancing supply and demand over a specified period. Unlike simple moving averages, VWAP gives more weight to periods with higher volume. This is crucial because large volumes indicate significant trading activity, often by institutional traders, whose actions can reflect deeper market insights or create substantial market movements. The VWAP is also often used as a benchmark to evaluate the efficiency of executed trades. If a trader buys below the VWAP and sells above it, they are generally considered to have transacted favourably.
This is how it works:
Multiple VWAP Anchors:
This indicator uses multiple VWAPs anchored to different optional time periods, such as Daily, Weekly, Monthly, as well as to the highest high a lowest low within those periods. This multiplicity allows for a comprehensive view of the market’s average price based on volume and price, tailored to different trading styles and strategies.
Dynamic and Fixed Periods:
Traders can choose between using dynamic ranges, which reset at the start of each selected period, and specifying a date and time for a particular fixed range to trade. This flexibility is crucial for analyzing price movements within specific ranges or market phases.
Fixed ranges allow VWAPs to be calculated and anchored to a significant market event, the beginning of a consolidation phase or after a major news announcement.
Signal Generation:
The indicator generates buy and sell signals based on the relationship of the price to the VWAPs. It also allows for setting a maximum number of signals in one direction to avoid overtrading or pyramiding. Be sure to wait for the candle close before trading on the signals.
Average Buy/Sell Signal Lines:
Lines can be plotted to display the average buy and sell signal prices. The difference between the lines shows the average profit per trade when trading on the signals in that range. It's a good way to see how profitable a range is on average without backtesting the signals. The lines will also often turn into support and resistance areas, similar to value areas in a volume profile.
Customizable Settings:
Traders have control over various settings, such as the VWAP calculation method and bar color. There are also tooltips for every function.
Hidden Feature:
There's a subtle feature in this indicator: if you have 'Indicator values' turned on in TradingView, you'll see a Sell/Buy Ratio displayed only in the status line. This ratio indicates whether there are more sell signals than buy signals in a range, regardless of the Max Signals setting. A red value above 1 suggests that the market is trending upward, indicating you might want to hold your long positions a bit longer. Conversely, a green value below 1 implies a downward trend.

Smart Range Breakout System (Zeiierman)█ Overview
Smart Range Breakout System (Zeiierman) is a full breakout–trend–risk framework engineered around volatility compression, adaptive range detection, and a volatility-adaptive structural mapping layer that continuously reshapes itself as price migrates away from compression zones. Rather than reacting to simple line breaks, the system identifies statistically quiet regimes, models the expansion phase as momentum re-enters the market, and then deploys a unified architecture of trend projection, dynamic trailing stops, and risk–reward structuring that evolves in real time with the unfolding move.
This tool is designed for traders who want a self-contained breakout workflow: first detect valid ranges, then trade the expansion, then manage the trend and exits via automatically generated levels and alerts.
⚪ Why This One Is Unique
The core engine combines a custom price-contraction model with volatility-responsive boundary levels to detect when the market is transitioning between quiet and active phases. From this model, the script generates a smoothed synthetic average that acts as the reference point for identifying compression zones and validating breakout conditions. Using this foundation, the system builds a complete visual trade map: breakout boxes that mark consolidation, breakout markers that signal expansion, a trend cloud that tracks directional bias, adaptive trailing stops that follow price movement, and optional risk-reward levels that automatically adjust to each new breakout.
Unlike conventional breakout indicators that rely on a single high/low lookback, this system uses:
A price contraction engine that re-weights candle structure through a momentum-like transform, generating a stabilized price that better captures compression and release.
An adaptive low-volatility counter that waits for statistically quiet behavior before declaring a range.
█ Main Features
⚪ Breakout Signals With Dynamic Risk-Reward Levels
The system identifies meaningful breakouts emerging from compressed price zones and immediately maps a complete trade structure around each signal.
Each breakout generates:
Directional breakout markers to confirm expansion
Entry, Stop, TP1, and TP2 levels that are automatically projected
A dynamic trailing stop is added to lock in profits as the price moves
Risk and reward zones visualized through adaptive fills
Labels that update in real time as targets are reached or invalidated
This creates a clear, self-contained decision map that helps traders evaluate opportunities, manage risk, and track the progression of each breakout without manual calculations.
⚪ Trend Cloud
A continuously updating Trend Cloud highlights the active directional regime and offers immediate visual trend identification through its color-coded bias. It shows whether a breakout aligns with the prevailing direction, provides a smoother and more stable representation of the trend than raw price alone, and creates an intuitive backdrop for distinguishing trend-following opportunities from countertrend setups. By filtering out noise and emphasizing directional stability, the cloud helps improve timing, signal quality, and overall alignment with the dominant market structure.
█ How to Use
⚪ Breakout Trading from Range Boxes
1. Identify Compression Zones
Look for periods where the Range Breakout Box appears: this signals a statistically quiet regime where price has compressed around a bounded range.
The box top and bottom approximate the upper and lower bounds of the market’s recent equilibrium.
2. Trade the Expansion
Bullish Breakout:
Triggered when the synthetic price crosses above the box top.
A green breakout marker appears below the price (triangle up).
This signals that price is breaking out of the compression zone with enough momentum to establish a meaningful structural move to the upside.
Bearish Breakout:
Triggered when the price crosses below the box bottom.
A red breakout marker appears above the price (triangle down).
Signals a breakdown out of the range to the downside.
⚪ Trend Following with the Trend Cloud
The Trend Cloud is a volatility-responsive band that adjusts to the system’s internal trend. In bullish conditions, it shifts to the up-color beneath price, and in bearish conditions, it flips to the down-color above price, giving a clear visual read of market direction.
The cloud effectively separates impulsive trend legs from noise, so you can align breakout trades only with the dominant directional regime.
Long Setups
Favor long setups (Break Up) when the price is traveling above or inside a bullish cloud.
Short Steups
Favor short setups (Break Down) when the price is below or inside a bearish cloud.
Ignore counter-trend breakouts that form directly against a strong, stable cloud unless you are intentionally trading mean reversion.
⚪ Breakout Management and Risk-Reward
Once a breakout occurs, the system instantly activates a directional trailing stop that follows the trend. For long setups, the stop stays below the price and moves upward as momentum builds. For short setups, it stays above the price and moves downward as the trend strengthens. If price hits the trailing stop, an X-cross appears on the chart to mark the exit, and the stop is reset for the next signal. You can adjust the sensitivity to make the stop tighter or more relaxed, depending on your preference.
When Risk-Reward Levels are enabled, the script also builds a complete trade structure around the breakout. It places an entry line at the breakout close, and projects two target levels forward. The area between entry and stop is shaded as risk, while the area toward the targets is shaded as reward. Labels update automatically as targets are reached, turning into a clear confirmation mark when a level is hit and signaling with an icon if the stop is touched.
Together, the trailing stop and risk-reward ladder create a clear, real-time map of each breakout’s progression, helping you manage risk, monitor targets, and follow the move with structure and confidence.
█ How It Works
⚪ Compression Detection & Range Formation
The system identifies quiet market phases where price contracts into narrow zones and stabilizes around a synthetic equilibrium level. These zones form the foundation for valid breakout opportunities.
Calculation: Persistence-based boundary tracking with volatility-normalized change detection and equilibrium anchoring to identify statistically constrained price regimes.
⚪ Breakout Engine
Breakouts occur only when the internal average breaks out of a validated compression zone, confirming that the market is transitioning from containment to expansion.
Calculation: Boundary-crossing logic on dispersion-expanded structures with directional state shifts encoded through threshold-gated transitions.
⚪ Trend State
A dynamic trend state guides directional bias, while the Trend Cloud visually expresses this bias directly on the chart, shifting beneath or above the price depending on the active regime.
Calculation: Dual-regime state modeling using filtered directional vectors, volatility-responsive offsets, and continuity enforcement to avoid noise-driven flips.
-----------------
Disclaimer
The content provided in my scripts, indicators, ideas, algorithms, and systems is for educational and informational purposes only. It does not constitute financial advice, investment recommendations, or a solicitation to buy or sell any financial instruments. I will not accept liability for any loss or damage, including without limitation any loss of profit, which may arise directly or indirectly from the use of or reliance on such information.
All investments involve risk, and the past performance of a security, industry, sector, market, financial product, trading strategy, backtest, or individual's trading does not guarantee future results or returns. Investors are fully responsible for any investment decisions they make. Such decisions should be based solely on an evaluation of their financial circumstances, investment objectives, risk tolerance, and liquidity needs.

Advanced Range Analyzer ProAdvanced Range Analyzer Pro – Adaptive Range Detection & Breakout Forecasting
Overview
Advanced Range Analyzer Pro is a comprehensive trading tool designed to help traders identify consolidations, evaluate their strength, and forecast potential breakout direction. By combining volatility-adjusted thresholds, volume distribution analysis, and historical breakout behavior, the indicator builds an adaptive framework for navigating sideways price action. Instead of treating ranges as noise, this system transforms them into opportunities for mean reversion or breakout trading.
How It Works
The indicator continuously scans price action to identify active range environments. Ranges are defined by volatility compression, repeated boundary interactions, and clustering of volume near equilibrium. Once detected, the indicator assigns a strength score (0–100), which quantifies how well-defined and compressed the consolidation is.
Breakout probabilities are then calculated by factoring in:
Relative time spent near the upper vs. lower range boundaries
Historical breakout tendencies for similar structures
Volume distribution inside the range
Momentum alignment using auxiliary filters (RSI/MACD)
This creates a live probability forecast that updates as price evolves. The tool also supports range memory, allowing traders to analyze the last completed range after a breakout has occurred. A dynamic strength meter is displayed directly above each consolidation range, providing real-time insight into range compression and breakout potential.
Signals and Breakouts
Advanced Range Analyzer Pro includes a structured set of visual tools to highlight actionable conditions:
Range Zones – Gradient-filled boxes highlight active consolidations.
Strength Meter – A live score displayed in the dashboard quantifies compression.
Breakout Labels – Probability percentages show bias toward bullish or bearish continuation.
Breakout Highlights – When a breakout occurs, the range is marked with directional confirmation.
Dashboard Table – Displays current status, strength, live/last range mode, and probabilities.
These elements update in real time, ensuring that traders always see the current state of consolidation and breakout risk.
Interpretation
Range Strength : High scores (70–100) indicate strong consolidations likely to resolve explosively, while low scores suggest weak or choppy ranges prone to false signals.
Breakout Probability : Directional bias greater than 60% suggests meaningful breakout pressure. Equal probabilities indicate balanced compression, favoring mean-reversion strategies.
Market Context : Ranges aligned with higher timeframe trends often resolve in the dominant direction, while counter-trend ranges may lead to reversals or liquidity sweeps.
Volatility Insight : Tight ranges with low ATR imply imminent expansion; wide ranges signal extended consolidation or distribution phases.
Strategy Integration
Advanced Range Analyzer Pro can be applied across multiple trading styles:
Breakout Trading : Enter on probability shifts above 60% with confirmation of volume or momentum.
Mean Reversion : Trade inside ranges with high strength scores by fading boundaries and targeting equilibrium.
Trend Continuation : Focus on ranges that form mid-trend, anticipating continuation after consolidation.
Liquidity Sweeps : Use failed breakouts at boundaries to capture reversals.
Multi-Timeframe : Apply on higher timeframes to frame market context, then execute on lower timeframes.
Advanced Techniques
Combine with volume profiles to identify areas of institutional positioning within ranges.
Track sequences of strong consolidations for trend development or exhaustion signals.
Use breakout probability shifts in conjunction with order flow or momentum indicators to refine entries.
Monitor expanding/contracting range widths to anticipate volatility cycles.
Custom parameters allow fine-tuning sensitivity for different assets (crypto, forex, equities) and trading styles (scalping, intraday, swing).
Inputs and Customization
Range Detection Sensitivity : Controls how strictly ranges are defined.
Strength Score Settings : Adjust weighting of compression, volume, and breakout memory.
Probability Forecasting : Enable/disable directional bias and thresholds.
Gradient & Fill Options : Customize range visualization colors and opacity.
Dashboard Display : Toggle live vs last range, info table size, and position.
Breakout Highlighting : Choose border/zone emphasis on breakout events.
Why Use Advanced Range Analyzer Pro
This indicator provides a data-driven approach to trading consolidation phases, one of the most common yet underutilized market states. By quantifying range strength, mapping probability forecasts, and visually presenting risk zones, it transforms uncertainty into clarity.
Whether you’re trading breakouts, fading ranges, or mapping higher timeframe context, Advanced Range Analyzer Pro delivers a structured, adaptive framework that integrates seamlessly into multiple strategies.

Recent Range DetectorOverview
The Recent Range Detector is a specialized indicator designed to identify when an asset is currently range-bound, providing traders with clear support and resistance levels for range trading strategies. Unlike traditional indicators that focus on trend detection, this tool specifically answers the question: "Is the price range-bound right now, and what are the exact trading levels?"
Key Features
✅ Smart Range Detection - Uses a multi-factor scoring system to identify legitimate ranges
✅ Dynamic Support/Resistance Levels - Automatically calculates and displays key trading levels
✅ Range Quality Scoring - Provides confidence levels (Strong/Moderate/Weak Range)
✅ Touch Validation - Counts actual price touches to confirm range reliability
✅ Breakout Detection - Alerts when price exits the established range
✅ Visual Clarity - Clean boxes, lines, and labels for easy interpretation
How It Works
The indicator analyses recent price action using three core metrics:
Touch Quality (40%) - How many times price has respected support/resistance levels
Containment Quality (40%) - What percentage of recent bars stayed within the range
Recent Respect (20%) - Whether the latest price action confirms the range
These combine into a Range Score (0-1) that determines range strength and reliability.
Settings & Parameters
Range Lookback Period (Default: 15)
Number of bars to analyse for range detection
Shorter periods = more responsive to recent ranges
Longer periods = more stable, fewer false signals
Range Tolerance (Default: 2.0%)
Tolerance for price touches around exact highs/lows
Lower values = stricter range requirements
Higher values = more flexible range detection
Minimum Touches (Default: 3)
Required number of support/resistance touches for valid range
Higher values = more confirmed ranges, fewer signals
Lower values = more sensitive, earlier detection
Visual Options
Show Range Box: Displays the range boundaries
Show Support/Resistance Lines: Extends levels into the future
Understanding the Output
Range Score (0.000 - 1.000)
0.7+ = Strong Range (Green) - High confidence range trading setup
0.5-0.7 = Moderate Range (Yellow) - Decent range with some caution
0.3-0.5 = Weak Range (Orange) - Low confidence, be careful
<0.3 = Not Ranging - Avoid range trading strategies
Range Status Classifications
Strong Range - Perfect for range trading strategies
Moderate Range - Good range with normal risk
Weak Range - Marginal range, use smaller positions
Not Ranging - Price is trending or too choppy for range trading
Key Metrics in Info Table
Range Size (%) - Size of the range relative to price level
5-15% = Ideal range size for most strategies
<5% = Tight range, lower profit potential
>15% = Wide range, higher profit potential but more risk
Support/Resistance Levels - Exact price levels for entries/exits
Use these as your key trading levels
Support = potential buy zone
Resistance = potential sell zone
Total Touches - Number of times price respected the levels
3-5 touches = Newly formed range
6-10 touches = Well-established range
10+ touches = Very strong, reliable range
Price Position (%) - Current location within the range
0-20% = Near support (potential long opportunity)
80-100% = Near resistance (potential short opportunity)
40-60% = Middle of range (wait for better entry)
Visual Elements
Range Box
Green Box = Strong Range (Score ≥ 0.7)
Yellow Box = Moderate Range (Score 0.5-0.7)
Orange Box = Weak Range (Score 0.3-0.5)
Support/Resistance Lines
- Horizontal lines showing exact trading levels
- Extend into the future for forward guidance
- Colour matches the range strength
Background Colouring
- Subtle background tint during range periods
- Helps quickly identify ranging vs trending markets
Breakout Signals
- 📈 RANGE BREAK UP - Price breaks above resistance
- 📉 RANGE BREAK DOWN - Price breaks below support
- Only appears for confirmed ranges (Score ≥ 0.5)
Trading Applications
Range Trading Strategy
1. Look for Range Score ≥ 0.5
2. Buy near support (Price Position 0-20%)
3. Sell near resistance (Price Position 80-100%)
4. Set stops just outside the range
5. Exit on breakout signals
Breakout Strategy
1. Identify strong ranges (Score ≥ 0.7)
2. Wait for volume-confirmed breakout
3. Enter in breakout direction
4. Use previous resistance as support (or vice versa)
Market Context
- Strong ranges often occur after trending moves
- Use higher timeframes to confirm overall market structure
- Combine with volume analysis for better entries/exits
Best Practices
What to Look For
✅ Range Score ≥ 0.5 for trading consideration
✅ Multiple touches (5+) for confirmation
✅ Clear price rejection at levels
✅ Reasonable range size (5-15% for most assets)
✅ Recent price respect of boundaries
What to Avoid
❌ Trading ranges with Score < 0.3
❌ Very tight ranges (<3% size) - low profit potential
❌ Ranges with only 1-2 touches - not confirmed
❌ Ignoring breakout signals
❌ Trading against the higher timeframe trend
Alerts Available
- Range Detected - New range formation
- Range Break Up - Upward breakout
- Range Break Down - Downward breakout
- Range Ended - Range condition ended
Timeframe Recommendations
- Daily Charts - Best for swing trading ranges
- 4H Charts - Good for intermediate-term ranges
- 1H Charts - Suitable for day trading ranges
- Lower Timeframes - May produce more noise
Conclusion
The Recent Range Detector eliminates guesswork in range identification by providing objective, quantified range analysis. It's particularly valuable for traders who prefer range-bound strategies or need to identify when trending strategies should be avoided.
Remember: No indicator is perfect. Always combine with proper risk management, volume analysis, and broader market context for best results.
Disclaimer
This indicator is for educational purposes only and should not be considered as financial advice. Trading involves risk, and past performance does not guarantee future results. Always conduct your own research and consider your risk tolerance before making any trading decisions.

Range Bar Gaps DetectorRange Bar Gaps Detector
Overview
The Range Bar Gaps Detector identifies price gaps across multiple range bar sizes (12, 24, 60, and 120) on any trading instrument, helping traders spot potential support/resistance zones or breakout opportunities. Designed for Pine Script v6, this indicator detects gaps on range bars and exports data for use in companion scripts like Range Bar Gaps Overlap, making it ideal for multi-timeframe gap analysis.
Key Features
Multi-Range Gap Detection: Identifies gaps on 12, 24, 60, and 120-range bars, capturing both bullish (gap up) and bearish (gap down) price movements.
Customizable Sensitivity: Includes a user-defined minimum deviation (default: 10% of 14-period SMA) for 12-range gaps to filter out noise.
7-Day Lookback: Automatically prunes gaps older than 7 days to focus on recent, relevant price levels.
Data Export: Serializes up to 10 gaps per range (tops, bottoms, start bars, highest/lowest prices, and age) for seamless integration with overlap analysis scripts.
Debugging Support: Plots gap counts and aggregation data in the Data Window for easy verification of detected gaps.
How It Works
The indicator aggregates price movements to simulate higher range bars (24, 60, 120) from a base range bar chart. It detects gaps when the price jumps significantly between bars, ensuring gaps meet the minimum deviation threshold for 12-range bars. Gaps are stored in arrays, serialized for external use, and pruned after 7 days to maintain efficiency.
Usage
Add to your range bar chart (e.g., 12-range) to detect gaps across multiple ranges.
Use alongside the Range Bar Gaps Overlap indicator to visualize gaps and their overlaps as boxes on the chart.
Check the Data Window to confirm gap counts and sizes for each range (12, 24, 60, 120).
Adjust the "Minimal Deviation (%) for 12-Range" input to control gap detection sensitivity.
Settings
Minimal Deviation (%) for 12-Range: Set the minimum gap size for 12-range bars (default: 10% of 14-period SMA).
Range Sizes: Fixed at 24, 60, and 120 for higher range bar aggregation.
Notes
Ensure the script is published under your TradingView username (e.g., GreenArrow2005) for use with companion scripts.
Best used on range bar charts to maintain consistent gap detection.
For advanced overlap analysis, pair with the Range Bar Gaps Overlap indicator to highlight zones where gaps from different ranges align.
Ideal For
Traders seeking to identify key price levels for support/resistance or breakout strategies.
Multi-timeframe analysts combining gap data across various range bar sizes.
Developers building custom indicators that leverage gap data for advanced charting.

Session RangeThis Pine Script™ code is subject to the terms of the Mozilla Public License 2.0 at mozilla.org
This script plots the high and low price ranges for up to four customizable trading sessions directly on your chart. It is designed to help traders visualize price activity during specific trading hours.
Features
Customizable Sessions: Define up to four distinct trading sessions using the input.session parameter.
Visual Highlights: Each session range is highlighted with customizable colors for top and bottom lines as well as a fill between them.
Historical Ranges: Option to show historical session ranges with adjustable opacity.
Toggle Sessions: Enable or disable the display of specific trading sessions to tailor your analysis.
Overlay on Chart: The script works as an overlay, ensuring your analysis stays on the main chart.
How It Works:
Session Setup: Input the start and end times for each session in the Session 1, Session 2, Session 3, and Session 4 fields.
Dynamic Range Calculation: The script automatically calculates the high and low during active sessions, updating the range as new data comes in.
Customizable Colors: Adjust the colors for lines, fills, and historical ranges to match your charting style.
Clean Presentation: The script is designed to avoid clutter by limiting overlays to active and relevant sessions only.
Identify price action trends during key trading hours.
Compare ranges between multiple sessions for market behavior analysis.
Highlight significant session overlaps or range extensions.
Disclaimer :
This script is intended for educational purposes and should not be considered financial advice. Trading involves risks, and past performance does not guarantee future results.

Viper Futures Range Bar CandlesThe Range Bars used in more Professional trading platforms to keep smoothness on the charts and help make custom range price candles based on the range size chosen for the market being traded. Example an 8 Range bar on the ES or MES Futures is 8 ticks = 2 points. Another Example on NQ a 22 Range bar popularly traded by trading professionals is a total of 22 ticks = 5 1/2 points on the Nasdaq or Micro NQ futures. Simple add to charge, set the range bar setting with a particular range setting in mind and then for clarity uncheck the original price chart on top left corner, same way you would disable an indicator temporarily. Works very clear and nice. A good accommodation for trading View as trading view does not offer historical tick data to use Renko bars very well at the moment.
Basically plots a candle rather then a OHLC bar for Range Bars on TV!
Default color was set to my Viper Futures Chart, you can change back to green/red, etc.
Enjoy!
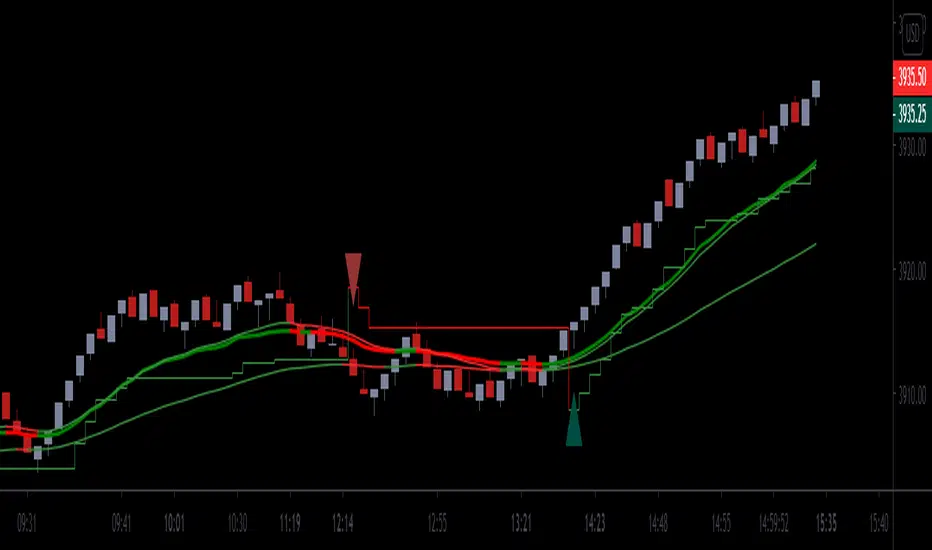
Quantum Range Filter by MRKcoin### Quantum Range Filter by MRKcoin
**Overview**
This indicator is a sophisticated range detection tool designed based on the principles of quantitative multi-factor models. Instead of relying on a single condition, it assesses the market from three different dimensions to provide a more robust and reliable identification of range-bound (sideways) markets.
When the background is highlighted in red, it indicates that the market is likely in a range phase, suggesting that trend-following strategies may be less effective, and mean-reversion (range trading) strategies could be more suitable.
---
**Core Logic: A Multi-Factor Approach**
The filter evaluates the market state using the following three independent factors:
1. **Momentum Volatility (RSI Bollinger Bandwidth):**
* **Question:** Is the momentum of the market contracting?
* **Method:** It measures the width of the Bollinger Bands applied to the RSI. A narrow bandwidth suggests that momentum is consolidating, which is a common characteristic of a range market.
2. **Price Volatility (ATR Ratio):**
* **Question:** Is the actual price movement shrinking?
* **Method:** It calculates the Average True Range (ATR) as a percentage of the closing price. A low ratio indicates that the price volatility itself is low, reinforcing the case for a range environment.
3. **Absence of Trend (ADX):**
* **Question:** Is there a lack of a clear directional trend?
* **Method:** It uses the Average Directional Index (ADX), a standard tool for measuring trend strength. A low ADX value provides active confirmation that the market is not in a trending phase.
---
**How to Use**
1. **Range Detection:** The primary use is to identify ranging markets. The red highlighted background serves as a visual cue.
2. **Strategy Selection:**
* **Inside the Red Zone:** Consider using range-trading strategies (e.g., buying at support, selling at resistance, using oscillators like RSI or Stochastics for overbought/oversold signals). Avoid using trend-following indicators like moving average crossovers, as they are prone to generating false signals in these conditions.
* **Outside the Red Zone:** The market is likely trending. Trend-following strategies are more appropriate.
3. **Parameter Tuning (In Settings):**
* **This is the key to adapting the filter to any market or timeframe.** Different assets (like BTC vs. ETH) and different timeframes have unique volatility characteristics. Don't hesitate to adjust the parameters to fit the specific chart you are analyzing.
* **Range Detection Score:** This is the most important setting. It determines how many of the three factors must agree to classify the market as a range. The default is `2`, which provides a good balance.
* If the filter seems **too sensitive** (highlighting too often), increase the score to `3`.
* If the filter seems **not sensitive enough** (missing obvious ranges), decrease the score to `1`.
* **Factor Thresholds:** For fine-tuning, adjust the thresholds for each factor.
* **`RSI BB Width Threshold`:** If you want to detect even tighter momentum consolidations, *decrease* this value.
* **`ATR Ratio Threshold`:** If you want to be stricter about price volatility, *decrease* this value.
* **`ADX Threshold`:** To be more lenient on what constitutes a "trendless" market, *increase* this value (e.g., to 30). To be stricter, *decrease* it (e.g., to 20).
* **Pro Tip:** Use the Debug Table (uncomment it in the script's code) to see the live values of each factor. This will give you a clear idea of how to set the thresholds for the specific asset you are trading.
**Disclaimer**
This indicator is a tool to assist in market analysis and should not be used as a standalone signal for making financial decisions. Always use it in conjunction with your own trading strategy, risk management, and analysis. Past performance is not indicative of future results.
**Credits**
* **Concept & Vision:** MRKcoin
