The Silver Lining – GSR🍯 This tool converts the Gold/Silver Ratio (GSR) into a precision timing lens for short-term traders operating inside digital silver markets. It reveals structural dominance, trend exhaustion, and regime inflection by comparing the GSR to its smoothed baseline and historical percentile rhythm. On high timeframes (1D+), it reflects macroeconomic sentiment shifts 📈.
🧐 The lower the timeframe, the higher the alpha; the 15m and 1h charts are where you will the hidden pots of gold. For LTF traders, it becomes a hyper-responsive bias filter — especially when paired with volatility-based confirmation systems like SUPeR TReND 2.718, as shown.
🧠 The core logic compares the GSR (gold ÷ silver) against a user-defined moving average (VWMA or EMA). A color-coded fill shifts based on direction: amber when gold leads, teal when silver gains strength. Percentile bands (20th, 50th, 80th) map structural zones — helping traders anchor trades based on confluence, not hype.
📊 In the example chart, four theoretical long trades are shown on the 1h chart, manually drawn on the 15m timeframe. Each begins when the GSR reverses from the 80th percentile or breaks below its MA. The trades occur precisely as silver tested support, with confirmation from SUPeR TReND’s trend shift. Although idealized, these aren’t guesses — they are compression-to-expansion sequences backed by macro relative strength flow. Several yielded gains exceeding 4%.
🏆 Best-case long trades occur when GSR rotates down through the 50th percentile and silver catches a reactive bid. Shorts appear when GSR rises through the upper percentile band while silver fails to hold key intraday levels. The percentile bands function like behavioral tiers:
🥈 Below 20th = Silver Dominance
⚠️ Around 50th = Crossover Area
🥇 Above 80th = Gold Dominance
🥈 Why silver? It’s faster, more emotional, and more manipulated than gold — which paradoxically makes it more tradable on low timeframes. Its range-bound nature is ideal for rinse-and-repeat systems. Because we trade the derivative (XAGUSD), there’s no friction or delivery constraint — just price action, clean and liquid.
⚖️ The underlying strategy isn’t just technical; it’s alchemical. The system begins with short-term trading in digital silver and funnels gains into physical gold — converting volatility into wealth. Over time, this establishes a perpetual motion model: when profits allow, trade silver, extract value, cash out and convert into gold. The account stays active, and the hedge keeps growing.
🔁 The Silver Lining isn’t a signal engine. It’s a structural overlay. It tells you when the market’s invisible bias is shifting — so your tactics stay aligned with macro rhythm.
🌊 Silver moves fast. Gold moves first. The Silver Lining helps you bridge that gap — with clarity, confluence, and edge.
Cerca negli script per "relative strength"
Relative Directional Index (RDI)🔍 Overview
The Relative Directional Index (RDI) is a hybrid tool that fuses the Average Directional and the Relative Strength Indices (ADX and RSI) into a single, highly visual interface. While the former captures trend strength, the latter reveals momentum shifts and potential exhaustion. Together, they can confirm trend structure, anticipate reversals, and sharpen the timing entries and exits.
📌 Why Combine ADX with RSI?
Most indicators focus on either trend-following (like ADX) or momentum detection (like RSI)—but rarely both. Each comes with trade-offs:
- ADX alone confirms trend strength but ignores momentum.
- RSI alone signals overbought/oversold, but lacks trend context.
The RDI resolves this by integrating both, offering:
- Smarter filters for trend entries
- Early warnings of momentum breakdowns
- More confident signal validation
🧠 Design Note: Fibonacci Harmony
All default values—5, 13, 21—are Fibonacci numbers. This is intentional, as these values reflect the natural rhythm of market cycles, and promote harmonic calibration between price action and indicator logic.
🔥 Key Features
✅ ADX Histogram
- Green bars = trend gaining strength
- Red bars = trend weakening
- Adjustable transparency for visual tuning
✅ ADX Line (Orange)
- Measures trend strength over time
- Rising = accelerating trend
- Falling = trend may be fading
✅ RSI Line (Lemon Yellow)
- Captures momentum surges and slowdowns
- Above 50 = bullish control
- Below 50 = bearish pressure
✅ Trend Strength Squares
- Bright green = strong uptrend
- Bright red = strong downtrend
- Faded colors = range-bound or indecisive
✅ ADX/RSI Crossover Markers
- Yellow square = RSI crosses above ADX → momentum building
- Orange square = ADX crosses above RSI → trend still dominant
✅ Customizable Reference Lines
- Yellow (50) = strong trend threshold
- Red (30) = weak trend zone
- Green (70) = overextended, potential exhaustion
_______________________________________________________
🎯 How to Trade with the RDI
The RDI helps traders identify momentum-supported trends, catch early reversals, and avoid false signals during consolidation.
✅ Trend Confirmation Entries
🔼 Bullish → Enter long on pullbacks or resistance breakouts
- ADX rising above 30
- RSI above 50
- Green trend square visible
🔽 Bearish → Enter short on breakdowns or failed retests
- ADX rising
- RSI below 50
- Red trend square visible
🧯 Exit if RSI crosses back against trend direction or ADX flattens
🚨 Reversal Setups Using Divergence
📈 Bullish Divergence → Long entry after confirmation (e.g. engulfing bar, volume spike)
- Price prints lower low
- RSI prints higher low
- Green triangle
📉 Bearish Divergence → Short entry on breakdown
- Price prints higher high
- RSI prints lower high
- Red triangle
Tip: Stronger if ADX is declining (fading trend strength)
🔂 Breakout Detection via Cross Markers
- Yellow square = RSI > ADX → breakout brewing
- Orange square = ADX > RSI → trend continuation likely
⏸️ Avoid Choppy Markets
- RSI between 45–55
- Faded trend squares
- Flat ADX below 20–30
🧠 Pro Tips
- Combine RDI with VWAPs, moving averages and/or pitchforks
- Watch for alignment between trend and momentum
- Use divergence markers as confirmation, not stand-alone triggers
_______________________________________________________
⚠️ Hidden Divergence (Optional)
The RDI includes optional hidden divergence detection. These signals suggest trend continuation but are off by default. Use with discretion—best in established trends, not sideways markets.
🙈 Hidden Bullish
- Price prints higher low
- RSI prints lower low
🙈 Hidden Bearish
- Price prints lower high
- RSI prints higher high

RSI-Colored Price Candles with BackgroundThis Pine Script indicator visually enhances price candles based on **RSI (Relative Strength Index)** behavior, helping traders quickly assess momentum directly on the price chart.
**RSI Calculation:**
The RSI is computed using a traditional 14-period lookback. It uses `ta.rma()` to smooth average gains and losses, and then transforms the result into an RSI value between 0 and 100. This value is used to determine both **candle color** and optional **background shading**.
**Candle Coloring:**
Each price candle is recolored based on the current RSI value:
- If RSI is **greater than or equal to 50**, the candle is **bright green**, indicating bullish momentum.
- If RSI is **less than 50**, the candle is **bright red**, indicating bearish momentum.
The actual OHLC values of the candles remain unchanged. Only their color is modified to reflect RSI strength.
**Optional Background Highlighting:**
A user setting called `Show Overbought/Oversold Background` lets traders toggle background shading on or off. When enabled:
- If RSI is **above 70**, a soft **green** background appears, signaling overbought conditions.
- If RSI is **below 30**, a soft **red** background appears, signaling oversold conditions.
This provides an intuitive visual cue that highlights potential reversal or exhaustion zones based on RSI extremes.
**Custom Settings:**
- The RSI length and source are customizable.
- Background highlighting is turned **off by default**, giving users a clean chart unless they choose to enable it.
**Purpose and Use:**
This script is designed for traders who want to visually integrate RSI momentum directly into their chart candles, reducing the need to look away from price action. It's clean, responsive, and adjustable — perfect for intraday or swing traders who value simplicity backed by momentum data.
Multi-Indicator Trading DashboardMulti-Indicator Trading Dashboard: Comprehensive Analysis and Actionable Signals
This Pine Script indicator, "Multi-Indicator Trading Dashboard," provides a comprehensive overview of key market indicators and generates actionable trading signals, all presented in a clear, easy-to-read table format on your TradingView chart.
Key Features:
Real-time Indicator Analysis: The dashboard displays real-time values and signals for:
RSI (Relative Strength Index): Tracks overbought and oversold conditions.
MACD (Moving Average Convergence Divergence): Identifies trend changes and momentum.
ADX (Average Directional Index): Measures trend strength.
Volatility (ATR-based): Estimates volatility as a percentage, acting as a VIX proxy for single-symbol charts.
Trend Determination: Analyzes 20, 50, and 200-period EMAs to provide a clear trend assessment (Strong Bullish, Cautious Bullish, Cautious Bearish, Strong Bearish).
Combined Trading Signals: Integrates signals from RSI, MACD, ADX, and trend analysis to generate a combined "Buy," "Sell," or "Neutral" action signal.
User-Friendly Table Display: Presents all information in a neatly organized table, positioned at the top-right of your chart.
Visual Chart Overlays: Plots 20, 50, and 200-period EMAs directly on the chart for visual trend confirmation.
Background Color Alerts: Colors the chart's background based on the "Buy" or "Sell" action signal for quick visual cues.
Customizable Inputs: Allows you to adjust key parameters like RSI lengths, MACD settings, ADX thresholds, and EMA periods.
How It Works:
Indicator Calculations: The script calculates RSI, MACD, ADX, and a volatility proxy (ATR) using standard Pine Script functions.
Trend Analysis: It compares 20, 50, and 200-period EMAs to determine the overall trend direction.
Individual Signal Generation: It generates individual "Buy," "Sell," or "Neutral" signals based on RSI, MACD, and ADX values.
Combined Signal Logic: It combines the individual signals and trend analysis, assigning a "Buy" or "Sell" action only when at least two indicators align.
Table Display: It creates a table and populates it with the calculated values, signals, and trend information.
Chart Overlays: It plots the EMAs on the chart and colors the background based on the combined action signal.
Use Cases:
Quick Market Overview: Get a snapshot of key market indicators and trend direction at a glance.
Confirmation Tool: Use the combined signals to confirm your existing trading strategies.
Educational Purpose: Learn how different indicators interact and influence trading decisions.
Automated Alerting: Set up alerts based on the "Buy" or "Sell" action signals.
Customization:
Adjust the input parameters to fine-tune the indicator's sensitivity to your trading style and the specific market you're analyzing.
Disclaimer:
This indicator is for informational and educational purposes only and should not be considered financial advice. Always conduct thorough research and consult with 1 a qualified professional before making any 2 trading decisions.

Power Balance Bull&Bear - CoffeeKillerPower Balance Bull&Bear - CoffeeKiller Indicator Guide
Welcome traders! This guide will walk you through the Power Balance Bull&Bear indicator, a unique and powerful market analysis tool developed by CoffeeKiller that visualizes the ongoing battle between buyers and sellers in any market.
Core Concept: Buyers vs. Sellers
The foundation of this indicator rests on a simple yet profound concept: every price movement in the market represents a battle between buyers and sellers.
Positive Green Line: Buyer Power
- Represents cumulative buying pressure in the market
- Tracks positive directional movement over a specified period
- Rising positive line indicates increasing buying momentum
- Peaks in the positive line show moments of maximum buyer dominance
Negative Red Line: Seller Power
- Represents cumulative selling pressure in the market
- Tracks negative directional movement over a specified period
- Falling negative line indicates increasing selling momentum
- Troughs in the negative line show moments of maximum seller dominance
Master Line: Market Balance
- Calculated as the difference between positive and negative movements
- Above zero: buyers are in control
- Below zero: sellers are in control
- Peaks and troughs: moments of extreme buyer or seller dominance
Core Components
1. Directional Movement Analysis
- Cumulative measurement of price changes in both directions
- Normalization for consistent visualization
- Optional smoothing for clearer signals
- Custom box size for sensitivity control
2. Distance Measurement
- Calculation of separation between buyer and seller lines
- Convergence and divergence thresholds
- Dynamic fill coloring based on distance trends
- Distance trend visualization
3. Peak Detection System
- Identification of local maxima and minima in buyer/seller dominance
- Background highlighting of significant peaks
- Zero-line cross detection for trend changes
- Visual cues for market extremes
4. Trend Analysis
- Buyer/seller line crossovers for major trend signals
- Distance trending for momentum confirmation
- Status monitoring (Near, Far, Normal)
- Direction tracking for both buyer and seller lines
Main Features
Time Resolution Settings
- Normal mode: calculations based on chart timeframe
- Custom resolution mode: calculations based on specified timeframe
- Multi-timeframe analysis capabilities
- Flexible time projection options
Visual Elements
- Color-coded buyer and seller lines
- Dynamic fill coloring based on convergence/divergence
- Background highlighting for significant peaks
- Distance line with threshold markers
Signal Generation
- Buyer/seller crossover alerts
- Convergence/divergence notifications
- Peak detection signals
- Status change alerts
Analysis Table(I personally don't use the table it was coded to take longer signals to show strength or weakness in overall trend)
- Current distance measurement
- Distance trend indication
- Status monitoring (Near, Far, Normal)
- Buyer and seller line trend tracking
Trading Applications
1. Trend Identification
- Buyer line crossing above seller line: bullish trend beginning
- Seller line crossing above buyer line: bearish trend beginning
- Distance between lines: trend strength
- Distance trending: momentum confirmation
2. Reversal Detection
- Peak formation after extended trend: potential exhaustion
- Buyer/seller line convergence: decreasing trend strength
- Distance falling below convergence threshold: potential trend change
- Background highlighting: visual cue for significant peaks
3. Momentum Analysis
- Increasing distance: accelerating trend
- Decreasing distance: decelerating trend
- Distance above divergence threshold: strong momentum
- Distance below convergence threshold: weak momentum
4. Market Balance Assessment
- Buyer line trend: indicates strength/weakness of bulls
- Seller line trend: indicates strength/weakness of bears
- Master line position relative to zero: overall market bias
- Distance between lines: consensus or disagreement in the market
Optimization Guide
1. Period Settings
- Longer period: smoother signals, less noise, fewer false signals
- Shorter period: more responsive, captures minor moves, potentially more noise
- Default (20): balanced approach for most timeframes
2. Box Size Parameter
- Smaller box size: more sensitive to price changes
- Larger box size: less sensitive, focuses on major moves
- Default (0.001): calibrated for typical price ranges
3. Distance Thresholds
- Convergence threshold: determines when lines are considered "near"
- Divergence threshold: determines when lines are considered "far"
- Adjusting these based on volatility of the instrument
4. Color Customization
- Positive Green line: representing buyer strength
- Negative Red line: representing seller strength
- Diverging fill: when the gap between buyers and sellers is increasing
- Converging fill: when buyers and sellers are moving closer together
Best Practices
1. Signal Confirmation
- Wait for buyer/seller crossovers to confirm
- Look for background highlighting at peaks
- Check distance trends for momentum confirmation
- Use the analysis table for additional context
2. Timeframe Selection
- Lower timeframes: more signals, potential noise
- Higher timeframes: cleaner signals, less frequent
- Custom resolution: allows comparison across timeframes
- Consider using multiple timeframes for confirmation
3. Market Context
- Strong buyer line rising + weak seller line: very bullish
- Strong seller line falling + weak buyer line: very bearish
- Both lines rising: volatile uptrend
- Both lines falling: volatile downtrend
4. Combining with Other Indicators
- Use with trend indicators for confirmation
- Pair with oscillators for overbought/oversold conditions
- Combine with volume analysis for validation
- Consider support/resistance levels when peaks form
Advanced Trading Strategies
1. Buyer/Seller Balance Strategy
- Enter long when buyer line crosses above seller line
- Enter short when seller line crosses above buyer line
- Use distance trend for filtering quality of signals
- Exit when distance falls below convergence threshold
2. Peak Trading Strategy
- Identify significant peaks with background highlighting
- Look for consecutive lower peaks in buyer line for shorting opportunities
- Look for consecutive higher troughs in seller line for buying opportunities
- Use master line crosses through zero as confirmation
3. Convergence/Divergence Strategy
- Enter positions when distance exceeds divergence threshold (strong trend)
- Take partial profits when distance starts decreasing
- Exit fully when distance falls below convergence threshold
- Re-enter when a new trend forms with increasing distance
4. Line Trend Combination Strategy
- Strongest bullish signal: Rising buyer line + falling seller line + increasing distance
- Strongest bearish signal: Falling buyer line + rising seller line + increasing distance
- Potential reversal signal: Decreasing distance + peak formation + line trend change
- Continuation signal: Consistent buyer/seller dominance + increasing distance after consolidation
Practical Analysis Examples
Bullish Market Scenario
- Buyer line trends upward as buying pressure increases
- Seller line remains flat or trends downward as selling pressure decreases
- Distance between lines expands, showing divergence (strong trend)
- Positive background highlights appear at new peaks in buyer dominance
- Master line moves further above zero
Bearish Market Scenario
- Seller line trends downward as selling pressure increases
- Buyer line remains flat or trends downward as buying pressure decreases
- Distance between lines expands, showing divergence (strong trend)
- Negative background highlights appear at new troughs in seller dominance
- Master line moves further below zero
Consolidation Scenario
- Buyer and seller lines move sideways
- Distance between lines narrows, showing convergence
- Few or no new peak highlights appear
- Master line oscillates close to the zero line
- Analysis table shows "Stable" trends for both buyer and seller lines
Understanding Market Dynamics Through Power Balance
At its core, this indicator provides a unique lens to visualize the ongoing battle between bulls and bears:
1. **Relative Strength**: When the buyer line rises faster than the seller line, bulls are gaining strength relative to bears - a bullish signal. When the seller line falls faster than the buyer line, bears are dominating - a bearish signal.
2. **Market Consensus**: Convergence between lines suggests market participants are reaching consensus about price direction. Divergence suggests growing disagreement and potential for stronger moves.
3. **Exhaustion Signals**: Major peaks in either line that are highlighted by background colors suggest moments where one side (buyers or sellers) has reached maximum strength - often precursors to reversals.
4. **Trend Confirmation**: The status indicators (Near, Far, Normal) provide context about the current market phase, helping confirm whether a trend is establishing, continuing strongly, or potentially fading.
Remember:
- Combine signals from buyer/seller lines, distance measurements, and peak formations
- Use appropriate timeframe settings for your trading style
- Monitor the analysis table for additional context
- Consider market conditions and correlate with price action
This indicator works best when:
- Used as part of a comprehensive trading system
- Combined with proper risk management
- Applied with an understanding of current market conditions
- Signals are confirmed by price action and other indicators
**DISCLAIMER**: This indicator and its signals are intended solely for educational and informational purposes. They do not constitute financial advice. Trading involves significant risk of loss. Always conduct your own analysis and consult with financial professionals before making trading decisions.

Renz-GPT IndicatorThe Renz-GPT Indicator is a powerful, all-in-one trading tool designed to simplify decision-making and improve trade accuracy using a combination of trend, momentum, and volume analysis.
🔍 How It Works
Trend Detection:
Uses two EMAs (Exponential Moving Averages) to identify the current market trend.
A higher timeframe EMA acts as a trend filter to align trades with the larger market trend.
Momentum Confirmation:
RSI (Relative Strength Index) confirms the momentum strength.
Only takes trades when the momentum aligns with the trend.
Volume Confirmation:
Uses On-Balance Volume (OBV) to verify if volume supports the trend direction.
Signal Calculation:
Combines trend, momentum, and volume signals to create a high-probability trade setup.
Filters out weak signals to avoid false trades.
Entry, Stop Loss & Take Profit:
Displays clear LONG and SHORT markers on the chart.
Automatically calculates and displays Stop Loss and Take Profit levels based on ATR (Average True Range).
Alerts:
Sends real-time alerts when a valid buy or sell signal occurs.
Alerts include entry price, stop loss, and take profit levels.

PLN IndexThe "PLN Index" is a custom indicator developed for TradingView using Pine Script (version 6). It tracks the relative strength of the Polish Zloty (PLN) against a basket of four major currencies: the U.S. Dollar (USD), Swiss Franc (CHF), Euro (EUR), and British Pound (GBP), with each currency contributing an equal weight of 25%. Modeled after the Polish Zloty Index (PLN_I) concept, this indicator offers traders a tool to monitor PLN’s performance across various forex market conditions.
How It Works
The indicator fetches closing prices for the currency pairs USDPLN, CHFPLN, EURPLN, and GBPPLN from TradingView’s data provider (FX_IDC). These pairs represent the amount of PLN needed to purchase one unit of each respective foreign currency. To measure PLN’s strength, the script inverts these rates (e.g., PLNUSD = 1/USDPLN) and calculates the geometric mean of the resulting values using the formula geom_mean = (PLNUSD * PLNCHF * PLNEUR * PLNGBP)^(0.25). The result is then normalized to a base value of 100 at the first bar with complete data, allowing users to observe relative changes in PLN’s value over time. A rising index indicates PLN appreciation, while a falling index suggests depreciation against the basket.
Key Features
Data Inputs: Retrieves closing prices for USDPLN, CHFPLN, EURPLN, and GBPPLN on the selected timeframe.
Calculation: Computes the geometric mean of the inverted exchange rates and normalizes it to 100 based on the first valid bar.
Visualization: Plots the index as a blue line with a linewidth of 2 on a separate chart pane (non-overlay).
Robust Normalization: Normalizes the index using the first bar where all data is available, improving reliability across different timeframes.
Usage
The PLN Index is useful for:
Evaluating the Polish Zloty’s strength or weakness relative to a balanced currency basket.
Identifying long-term trends or short-term shifts in PLN’s value for forex trading or economic analysis.
Supporting technical analysis when paired with additional indicators, such as moving averages or oscillators.
Limitations
Data Dependency: The indicator relies on the availability of historical data for all four currency pairs. Missing data (e.g., on higher timeframes like D1 or W1) may prevent accurate plotting.
Relative Normalization: Unlike the official PLN_I, which uses a fixed historical base date (e.g., January 2, 1984), this indicator normalizes to 100 at the first valid bar, making it a relative rather than absolute measure.
Potential Data Gaps: On higher timeframes, inconsistencies or limited historical data from the FX_IDC provider may result in incomplete index values.
Notes
This version of the PLN Index includes an improved normalization method that sets the base value (100) at the first bar with valid data, enhancing its adaptability compared to earlier iterations. It performs best on timeframes up to H4, where data availability is generally consistent. For higher timeframes, users should verify data completeness to ensure reliable results.
Broad Market MOEX non normalazeBroad Market MOEX - Relative Strength Indicator for MOEX Stocks
This indicator allows you to compare the price dynamics of major Moscow Exchange stocks relative to the selected asset during the trading session.
Features:
• Tracks 10 key MOEX stocks: Sberbank, Rosneft, Lukoil, Gazprom Neft, NOVATEK, Nornickel, Polyus, Tatneft, Surgutneftegas, Severstal
• Shows the percentage price change of each stock relative to the base price at the start of trading (default 9:00 MSK)
• Allows you to customize the base time for reference
• Clearly displays the strength and weakness of individual stocks relative to each other
• Helps identify leaders and laggards during the trading session
How to use:
1. Add the indicator to any MOEX stock chart
2. Adjust the base time if needed (default 9:00)
3. Monitor the relative dynamics of stocks
4. Use for:
- Finding strong/weak stocks
- Identifying sector rotation
- Intraday trading
- Correlation analysis
Color coding of lines helps easily identify each stock on the chart.
The indicator is useful for intraday traders and anyone monitoring the relative strength of stocks on the Moscow Exchange.

MATA GOLD RATIOMata Gold Instrument: User Guide
The Instrument to Gold Oscillator is a technical analysis tool that normalizes the ratio of an instrument's price (e.g., BTC/USD) to the price of gold (XAU/USD) into a 0-100 scale. This provides a clear and intuitive way to evaluate the relative performance of an instrument compared to gold over a specified period.
---
How It Works
1. Calculation of the Ratio:
The ratio is calculated as:
\text{Ratio} = \frac{\text{Instrument Price}}{\text{Gold Price}}
2. Normalization:
The ratio is normalized using the highest and lowest values over a user-defined period (length), typically 14 periods:
\text{Normalized Ratio} = \frac{\text{Ratio} - \text{Min(Ratio)}}{\text{Max(Ratio)} - \text{Min(Ratio)}} \times 100
3. Overbought/Oversold Levels:
Above 80: The instrument is relatively expensive compared to gold (overbought).
Below 20: The instrument is relatively cheap compared to gold (oversold).
---
How to Use the Oscillator
1. Identify Overbought and Oversold Levels:
If the oscillator rises above 80, the instrument may be overvalued relative to gold. This could signal a potential reversal or correction.
If the oscillator falls below 20, the instrument may be undervalued relative to gold. This could signal a buying opportunity.
2. Track Trends:
Rising oscillator values indicate the instrument is gaining value relative to gold.
Falling oscillator values indicate the instrument is losing value relative to gold.
3. Crossing the Midline (50):
When the oscillator crosses above 50, the instrument's value is gaining strength relative to gold.
When it crosses below 50, the instrument is weakening relative to gold.
4. Combine with Other Indicators:
Use this oscillator alongside other technical indicators (e.g., RSI, MACD, STOCH) for more robust decision-making.
Confirm signals from the oscillator with price action or volume analysis.
---
Example Scenarios
1. Trading Cryptocurrencies Against Gold:
If BTC/USD's oscillator value is above 80, Bitcoin may be overvalued relative to gold. Consider reducing exposure or looking for short opportunities.
If BTC/USD's oscillator value is below 20, Bitcoin may be undervalued relative to gold. This could be a good time to accumulate.
2. Commodities vs. Gold:
Analyze the relative strength of commodities (e.g., oil, silver) against gold using the oscillator to identify periods of overperformance or underperformance.
---
Advantages of the Oscillator
Relative Performance Insight: Tracks the performance of an instrument relative to gold, providing a macro perspective.
Clear Visual Representation: The 0-100 scale makes it easy to identify overbought/oversold conditions and trend shifts.
Customizable Periods: The user-defined length allows flexibility in analyzing short- or long-term trends.
---
Limitations
Dependence on Gold: As the oscillator is based on gold prices, any external shocks to gold (e.g., geopolitical events) can influence its signals.
No Absolute Buy/Sell Signals: The oscillator should not be used in isolation but as part of a broader analysis strategy.
---
By using the Instrument to Gold Oscillator effectively, traders and investors can gain valuable insights into the relative valuation and performance of assets compared to gold, enabling more informed trading and investment decisions.

[MAD] Weighted Trend Detector--> Purpose
The Weighted Trend Detector evaluates market direction by combining multiple technical indicators (RSI, MACD, Moving Averages, ADX, and Volume) across up to three different timeframes.
It calculates an overall trend score to help visualize whether conditions are bullish, bearish, or neutral.
--> Scaling & Weightings
Each component indicator contributes a score between -1.0 and +1.0. User-defined weights (e.g., 0.2 for RSI, 0.3 for MACD) determine how much each indicator influences the final score. An adaptive scaling mechanism ensures extreme values remain in view by dynamically setting the minimum and maximum of the score range over a specified lookback period.
--> Basic Parameters of Individual Indicators
RSI Period: Number of bars for the Relative Strength Index calculation; higher values smooth out noise but may lag.
MACD Fast/Slow/Signal: EMA-based periods to identify momentum shifts. A shorter “Fast” length reacts quickly, while a longer “Slow” length is smoother.
Moving Averages (Short & Long Lengths): Simple Moving Averages used to gauge shorter- vs. longer-term price direction.
ADX Length: Defines how many bars are considered when measuring trend strength. Higher values produce smoother ADX lines.
Volume MA Length: Period over which the average volume is calculated to compare against current volume.
--> Colors & How They Are Mixed
The background color scales from a negative color (for lower scores) to a positive color (for higher scores).
Near the highest or lowest parts of the score range, additional blending occurs if the slope (change in score) reverses:
Turning Down: Mixes with a user-chosen “warning” color if the score is high but moving lower.
Turning Up: Mixes with a user-chosen “recovery” color if the score is low but moving higher.
All colors (including line and label text) can be adjusted in the script’s inputs to suit personal preferences.colors are customizable via inputs.
Have fun :-)

RSI-Adjusted 9SMAThis indicator integrates the Relative Strength Index (RSI) and a Simple Moving Average (SMA) to create a more robust trading signal by blending momentum and trend analysis. Here's how they work together:
How the RSI and SMA Work in Harmony
RSI (Momentum Indicator):
The RSI measures the speed and change of price movements, oscillating between 0 and 100.
Typically, an RSI value above 50 suggests bullish momentum, while values below 50 indicate bearish momentum.
The script further refines this by applying a 9-period EMA to the RSI. This smoothing process filters out noise, providing a clearer picture of momentum shifts.
SMA (Trend Indicator):
The SMA calculates the average price over a specific period (9 in this case), helping to smooth out price fluctuations and identify the overall trend.
By observing the SMA, traders can determine whether the market is trending upward, downward, or moving sideways.
Combining the Two for Stronger Signals:
The RSI EMA acts as a momentum filter. When it is above 50, it indicates the presence of bullish momentum. Under such conditions, the SMA turning blue provides a stronger confirmation of an uptrend.
Conversely, when the RSI EMA is below 50, it signals weakening momentum. The SMA turning white underlines the caution, suggesting potential bearish conditions or a lack of trend strength.
This combination ensures that traders are not just relying on the SMA's trend-following behavior but also factoring in the market's underlying momentum for more reliable entries and exits.
Why This Approach is Robust
Avoid False Signals:
The SMA alone can generate false signals in choppy or range-bound markets. By incorporating the RSI EMA, the script reduces the likelihood of acting on weak or non-committal trends.
Timing Entries and Exits:
When both the SMA and RSI EMA align (e.g., blue SMA and RSI EMA > 50), it provides a stronger case for entering trades. Similarly, misalignment (e.g., white SMA and RSI EMA ≤ 50) warns against entering during uncertain conditions.
Adapting to Market Conditions:
This dual approach captures both short-term momentum shifts (RSI EMA) and longer-term trend direction (SMA), making it useful across different market phases.
Practical Application
Bullish Setup:
RSI EMA > 50 + Blue SMA → Enter or stay in long positions.
Bearish Setup:
RSI EMA ≤ 50 + White SMA → Exit long positions or consider short opportunities.
This combination of indicators offers traders a balanced strategy that considers both the direction of the trend and the underlying momentum, resulting in more confident and timely decision-making.

Bollinger Breakout Strategy with Direction Control [4H crypto]Bollinger Breakout Strategy with Direction Control - User Guide
This strategy leverages Bollinger Bands, RSI, and directional filters to identify potential breakout trading opportunities. It is designed for traders looking to capitalize on significant price movements while maintaining control over trade direction (long, short, or both). Here’s how to use this strategy effectively:
How the Strategy Works
Indicators Used:
Bollinger Bands:
A volatility-based indicator with an upper and lower band around a simple moving average (SMA). The bands expand or contract based on market volatility.
RSI (Relative Strength Index):
Measures momentum to determine overbought or oversold conditions. In this strategy, RSI is used to confirm breakout strength.
Trade Direction Control:
You can select whether to trade:
Long only: Buy positions.
Short only: Sell positions.
Both: Trade in both directions depending on conditions.
Breakout Conditions:
Long Trade:
The price closes above the upper Bollinger Band.
RSI is above the midline (50), confirming upward momentum.
The "Trade Direction" setting allows either "Long" or "Both."
Short Trade:
The price closes below the lower Bollinger Band.
RSI is below the midline (50), confirming downward momentum.
The "Trade Direction" setting allows either "Short" or "Both."
Risk Management:
Stop-Loss:
Long trades: Set at 2% below the entry price.
Short trades: Set at 2% above the entry price.
Take-Profit:
Calculated using a Risk/Reward Ratio (default is 2:1).
Adjust this in the strategy settings.
Inputs and Customization
Key Parameters:
Bollinger Bands Length: Default is 20. Adjust based on the desired sensitivity.
Multiplier: Default is 2.0. Higher values widen the bands; lower values narrow them.
RSI Length: Default is 14, which is standard for RSI.
Risk/Reward Ratio: Default is 2.0. Increase for more aggressive profit targets, decrease for conservative exits.
Trade Direction:
Options: "Long," "Short," or "Both."
Example: Set to "Long" in a bullish market to focus only on buy trades.
How to Use This Strategy
Adding the Strategy:
Paste the script into TradingView’s Pine Editor and add it to your chart.
Setting Parameters:
Adjust the Bollinger Band settings, RSI, and Risk/Reward Ratio to fit the asset and timeframe you're trading.
Analyzing Signals:
Green line (Upper Band): Signals breakout potential for long trades.
Red line (Lower Band): Signals breakout potential for short trades.
Blue line (Basis): Central Bollinger Band (SMA), helpful for understanding price trends.
Testing the Strategy:
Use the Strategy Tester in TradingView to backtest performance on your chosen asset and timeframe.
Optimizing for Assets:
Forex pairs, cryptocurrencies (like BTC), or stocks with high volatility are ideal for this strategy.
Works best on higher timeframes like 4H or Daily.
Best Practices
Combine with Volume: Confirm breakouts with increased volume for higher reliability.
Avoid Sideways Markets: Use additional trend filters (like ADX) to avoid trades in low-volatility conditions.
Optimize Parameters: Regularly adjust the Bollinger Bands multiplier and RSI settings to match the asset's behavior.
By utilizing this strategy, you can effectively trade breakouts while maintaining flexibility in trade direction. Adjust the parameters to match your trading style and market conditions for optimal results!

Cryptocurrency StrengthMulti-Currency Analysis: Monitor up to 19 different currencies simultaneously, including major pairs like USD, EUR, JPY, and GBP, as well as emerging market currencies such as CNY, INR, and BRL.
Customizable Display: Easily toggle the visibility of each currency and personalize their colors to suit your preferences, allowing for a tailored analysis experience.
Real-Time Strength Measurement: The indicator calculates and displays the relative strength of each currency in real-time, helping you identify potential trends and trading opportunities.
Clear Visual Representation: With color-coded lines and a dynamic legend, the indicator presents complex currency relationships in an easy-to-understand format.
Advantages
Comprehensive Market View: Gain insights into the broader forex market dynamics by analyzing multiple currencies at once.
Trend Identification: Quickly spot strong and weak currencies, aiding in the identification of potential trending pairs.
Divergence Detection: Use the indicator to identify divergences between currency strength and price action, potentially signaling reversals or continuation patterns.
Flexible Time Frames: Apply the indicator across various time frames to align with your trading strategy, from intraday to long-term analysis.
Enhanced Decision Making: Make more informed trading decisions by understanding the relative strength of currencies involved in your trades.
Unique Qualities
TSI-Based Calculations: Utilizes the True Strength Index for a more nuanced and responsive measure of currency strength compared to simple price-based indicators.
Adaptive Legend: The indicator features a dynamic legend that updates automatically based on the selected currencies, ensuring a clutter-free and relevant display.
Emerging Market Inclusion: Unlike many standard currency strength indicators, this tool includes a wide range of emerging market currencies, providing a truly global perspective.
Whether you're a seasoned forex trader or just starting out, this Currency Strength Indicator offers valuable insights that can complement your existing strategy and potentially improve your trading outcomes. Its combination of comprehensive analysis, customization options, and clear visualization makes it an essential tool for navigating the complex world of currency trading.

Divides company with IndexOverview:
This indicator simplifies the comparison of a stock's performance against a specified index, such as the Nifty 50. By calculating and plotting the ratio between the two, it provides a clear visual representation of relative strength.
Key Features:
-Direct Comparison: Easily compare any stock against a selected index.
-Customizable Index: Choose from a dropdown menu or input a custom index symbol.
-Visual Clarity: Maximizing the chart provides a clear view of the relative performance.
-SMA Overlay: Add a Simple Moving Average (SMA) to identify trends and potential entry/exit
points.
-Customizable Appearance: Adjust background color, text color, and label size for personalized
visualization.
How to Use:
Add the Indicator: Add the indicator to your chart.
Select the Index: Choose the desired index from the dropdown menu or input a custom symbol.
Analyze the Ratio:
-A rising ratio indicates the stock is outperforming the index.
-A falling ratio suggests underperformance.
-The SMA can help identify potential trends and momentum.
Customize the Appearance: Adjust the background color, text color, and label size to suit your preferences.
Benefits:
-Improved Decision Making: Gain insights into a stock's relative strength.
-Faster Analysis: Quickly compare multiple stocks against a benchmark index.
-Enhanced Visualization: Customize the chart for better understanding.
-By leveraging this indicator, you can make informed trading decisions and gain a deeper
understanding of market dynamics.
TrigWave Suite [InvestorUnknown]The TrigWave Suite combines Sine-weighted, Cosine-weighted, and Hyperbolic Tangent moving averages (HTMA) with a Directional Movement System (DMS) and a Relative Strength System (RSS).
Hyperbolic Tangent Moving Average (HTMA)
The HTMA smooths the price by applying a hyperbolic tangent transformation to the difference between the price and a simple moving average. It also adjusts this value by multiplying it by a standard deviation to create a more stable signal.
// Function to calculate Hyperbolic Tangent
tanh(x) =>
e_x = math.exp(x)
e_neg_x = math.exp(-x)
(e_x - e_neg_x) / (e_x + e_neg_x)
// Function to calculate Hyperbolic Tangent Moving Average
htma(src, len, mul) =>
tanh_src = tanh((src - ta.sma(src, len)) * mul) * ta.stdev(src, len) + ta.sma(src, len)
htma = ta.sma(tanh_src, len)
Sine-Weighted Moving Average (SWMA)
The SWMA applies sine-based weights to historical prices. This gives more weight to the central data points, making it responsive yet less prone to noise.
// Function to calculate the Sine-Weighted Moving Average
f_Sine_Weighted_MA(series float src, simple int length) =>
var float sine_weights = array.new_float(0)
array.clear(sine_weights) // Clear the array before recalculating weights
for i = 0 to length - 1
weight = math.sin((math.pi * (i + 1)) / length)
array.push(sine_weights, weight)
// Normalize the weights
sum_weights = array.sum(sine_weights)
for i = 0 to length - 1
norm_weight = array.get(sine_weights, i) / sum_weights
array.set(sine_weights, i, norm_weight)
// Calculate Sine-Weighted Moving Average
swma = 0.0
if bar_index >= length
for i = 0 to length - 1
swma := swma + array.get(sine_weights, i) * src
swma
Cosine-Weighted Moving Average (CWMA)
The CWMA uses cosine-based weights for data points, which produces a more stable trend-following behavior, especially in low-volatility markets.
f_Cosine_Weighted_MA(series float src, simple int length) =>
var float cosine_weights = array.new_float(0)
array.clear(cosine_weights) // Clear the array before recalculating weights
for i = 0 to length - 1
weight = math.cos((math.pi * (i + 1)) / length) + 1 // Shift by adding 1
array.push(cosine_weights, weight)
// Normalize the weights
sum_weights = array.sum(cosine_weights)
for i = 0 to length - 1
norm_weight = array.get(cosine_weights, i) / sum_weights
array.set(cosine_weights, i, norm_weight)
// Calculate Cosine-Weighted Moving Average
cwma = 0.0
if bar_index >= length
for i = 0 to length - 1
cwma := cwma + array.get(cosine_weights, i) * src
cwma
Directional Movement System (DMS)
DMS is used to identify trend direction and strength based on directional movement. It uses ADX to gauge trend strength and combines +DI and -DI for directional bias.
// Function to calculate Directional Movement System
f_DMS(simple int dmi_len, simple int adx_len) =>
up = ta.change(high)
down = -ta.change(low)
plusDM = na(up) ? na : (up > down and up > 0 ? up : 0)
minusDM = na(down) ? na : (down > up and down > 0 ? down : 0)
trur = ta.rma(ta.tr, dmi_len)
plus = fixnan(100 * ta.rma(plusDM, dmi_len) / trur)
minus = fixnan(100 * ta.rma(minusDM, dmi_len) / trur)
sum = plus + minus
adx = 100 * ta.rma(math.abs(plus - minus) / (sum == 0 ? 1 : sum), adx_len)
dms_up = plus > minus and adx > minus
dms_down = plus < minus and adx > plus
dms_neutral = not (dms_up or dms_down)
signal = dms_up ? 1 : dms_down ? -1 : 0
Relative Strength System (RSS)
RSS employs RSI and an adjustable moving average type (SMA, EMA, or HMA) to evaluate whether the market is in a bullish or bearish state.
// Function to calculate Relative Strength System
f_RSS(rsi_src, rsi_len, ma_type, ma_len) =>
rsi = ta.rsi(rsi_src, rsi_len)
ma = switch ma_type
"SMA" => ta.sma(rsi, ma_len)
"EMA" => ta.ema(rsi, ma_len)
"HMA" => ta.hma(rsi, ma_len)
signal = (rsi > ma and rsi > 50) ? 1 : (rsi < ma and rsi < 50) ? -1 : 0
ATR Adjustments
To minimize false signals, the HTMA, SWMA, and CWMA signals are adjusted with an Average True Range (ATR) filter:
// Calculate ATR adjusted components for HTMA, CWMA and SWMA
float atr = ta.atr(atr_len)
float htma_up = htma + (atr * atr_mult)
float htma_dn = htma - (atr * atr_mult)
float swma_up = swma + (atr * atr_mult)
float swma_dn = swma - (atr * atr_mult)
float cwma_up = cwma + (atr * atr_mult)
float cwma_dn = cwma - (atr * atr_mult)
This adjustment allows for better adaptation to varying market volatility, making the signal more reliable.
Signals and Trend Calculation
The indicator generates a Trend Signal by aggregating the output from each component. Each component provides a directional signal that is combined to form a unified trend reading. The trend value is then converted into a long (1), short (-1), or neutral (0) state.
Backtesting Mode and Performance Metrics
The Backtesting Mode includes a performance metrics table that compares the Buy and Hold strategy with the TrigWave Suite strategy. Key statistics like Sharpe Ratio, Sortino Ratio, and Omega Ratio are displayed to help users assess performance. Note that due to labels and plotchar use, automatic scaling may not function ideally in backtest mode.
Alerts and Visualization
Trend Direction Alerts: Set up alerts for long and short signals
Color Bars and Gradient Option: Bars are colored based on the trend direction, with an optional gradient for smoother visual feedback.
Important Notes
Customization: Default settings are experimental and not intended for trading/investing purposes. Users are encouraged to adjust and calibrate the settings to optimize results according to their trading style.
Backtest Results Disclaimer: Please note that backtest results are not indicative of future performance, and no strategy guarantees success.

Savitzky Golay Median Filtered RSI [BackQuant]Savitzky Golay Median Filtered RSI
Introducing BackQuant's Savitzky Golay Median Filtered RSI, a cutting-edge indicator that enhances the classic Relative Strength Index (RSI) by applying both a Savitzky-Golay filter and a median filter to provide smoother and more reliable signals. This advanced approach helps reduce noise and captures true momentum trends with greater precision. Let’s break down how the indicator works, the features it offers, and how it can improve your trading strategy.
Core Concept: Relative Strength Index (RSI)
The Relative Strength Index (RSI) is a widely used momentum oscillator that measures the speed and change of price movements. It oscillates between 0 and 100, with levels above 70 typically indicating overbought conditions and levels below 30 indicating oversold conditions. However, the standard RSI can sometimes generate noisy signals, especially in volatile markets, making it challenging to identify reliable entry and exit points.
To improve upon the traditional RSI, this indicator introduces two powerful filters: the Savitzky-Golay filter and a median filter.
Savitzky-Golay Filter: Smoothing with Precision
The Savitzky-Golay filter is a digital filtering technique used to smooth data while preserving important features, such as peaks and trends. Unlike simple moving averages that can distort important price data, the Savitzky-Golay filter uses polynomial regression to fit the data, providing a more accurate and less lagging result.
In this script, the Savitzky-Golay filter is applied to the RSI values to smooth out short-term fluctuations and provide a more reliable signal. By using a window size of 5 and a polynomial degree of 2, the filter effectively reduces noise without compromising the integrity of the underlying price movements.
Median Filter: Reducing Outliers
After applying the Savitzky-Golay filter, the median filter is applied to the smoothed RSI values. The median filter is particularly effective at removing short-lived outliers, further enhancing the accuracy of the RSI by reducing the impact of sudden and temporary price spikes or drops. This combination of filters creates an ultra-smooth RSI that is better suited for detecting true market trends.
Long and Short Signals
The Savitzky Golay Median Filtered RSI generates long and short signals based on user-defined threshold levels:
Long Signals: A long signal is triggered when the filtered RSI exceeds the Long Threshold (default set at 176). This indicates that momentum is shifting upward, and it may present a good buying opportunity.
Short Signals: A short signal is generated when the filtered RSI falls below the Short Threshold (default set at 162). This suggests that momentum is weakening, potentially signaling a selling opportunity or exit from a long position.
These threshold levels can be adjusted to suit different market conditions and timeframes, allowing traders to fine-tune the sensitivity of the indicator.
Customization and Visualization Options
The Savitzky Golay Median Filtered RSI comes with several customization options, enabling traders to tailor the indicator to their specific needs:
Calculation Source: Select the price source for the RSI calculation (default is OHLC4, but it can be changed to close, open, high, or low prices).
RSI Period: Adjust the lookback period for the RSI calculation (default is 14).
Median Filter Length: Control the length of the median filter applied to the smoothed RSI, affecting how much noise is removed from the signal.
Threshold Levels: Customize the long and short thresholds to define the sensitivity for generating buy and sell signals.
UI Settings: Choose whether to display the RSI and thresholds on the chart, color the bars according to trend direction, and adjust the line width and colors used for long and short signals.
Visual Feedback: Color-Coded Signals and Thresholds
To make the signals easier to interpret, the indicator offers visual feedback by coloring the price bars and the RSI plot according to the current market trend:
Green Bars indicate long signals when momentum is bullish.
Red Bars indicate short signals when momentum is bearish.
Gray Bars indicate neutral or undecided conditions when no clear signal is present.
In addition, the Long and Short Thresholds can be plotted directly on the chart to provide a clear reference for when signals are triggered, allowing traders to visually gauge the strength of the RSI relative to its thresholds.
Alerts for Automation
For traders who prefer automated notifications, the Savitzky Golay Median Filtered RSI includes built-in alert conditions for long and short signals. You can configure these alerts to notify you when a buy or sell condition is met, ensuring you never miss a trading opportunity.
Trading Applications
This indicator is versatile and can be used in a variety of trading strategies:
Trend Following: The combination of Savitzky-Golay and median filtering makes this RSI particularly useful for identifying strong trends without being misled by short-term noise. Traders can use the long and short signals to enter trades in the direction of the prevailing trend.
Reversal Trading: By adjusting the threshold levels, traders can use this indicator to spot potential reversals. When the RSI moves from overbought to oversold levels (or vice versa), it may signal a shift in market direction.
Swing Trading: The smoothed RSI provides a clear signal for short to medium-term price movements, making it an excellent tool for swing traders looking to capitalize on momentum shifts.
Risk Management: The filtered RSI can be used as part of a broader risk management strategy, helping traders avoid false signals and stay in trades only when the momentum is strong.
Final Thoughts
The Savitzky Golay Median Filtered RSI takes the classic RSI to the next level by applying advanced smoothing techniques that reduce noise and improve signal reliability. Whether you’re a trend follower, swing trader, or reversal trader, this indicator provides a more refined approach to momentum analysis, helping you make better-informed trading decisions.
As with all indicators, it is important to backtest thoroughly and incorporate sound risk management strategies when using the Savitzky Golay Median Filtered RSI in your trading system.
Thus following all of the key points here are some sample backtests on the 1D Chart
Disclaimer: Backtests are based off past results, and are not indicative of the future.
INDEX:BTCUSD
INDEX:ETHUSD
BINANCE:SOLUSD

LV Stock QualityCritical financial and technical values are listed in the table.
PIOTROSKI_F_SCORE (expect. >5) -> The Piotroski score is a discrete score between zero and nine that reflects nine criteria used to determine the strength of a firm's financial position. The Piotroski score is used to determine the best value stocks, with nine being the best and zero being the worst. Having a score bigger than 5 is a good sign for the strength of a firm's financial position
ROE (expect. >11) --> Return on equity (ROE) is a measure of a company's financial performance. It is calculated by dividing net income by shareholders' equity. Because shareholders' equity is equal to a company’s assets minus its debt, ROE is a way of showing a company's return on net assets. A “good” ROE will depend on the company’s industry and competitors.
EPS_GROWTH (expect. >11) --> This indicator is calculated as the percentage change in Basic earnings per share for one year. This indicator reflects the growth rate of a company's basic profit per share outstanding for one year. It is calculated based using only common shares. An increase in EPS growth may signal that a company is becoming more profitable and efficient in its operations. A decline in EPS growth may signal that a company is spending more or losing business share. EPS growth should be viewed alongside other metrics like revenue and costs.
CURRENT_RATIO (expect. >1.25) --> The current ratio measures a company’s ability to pay current, or short-term, liabilities (debt and payables) with its current, or short-term, assets (cash, inventory, and receivables). Current ratios over 1.00 indicate that a company's current assets are greater than its current liabilities, meaning it could more easily pay of short-term debts.
OPERATING_MARGIN(expect. >11) --> The operating margin measures how much profit a company makes on a dollar of sales after paying for variable costs of production, such as wages and raw materials, but before paying interest or tax.
RETURN_CAPITAL (expect. >11) --> Return of capital (ROC) is a payment that an investor receives as a portion of their original investment and that is not considered income or capital gains from the investment.
ALTMAN_Z_SCORE (expect. >1.8) --> The Altman Z-score is the output of a credit-strength test that gauges a publicly traded manufacturing company's likelihood of bankruptcy. An Altman Z-score close to 0 suggests a company might be headed for bankruptcy, while a score closer to 3 suggests a company is in solid financial positioning.
REVENUE_GROWTH (expect. >11) --> Quarterly revenue growth is an increase in a company's sales in one quarter compared to sales of a different quarter. Comparing a company's financials from one period to another gives a clear picture of its revenue growth rate and can help investors identify the catalyst for such growth.
SUSTAINABLE_GROWTH (expect. >11) --> The sustainable growth rate (SGR) is the maximum rate of growth that a company or social enterprise can sustain without having to finance growth with additional equity or debt. In other words, it is the rate at which the company can grow while using its own internal revenue without borrowing from outside sources.
DEBT TO INCOME (expect. <0.4) --> A debt-to-income (DTI) ratio is a financial metric used by lenders to determine your borrowing risk. Your DTI ratio represents the total amount of debt you owe compared to the total amount of money you earn each month.
NORMALIZED ATR (expect. <8, W) --> The Normalized Average True Range (Normalized ATR) is an indicator used to measure market volatility by normalizing the average true range values. It does this by dividing the Average True Range (ATR) by the asset's closing price, converting it into a percentage. This normalization allows for the comparison of volatility levels across different securities or market conditions, regardless of the asset's price levels. The Normalized ATR helps traders to adjust their strategies based on relative volatility, rather than absolute price movements.
INDEX expect. EMA10>EMA20 --> it is expected to have EMA 10 > EMA 20 in weekly basis graph. It is known that having a strong trend in index will also increases chance of strong trend on stock levels. You need to select INDEX Market of stock via settings.
M. RELATIVE STRENGTH expect. MRS>1 --> Stan Weinstein uses the Mansfield RS indicator as another relative strength indicator. The indicator measures the variation in the 52-week ratio of stock and market.
VOLUME CHANGE (expect. >30) --> Having an increase on volume comparing to previous week can be a good sign if it occurs at the same time of breakout.
PRICE CHANGE (expect. >5 and <20) --> Having an increase on price comparing to previous week can be a good sign if it occurs at the same time of breakout.
It is better to look on weekly basis graphs.
Pappabborgia Nasdaq RSI This script provides a custom Relative Strength Index (RSI) indicator that plots both the RSI of the selected stock and the Nasdaq (IXIC) on the same chart.
It offers a clear, side-by-side view to help traders better understand the stock's momentum relative to the overall market.
Key Features:
RSI Calculation for the Stock:
The script calculates the RSI for the chosen stock, with a default period of 14, adjustable to fit different timeframes.
The stock’s RSI is displayed in green 🟢, providing a direct view of its strength and momentum 📈.
RSI of the Nasdaq:
The script fetches the Nasdaq’s closing prices and calculates its RSI, which is shown in red for clear comparison 🔴.
Legend for Clarity:
A simple legend in the top-right corner identifies the green line as the stock’s RSI and the red line as the Nasdaq’s RSI, making it easy to interpret 📊.
Why Comparing the Stock's RSI to the Nasdaq Matters:
Broader Market Context:
Viewing both RSIs on the same chart helps you see whether the stock is moving in sync with the broader market or behaving independently. This provides valuable context for decision-making 📉.
Relative Strength Insights:
Comparing the stock’s RSI to the Nasdaq’s RSI highlights whether the stock is outperforming or underperforming the overall market, helping identify potential opportunities or risks 🟢🔴.
Improved Risk Management:
Monitoring overbought or oversold conditions in both the stock and Nasdaq RSIs can signal broader market trends and help avoid risky trades ⚠️.
Overall Benefit:
By tracking the RSI of both the stock and the Nasdaq, this script offers a powerful tool for understanding a stock's relative strength, providing essential context for smarter trading decisions 🎯.
MCDX+RSI+SMA[THANHCONG]### Detailed Analysis of the MCDX+RSI+SMA Indicator
The MCDX+RSI+SMA indicator is designed to help investors conduct a deeper analysis of market trends by combining multiple technical factors into a single chart. This integration of popular indicators such as RSI, SMA, and Stochastic RSI provides investors with a comprehensive view of market movements, particularly in distinguishing between "Banker" and "Hot Money"—representing large and small capital flows.
#### Key Components of the Indicator:
1. **RSI for Banker and Hot Money:**
- **RSI (Relative Strength Index)** is a momentum oscillator that measures the speed and change of price movements, indicating overbought or oversold conditions. In this indicator, there are two distinct RSI lines configured for Banker (large capital) and Hot Money (small capital).
- Investors can adjust parameters like the RSI calculation period, baseline levels, and sensitivity for each type of capital flow, providing flexibility to adapt to varying market conditions.
2. **Moving Average (MA) of RSI:**
- The indicator employs two common types of Moving Averages: **SMA (Simple Moving Average)** and **EMA (Exponential Moving Average)**. These help smooth the RSI signals for Banker, offering a clearer view of the long-term trend of large capital in the market.
- Investors can select the type and period of the MA, allowing them to optimize the indicator for their trading style.
3. **Stochastic RSI:**
- The **Stochastic RSI** is incorporated to monitor overbought and oversold conditions over a specified timeframe. Parameters related to %K and %D of the Stochastic can also be adjusted to refine the accuracy of market signal analysis.
- A notable feature is the normalization of %K and %D on a 0-20 scale, making these lines compatible with other RSI charts, thus providing consistency in evaluating market strength.
4. **Overbought and Oversold Levels:**
- The indicator includes reference lines for overbought and oversold levels, aiding investors in identifying potential reversal zones in the market. This helps to avoid buying at excessively high prices or selling at excessively low prices.
#### Benefits for Investors:
- **Comprehensive View:** The indicator combines insights from both large (Banker) and small (Hot Money) capital flows, enabling investors to analyze not just trends but also the participation of each type of capital in the market.
- **Enhanced Technical Analysis:** By integrating multiple technical indicators within a single chart, investors can track important factors such as market momentum, overbought/oversold conditions, and capital flow shifts without needing to switch between various charts.
- **Flexibility and Customization:** The indicator allows adjustment of key parameters like the RSI period, sensitivity, type of MA, and Stochastic RSI settings, enabling investors to tailor the indicator to their trading strategy and timeframe.
- **Higher Reliability:** The combination of indicators like RSI, Stochastic RSI, and MA helps investors confirm trading signals more confidently. For instance, when both RSI and Stochastic RSI indicate overbought conditions, the likelihood of a reversal may be higher, reducing risk for investors.
#### Unique Features of the Indicator:
The MCDX+RSI+SMA indicator is a unique tool that integrates various market analysis factors into a single framework. This not only provides investors with a complete view of capital flows but also aids in optimizing decision-making based on multiple market aspects. Furthermore, its customizable parameters make it suitable for various trading strategies, from short-term to long-term.
Swiss Knife [MERT]Introduction
The Swiss Knife indicator is a comprehensive trading tool designed to provide a multi-dimensional analysis of the market. By integrating a wide array of technical indicators across multiple timeframes, it offers traders a holistic view of market sentiment, momentum, and potential reversal points. This indicator is particularly useful for traders looking to combine trend analysis, momentum indicators, volume data, and price action into a single, easy-to-read format.
---
Key Features
Multi-Timeframe Analysis : Evaluates indicators on Daily , 4-Hour , 1-Hour , and 15-Minute timeframes.
Comprehensive Indicator Suite : Incorporates MACD , Awesome Oscillator (AO) , Parabolic SAR , SuperTrend , DPO , RSI , Stochastic Oscillator , Bollinger Bands , Ichimoku Cloud , Chande Momentum Oscillator (CMO) , Donchian Channels , ADX , volume-based momentum indicators, Fractals , and divergence detection.
Market Sentiment Scoring : Aggregates signals from multiple indicators to provide an overall sentiment score.
Visual Aids : Displays EMA lines, trendlines, divergence signals, and a sentiment table directly on the chart.
Super Trend Reversal Signals : Identifies potential market reversal points by assessing the momentum of automated trading bots.
---
Explanation of Each Indicator
Moving Average Convergence Divergence (MACD)
- Purpose : Measures the relationship between two moving averages of price.
- Interpretation : A positive histogram suggests bullish momentum; a negative histogram indicates bearish momentum.
Awesome Oscillator (AO)
- Purpose : Gauges market momentum by comparing recent market movements to historic ones.
- Interpretation : Above zero indicates bullish momentum; below zero indicates bearish momentum.
Parabolic SAR (SAR)
- Purpose : Identifies potential reversal points in price direction.
- Interpretation : Dots below price suggest an uptrend; dots above price suggest a downtrend.
SuperTrend
- Purpose : Determines the prevailing market trend.
- Interpretation : Provides buy or sell signals based on price movements relative to the SuperTrend line.
Detrended Price Oscillator (DPO)
- Purpose : Removes trend from price to identify cycles.
- Interpretation : Values above zero suggest price is above the moving average; values below zero indicate it is below.
Relative Strength Index (RSI)
- Purpose : Measures the speed and change of price movements.
- Interpretation : Values above 50 indicate bullish momentum; values below 50 indicate bearish momentum.
Stochastic Oscillator
- Purpose : Compares a particular closing price to a range of its prices over a certain period.
- Interpretation : Values above 50 indicate bullish conditions; values below 50 indicate bearish conditions.
Bollinger Bands (BB)
- Purpose : Measures market volatility and provides relative price levels.
- Interpretation : Price above the middle band suggests bullishness; below the middle band suggests bearishness.
Ichimoku Cloud
- Purpose : Provides support and resistance levels, trend direction, and momentum.
- Interpretation : Bullish signals when price is above the cloud; bearish signals when price is below the cloud.
Chande Momentum Oscillator (CMO)
- Purpose : Measures momentum on both up and down days.
- Interpretation : Values above 50 indicate strong upward momentum; values below -50 indicate strong downward momentum.
Donchian Channels
- Purpose : Identifies volatility and potential breakouts.
- Interpretation : Price above the upper band suggests bullish breakout; below the lower band suggests bearish breakout.
Average Directional Index (ADX)
- Purpose : Measures the strength of a trend.
- Interpretation : DI+ above DI- indicates bullish trend; DI- above DI+ indicates bearish trend.
Volume Momentum Indicators (VolMom, CumVolMom, POCMom)
- Purpose : Analyze volume to assess buying and selling pressure.
- Interpretation : Positive values suggest bullish volume momentum; negative values indicate bearish volume momentum.
Fractals
- Purpose : Identify potential reversal points in the market.
- Interpretation : Up fractals may indicate a future downtrend; down fractals may indicate a future uptrend.
Divergence Detection
- Purpose : Identifies divergences between price and various indicators (RSI, MACD, Stochastic, OBV, MFI, A/D Line).
- Interpretation : Bullish divergences suggest potential upward reversal; bearish divergences suggest potential downward reversal.
- Note : This functionality utilizes the library from Divergence Indicator .
---
Coloring Scheme
Background Color
- Purpose : Reflects the overall market sentiment by combining sentiment scores from all indicators across different timeframes.
- Interpretation :
- Green Shades : Indicate bullish market sentiment.
- Red Shades : Indicate bearish market sentiment.
- Intensity : The strength of the color corresponds to the strength of the sentiment score.
Sentiment Table
- Purpose : Displays the status of each indicator across different timeframes.
- Interpretation :
- Green Cell : The indicator suggests a bullish signal.
- Red Cell : The indicator suggests a bearish signal.
- Percentage Score : Indicates the overall bullish or bearish sentiment on that timeframe.
Exponential Moving Averages (EMAs)
- Purpose : Provide dynamic support and resistance levels.
- Colors :
- EMA 10 : Lime
- EMA 20 : Yellow
- EMA 50 : Orange
- EMA 100 : Red
- EMA 200 : Purple
Trendlines
- Purpose : Visual representation of support and resistance levels based on pivot points.
- Interpretation :
- Upward Trendlines : Colored green , indicating support levels.
- Downward Trendlines : Colored red , indicating resistance levels.
- Note : Trendlines are drawn using the library from Simple Trendlines .
---
Utility of Market Sentiment
The indicator aggregates signals from multiple technical indicators across various timeframes to compute an overall market sentiment score . This comprehensive approach helps traders understand the prevailing market conditions by:
Confirming Trends : Multiple indicators pointing in the same direction can confirm the strength of a trend.
Identifying Reversals : Divergences and fractals can signal potential turning points.
Timeframe Alignment : Aligning signals across different timeframes can enhance the probability of successful trades.
---
Divergences
Divergence occurs when the price of an asset moves in the opposite direction of a technical indicator, suggesting a potential reversal.
- Bullish Divergence : Price makes a lower low, but the indicator makes a higher low.
- Bearish Divergence : Price makes a higher high, but the indicator makes a lower high.
The indicator detects divergences for:
RSI
MACD
Stochastic Oscillator
On-Balance Volume (OBV)
Money Flow Index (MFI)
Accumulation/Distribution Line (A/D Line)
By identifying these divergences, traders can spot early signs of trend reversals and adjust their strategies accordingly.
---
Trendlines
Trendlines are essential tools for identifying support and resistance levels. The indicator automatically draws trendlines based on pivot points:
- Upward Trendlines (Support) : Connect higher lows, indicating an uptrend.
- Downward Trendlines (Resistance) : Connect lower highs, indicating a downtrend.
These trendlines help traders visualize the trend direction and potential breakout or reversal points.
---
Super Trend Reversals (ST Reversal)
The core idea behind the Super Trend Reversals indicator is to assess the momentum of automated trading bots (often referred to as 'Supertrend bots') that enter the market during critical turning points. Specifically, the indicator is tuned to identify when the market is nearing bottoms or peaks, just before it shifts direction based on the triggered Supertrend signals. This approach helps traders:
Engage Early : Enter the market as reversal momentum builds up.
Optimize Entries and Exits : Enter under favorable conditions and exit before momentum wanes.
By capturing these reversal points, traders can enhance their trading performance.
---
Conclusion
The Swiss Knife indicator serves as a versatile tool that combines multiple technical analysis methods into a single, comprehensive indicator. By assessing various aspects of the market—including trend direction, momentum, volume, and price action—it provides traders with valuable insights to make informed trading decisions.
---
Citations
- Divergence Detection Library : Divergence Indicator by DevLucem
- Trendline Drawing Library : Simple Trendlines by HoanGhetti
---
Note : This indicator is intended for informational purposes and should be used in conjunction with other analysis techniques. Always perform due diligence before making trading decisions.
---

RSI Trend Following StrategyOverview
The RSI Trend Following Strategy utilizes Relative Strength Index (RSI) to enter the trade for the potential trend continuation. It uses Stochastic indicator to check is the price is not in overbought territory and the MACD to measure the current price momentum. Moreover, it uses the 200-period EMA to filter the counter trend trades with the higher probability. The strategy opens only long trades.
Unique Features
Dynamic stop-loss system: Instead of fixed stop-loss level strategy utilizes average true range (ATR) multiplied by user given number subtracted from the position entry price as a dynamic stop loss level.
Configurable Trading Periods: Users can tailor the strategy to specific market windows, adapting to different market conditions.
Two layers trade filtering system: Strategy utilizes MACD and Stochastic indicators measure the current momentum and overbought condition and use 200-period EMA to filter trades against major trend.
Trailing take profit level: After reaching the trailing profit activation level script activates the trailing of long trade using EMA. More information in methodology.
Wide opportunities for strategy optimization: Flexible strategy settings allows users to optimize the strategy entries and exits for chosen trading pair and time frame.
Methodology
The strategy opens long trade when the following price met the conditions:
RSI is above 50 level.
MACD line shall be above the signal line
Both lines of Stochastic shall be not higher than 80 (overbought territory)
Candle’s low shall be above the 200 period EMA
When long trade is executed, strategy set the stop-loss level at the price ATR multiplied by user-given value below the entry price. This level is recalculated on every next candle close, adjusting to the current market volatility.
At the same time strategy set up the trailing stop validation level. When the price crosses the level equals entry price plus ATR multiplied by user-given value script starts to trail the price with trailing EMA(by default = 20 period). If price closes below EMA long trade is closed. When the trailing starts, script prints the label “Trailing Activated”.
Strategy settings
In the inputs window user can setup the following strategy settings:
ATR Stop Loss (by default = 1.75)
ATR Trailing Profit Activation Level (by default = 2.25)
MACD Fast Length (by default = 12, period of averaging fast MACD line)
MACD Fast Length (by default = 26, period of averaging slow MACD line)
MACD Signal Smoothing (by default = 9, period of smoothing MACD signal line)
Oscillator MA Type (by default = EMA, available options: SMA, EMA)
Signal Line MA Type (by default = EMA, available options: SMA, EMA)
RSI Length (by default = 14, period for RSI calculation)
Trailing EMA Length (by default = 20, period for EMA, which shall be broken close the trade after trailing profit activation)
Justification of Methodology
This trading strategy is designed to leverage a combination of technical indicators—Relative Strength Index (RSI), Moving Average Convergence Divergence (MACD), Stochastic Oscillator, and the 200-period Exponential Moving Average (EMA)—to determine optimal entry points for long trades. Additionally, the strategy uses the Average True Range (ATR) for dynamic risk management to adapt to varying market conditions. Let's look in details for which purpose each indicator is used for and why it is used in this combination.
Relative Strength Index (RSI) is a momentum indicator used in technical analysis to measure the speed and change of price movements in a financial market. It helps traders identify whether an asset is potentially overbought (overvalued) or oversold (undervalued), which can indicate a potential reversal or continuation of the current trend.
How RSI Works? RSI tracks the strength of recent price changes. It compares the average gains and losses over a specific period (usually 14 periods) to assess the momentum of an asset. Average gain is the average of all positive price changes over the chosen period. It reflects how much the price has typically increased during upward movements. Average loss is the average of all negative price changes over the same period. It reflects how much the price has typically decreased during downward movements.
RSI calculates these average gains and losses and compares them to create a value between 0 and 100. If the RSI value is above 70, the asset is generally considered overbought, meaning it might be due for a price correction or reversal downward. Conversely, if the RSI value is below 30, the asset is considered oversold, suggesting it could be poised for an upward reversal or recovery. RSI is a useful tool for traders to determine market conditions and make informed decisions about entering or exiting trades based on the perceived strength or weakness of an asset's price movements.
This strategy uses RSI as a short-term trend approximation. If RSI crosses over 50 it means that there is a high probability of short-term trend change from downtrend to uptrend. Therefore RSI above 50 is our first trend filter to look for a long position.
The MACD (Moving Average Convergence Divergence) is a popular momentum and trend-following indicator used in technical analysis. It helps traders identify changes in the strength, direction, momentum, and duration of a trend in an asset's price.
The MACD consists of three components:
MACD Line: This is the difference between a short-term Exponential Moving Average (EMA) and a long-term EMA, typically calculated as: MACD Line = 12 period EMA − 26 period EMA
Signal Line: This is a 9-period EMA of the MACD Line, which helps to identify buy or sell signals. When the MACD Line crosses above the Signal Line, it can be a bullish signal (suggesting a buy); when it crosses below, it can be a bearish signal (suggesting a sell).
Histogram: The histogram shows the difference between the MACD Line and the Signal Line, visually representing the momentum of the trend. Positive histogram values indicate increasing bullish momentum, while negative values indicate increasing bearish momentum.
This strategy uses MACD as a second short-term trend filter. When MACD line crossed over the signal line there is a high probability that uptrend has been started. Therefore MACD line above signal line is our additional short-term trend filter. In conjunction with RSI it decreases probability of following false trend change signals.
The Stochastic Indicator is a momentum oscillator that compares a security's closing price to its price range over a specific period. It's used to identify overbought and oversold conditions. The indicator ranges from 0 to 100, with readings above 80 indicating overbought conditions and readings below 20 indicating oversold conditions.
It consists of two lines:
%K: The main line, calculated using the formula (CurrentClose−LowestLow)/(HighestHigh−LowestLow)×100 . Highest and lowest price taken for 14 periods.
%D: A smoothed moving average of %K, often used as a signal line.
This strategy uses stochastic to define the overbought conditions. The logic here is the following: we want to avoid long trades in the overbought territory, because when indicator reaches it there is a high probability that the potential move is gonna be restricted.
The 200-period EMA is a widely recognized indicator for identifying the long-term trend direction. The strategy only trades in the direction of this primary trend to increase the probability of successful trades. For instance, when the price is above the 200 EMA, only long trades are considered, aligning with the overarching trend direction.
Therefore, strategy uses combination of RSI and MACD to increase the probability that price now is in short-term uptrend, Stochastic helps to avoid the trades in the overbought (>80) territory. To increase the probability of opening long trades in the direction of a main trend and avoid local bounces we use 200 period EMA.
ATR is used to adjust the strategy risk management to the current market volatility. If volatility is low, we don’t need the large stop loss to understand the there is a high probability that we made a mistake opening the trade. User can setup the settings ATR Stop Loss and ATR Trailing Profit Activation Level to realize his own risk to reward preferences, but the unique feature of a strategy is that after reaching trailing profit activation level strategy is trying to follow the trend until it is likely to be finished instead of using fixed risk management settings. It allows sometimes to be involved in the large movements.
Backtest Results
Operating window: Date range of backtests is 2023.01.01 - 2024.08.01. It is chosen to let the strategy to close all opened positions.
Commission and Slippage: Includes a standard Binance commission of 0.1% and accounts for possible slippage over 5 ticks.
Initial capital: 10000 USDT
Percent of capital used in every trade: 30%
Maximum Single Position Loss: -3.94%
Maximum Single Profit: +15.78%
Net Profit: +1359.21 USDT (+13.59%)
Total Trades: 111 (36.04% win rate)
Profit Factor: 1.413
Maximum Accumulated Loss: 625.02 USDT (-5.85%)
Average Profit per Trade: 12.25 USDT (+0.40%)
Average Trade Duration: 40 hours
These results are obtained with realistic parameters representing trading conditions observed at major exchanges such as Binance and with realistic trading portfolio usage parameters.
How to Use
Add the script to favorites for easy access.
Apply to the desired timeframe and chart (optimal performance observed on 2h BTC/USDT).
Configure settings using the dropdown choice list in the built-in menu.
Set up alerts to automate strategy positions through web hook with the text: {{strategy.order.alert_message}}
Disclaimer:
Educational and informational tool reflecting Skyrex commitment to informed trading. Past performance does not guarantee future results. Test strategies in a simulated environment before live implementation

Wick Strength [MS]Overview
The Wick Strength indicator is a unique script designed to measure and visualize the relative strength of candlestick wicks over time. By analyzing the relationship between upper and lower wicks, this indicator provides insights into potential market dynamics and price action patterns.
How It Works
The Wick Strength indicator calculates the "strength" of candlestick wicks by comparing the upward and downward movements within each candle's range. This calculation results in a dynamic line plot that represents the evolving wick strength across your chosen timeframe.
Strength is not range-bound, allowing the score to reach extremes and be compared relatively across time.
Interpretation
Positive values indicate stronger upper wicks (potential bearish pressure)
Negative values suggest stronger lower wicks (potential bullish pressure)
Extreme readings might signal overextended moves or potential reversals
Key Features
Measures relative wick strength candle by candle
Smooths the values by summation based on user preference
Adaptable to all timeframes and markets
Potential Applications
While extensive backtesting has not been performed, the Wick Strength indicator may offer valuable insights for:
Identifying potential divergences between price action and wick strength
Spotting changes in market sentiment or volatility
Complementing other technical analysis tools for a more comprehensive trading approach
Developing unique trading strategies based on wick behavior
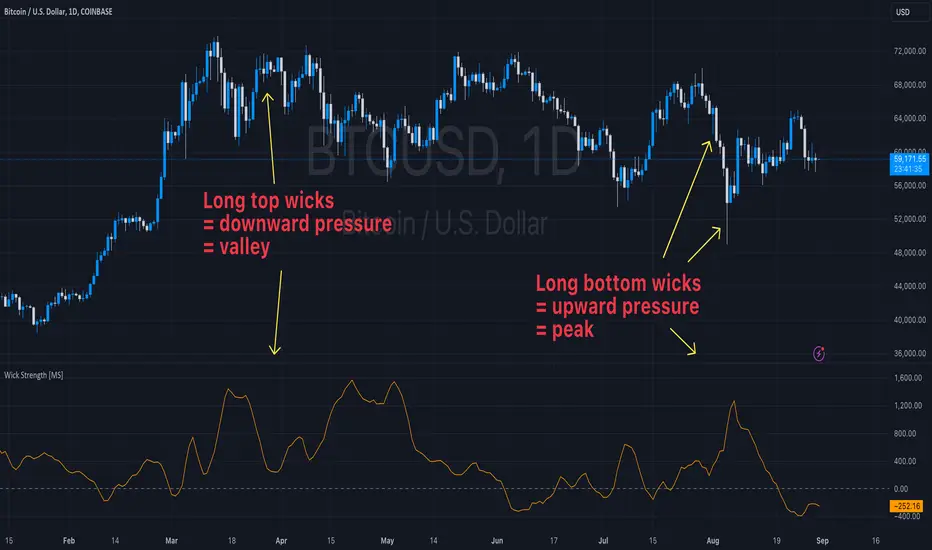
Multi-Length RSI **Multi-Length RSI Indicator**
This script creates a custom Relative Strength Index (RSI) indicator with the ability to plot three different RSI lengths on the same chart, allowing traders to analyze momentum across various timeframes simultaneously. The script also includes features to enhance visual clarity and usability.
**Key Features:**
1. **Customizable RSI Lengths:**
- The script allows you to input and customize three different RSI lengths (7, 14, and 28 by default) via user inputs. This flexibility enables you to track short-term, medium-term, and long-term momentum in the market.
2. **Dynamic Colour Coding:**
- The RSI lines are color-coded based on their current value:
- **Above 70 (Overbought)**: The line turns red.
- **Below 30 (Oversold)**: The line turns green.
- **Between 30 and 70**: The line retains its user-defined colour (blue, yellow, orange by default).
- This dynamic colouring helps to quickly identify overbought and oversold conditions.
3. **Adjustable Line Widths and Colours:**
- Users can customize the colour and thickness of each RSI line, allowing for a personalized visual experience that fits different trading strategies.
4. **Overbought, Oversold, and Midline Levels:**
- The script includes static horizontal lines at the 70 (Overbought) and 30 (Oversold) levels, with a red and green colour, respectively.
- A midline at the 50 level is also included in gray and dashed, helping to visualize the neutral zone.
5. **Dynamic RSI Value Labels:**
- The current values of each RSI line are displayed directly on the chart as labels at the most recent bar, with colours matching their corresponding lines. This feature provides an immediate reference to the exact RSI values without the need to hover or look at the data window.
6. **Alerts for Crosses:**
- The script includes built-in alert conditions for when any of the RSI values cross above the overbought level (70) or below the oversold level (30). These alerts can be configured to notify you in real-time when significant momentum shifts occur.
**How to Use:**
1. **Customization**:
- Input your preferred RSI lengths, colours, and line widths through the script’s settings menu.
2. **Visual Analysis**:
- The indicator plots all three RSI values on a separate pane below the price chart. Use the color-coded lines and levels to quickly identify overbought, oversold, and neutral conditions across multiple timeframes.
3. **Set Alerts**:
- You can configure alerts based on the built-in alert conditions to get notified when the RSI crosses critical levels.
**Ideal For:**
- **Traders looking to analyze momentum across multiple timeframes**: The ability to view short-term, medium-term, and long-term RSIs simultaneously offers a comprehensive view of market strength.
- **Those who prefer visual clarity**: The dynamic colouring, clear labels, and customizable settings make it easy to interpret RSI data at a glance.
- **Traders who rely on alerts**: The built-in alert system allows for proactive trading based on significant RSI level crossings.
---
This script is a powerful tool for any trader looking to leverage RSI analysis across multiple timeframes, offering both customization and clarity in a single indicator.