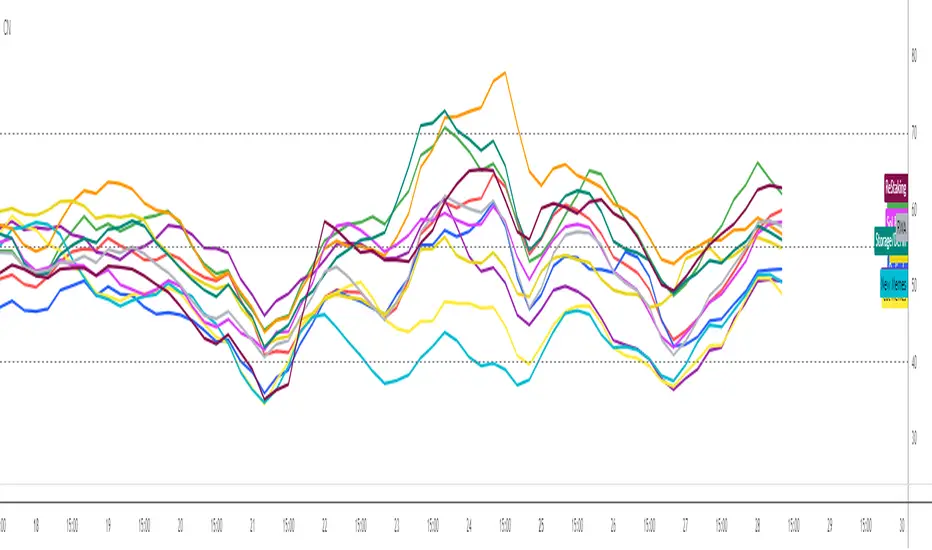
Crypto Narratives: Relative StrengthThis indicator offers a unique perspective on the crypto market by focusing on the relative strength of different narratives. It aggregates RSI data from multiple tokens associated with each narrative, providing a comprehensive view of the sentiment and momentum behind these themes. You can use it to take profit, find W bottoms or M tops to enter and exit narratives. and generally see what hot at the moment with lots of pretty colours.
This indicator tracks the relative strength of various crypto narratives using the Relative Strength Index (RSI) of representative tokens. It allows users to gauge the momentum and sentiment behind different themes in the cryptocurrency market.
Functionality:
The indicator calculates the average RSI values for the current leading tokens associated with ten different crypto narratives:
- AI (Artificial Intelligence)
- Ordinals
- DeFi (Decentralized Finance)
- Memes
- Gaming
- Level 1 (Layer 1 Protocols)
- Sol Betas (Solana Ecosystem)
- Storage/DePin
- RWA (Real-World Assets)
- ReStaking
he average RSI values for each narrative are calculated by summing the RSI values of the associated tokens and dividing by the number of tokens. The indicator plots the 3-period simple moving average (SMA) of each narrative's RSI using different colors and line styles.
Users can customize the RSI length, line width, and label offset through the input options. If the "Show Labels" option is enabled, the indicator displays labels for each narrative's RSI value on the most recent bar.
The indicator also includes horizontal lines representing overbought and oversold levels, which can be adjusted through the input options. Alerts are triggered when a narrative's RSI crosses above the overbought level or below the oversold level. The alerts include the narrative name, RSI value, and a suggestion to consider selling or buying.
Cerca negli script per "relative strength"
Kshitij Malve - Relative Strength CustomPurpose: This indicator attempts to gauge the relative strength of a stock compared to a broader index (like the Nifty 50) and provide actionable buy, sell, or hold signals. It is designed to be used for shorter-term, intraday trading.
Key Features
Signal Focus: Generates color-coded visual cues to aid in decision-making:
Green: Indicates a potential buy signal
Red: Indicates a potential sell signal
Blue: Suggests maintaining the current position
Trend and Volatility: Combines:
The SuperTrend indicator to determine the underlying price trend (uptrend vs. downtrend).
Average True Range (ATR) to assess recent market volatility.
Strength Check: Incorporates the Relative Strength Index (RSI) to measure if the stock is overbought or oversold relative to the broader index.
Logic: (Note: This description assumes the logic you implemented – adapt if your conditions differ)
The indicator's core logic suggests:
Buy Signal: RSI oversold, market in an uptrend, increased volatility, and price above a short-term moving average.
Sell Signal: RSI overbought, market in a downtrend, increased volatility, and price below a short-term moving average.
How to Use
Add the indicator to a chart of the stock you want to analyze. It will appear in a separate pane below the price chart.
Customize input settings if desired (lengths of RSI, SuperTrend, etc.). Consider aligning these with your timeframe and the characteristics of the specific stock and index.
Observation: Look for green (buy), red (sell), and blue (hold) signals.
Important Notes
Confirmation Tool: This indicator works best in conjunction with other forms of technical and fundamental analysis for a comprehensive trading strategy.
Market-Specific: The underlying logic may need to be tailored further for specific stock and index combinations to provide the most reliable signals.
Disclaimer: Financial markets are risky. Thoroughly backtest and understand the risk profile of any strategy relying on this indicator before using real capital.

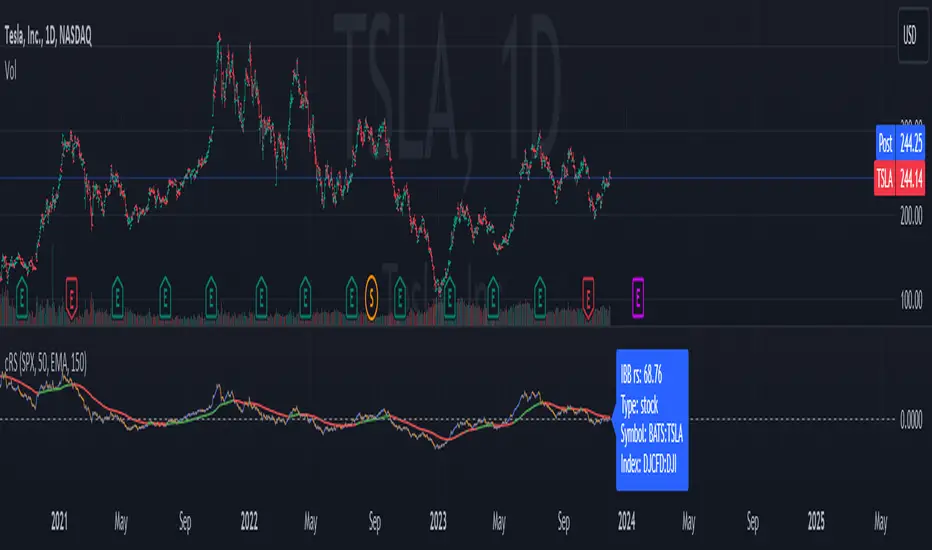
Anchored Relative StrengthThe Anchored Relative Strength (RS) Indicator is a tool designed for traders to compare the performance of a selected stock or security against a benchmark index or another security starting from a specific point in time.
Traditional Relative Strength
The traditional RS line is a popular tool used to compare the performance of a stock, typically calculated as the ratio of the stock's price to a benchmark index's price. It helps identify outperformers and underperformers relative to the market or a specific sector.
The Anchored Approach
The Anchored RS line enhances the traditional concept of the RS line by introducing an anchored approach, where calculations begin from a user-defined date. This feature provides the flexibility to start the comparison from a specific historical event, earnings, market peak, trough, or any date significant to the trader's analysis.
Calculating Relative Strength
The RS value is calculated by dividing the close price of the chosen stock by the close price of the comparative symbol (SPX by default). This calculation is performed for each bar since the Anchor Date.
Indicator Features
🔶Custom Start Date
🔶Custom Comparison Symbol
🔶RS Line Moving Average
🔶Comparison Symbol Line
🔶Customize Colors & Appearance
Users can change the anchor date simply by clicking on the indicator and dragging the anchor point.

Inverted Relative Strength IndexUnfortunately when using the cmd + I to invert the chart, won't have the same effect on the RSI indicator. The Inverted Relative Strength Index will have the inverted RSI showing in the same direction as the chart that was inverted using the available command in TradingView. Keep in mind that when flipping the chart back to the original direction, the Inverted Relative Strength Index won't flip with it, so you'll need to go back to the regular Relative Strength Index.

Reverse Double Smoothed Relative Strength Index Bands[CC]The Reverse Double Smoothed Relative Strength Index Bands is a custom script of mine that is another part of my RSI indicator series, which I will be publishing over the next week or so. This takes my Double Smoothed Relative Strength Index script and applies the Reverse RSI formula to create a new Bollinger Bands type indicator. This concept can work for almost any oscillator with some slight tweaking. I have a reverse RSI being calculated for each major RSI level to give you an approximation of what the price would look like if that RSI level was hit. Feel free to tweak the RSI levels of course. I will publish more Reverse indicators since that doesn't seem to be a topic that is touched on very frequently. I have color coded the indicator to show darker colors when it is a strong signal and lighter colors for normal signals. Buy when the lines turn green and sell when they turn red.
This was a custom request from @kerpiciwuasile so let me know if you want to see me publish another custom script!

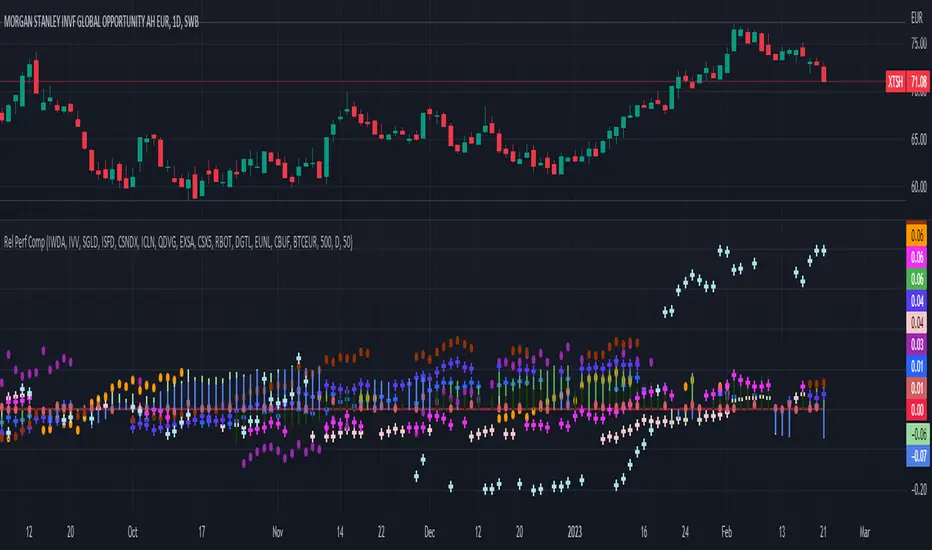
Relative Performance Comparison among different sectorsThis script shows how money is moving among different sectors using relative-strength of the corresponding sector-specific largest ETFs against MSCI World. Trend and current value of Relative-strength can be used to determine the sector in which you should make your investment at this point, considering the movement in markets.
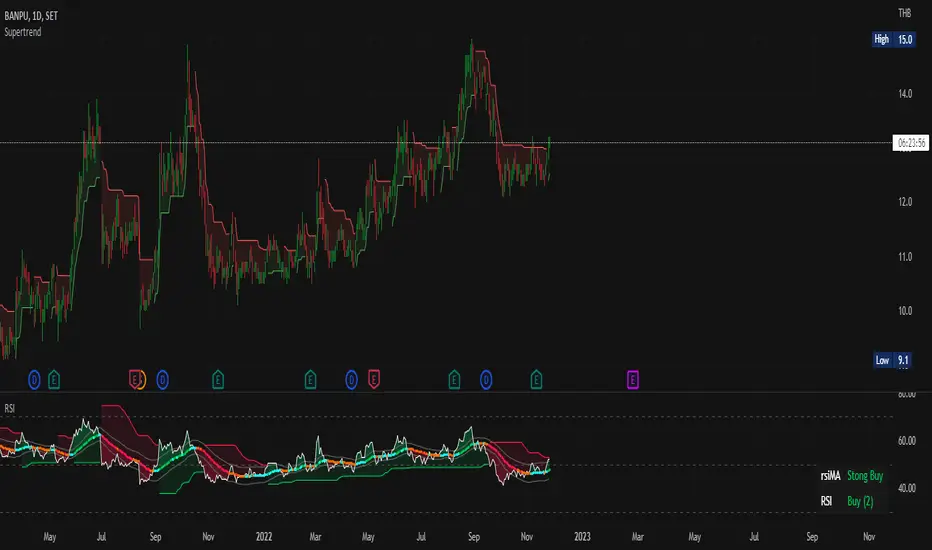
Modified Color Relative Strength IndexThis indicator is old normal RSI, but I have Modified its Color, to make trade able to investigate the trend easier
This indicator uses the concept of:
- RSI Relative Strength Index
- and Many Different MA (For example EMA SMA RMA LSMA WMA etc.)
There are 2 line displays in this indicator
1) Normal RSI line, Default is set as White color
2) MA line which calculates from RSI, a trader can choose the model to calculate RSIMA in setting
How Modified Color Relative Strength Index work?
We use RSI as we normally use, but the RSIMA is a little different in this Indicator
I use the idea that if RSI is over RSIMA, the Trend seems to be Uptrend which will display as a Green color filled. Same as if RSI is lower than RSI MA that trend seems to be a Down Trend.
With this idea, we can identify the trend of the chart but we still don't know whether the trend is strong or not, to satisfy this problem the change rate of RSIMA came into its role.
Now let me reviewing you some of my 5-grade math ideas:
Remember how to calculate the Average value? that's right we sum all of the values and divide it all by the amount of the number
for example, we want to calculate the average value of 1 2 3 4 5 so it should be (1+2+3+4+5)/5 which is the amount of number and then we get the average value of 1 2 3 4 5 = 3
now apply that concept to the change in RSIMA value
There will be 3 stages of the color displayed in RSIMA
1) Green will be displayed if the rate of change or RSIMA is over X time average rate of change of this RSIMA while trader and change X in the setting (Positive value)
2) Red will be displayed if the rate of change or RSIMA is over X time average rate of change of this RSIMA while trader and change X in the setting (Negative value)
3) Light Blue and Orange (Gray) will be displayed if the rate of change or RSIMA is not over X time average rate of change of this RSIMA while trader and change X in the setting if the recently is red the RSIMA line will be orange while it is green, RSIMA will be color in Light Blue
Green and Red can be a help to confirm, how strong the trend is. While Light blue and Orange mean there is a small amount of change so traders should be prepared to Buy/Sell
Use of Modified Color Relative Strength Index
When the area between RSI and RSIMA is Green and RSIMA is colored in Green, That is a Strong Uptrend
Same a Strong Down Trend, area between RSI and RSIMA need to be RED and RSIMA colored in red too,
other than this is considered as a sideway Trend or weak Trend
Apply RSI with other Indicator
- You can use any indicator that can help you enter the trade easier with it
- I personally use it with MACD, BB Band, and UT Bot Alerts
Dynamic Relative StrengthMainly this indicator is a Relative strength indicator which tells us about the strength of a scrip as compared to an index . That is it outperforming the index or underperforming . Outperformance signifies Strength and Under performance signifies Weakness .Inspired from Bharat trader's Relative Strength of a stock , but changing the period for all time frames is a hassle so i have set 10 period for Monthly and 52 period for Weekly. As for monthly we need around 10 months data or we can use 12 as 1 year has 12 months but 10 works best . used 52 period for Weekly time frame because there are 52 weeks in a year. These values are by default dynamically applied to the indicator when weekly or monthly timeframes are chosen . Daily Period can be chosen as per anyone's need . As can be seen in provided screenshot , that the stock has recently started gaining strength on weekly a compared to Small cap100 index . So we can conclude that it has more strength than the overall index it is representing so more chances of outperformance will be there.

Ehlers Adaptive Relative Strength Index (RSI) [Loxx]Ehlers Adaptive Relative Strength Index (RSI) is an implementation of RSI using Ehlers Autocorrelation Periodogram Algorithm to derive the length input for RSI. Other implementations of Ehers Adaptive RSI rely on the inferior Hilbert Transformer derive the dominant cycle.
In his book "Cycle Analytics for Traders Advanced Technical Trading Concepts", John F. Ehlers describes an implementation for Adaptive Relative Strength Index in order to solve for varying length inputs into the classic RSI equation.
What is an adaptive cycle, and what is the Autocorrelation Periodogram Algorithm?
From his Ehlers' book mentioned above, page 135:
"Adaptive filters can have several different meanings. For example, Perry Kaufman’s adaptive moving average (KAMA) and Tushar Chande’s variable index dynamic average (VIDYA) adapt to changes in volatility. By definition, these filters are reactive to price changes, and therefore they close the barn door after the horse is gone.The adaptive filters discussed in this chapter are the familiar Stochastic, relative strength index (RSI), commodity channel index (CCI), and band-pass filter.The key parameter in each case is the look-back period used to calculate the indicator.This look-back period is commonly a fixed value. However, since the measured cycle period is changing, as we have seen in previous chapters, it makes sense to adapt these indicators to the measured cycle period. When tradable market cycles are observed, they tend to persist for a short while.Therefore, by tuning the indicators to the measure cycle period they are optimized for current conditions and can even have predictive characteristics.
The dominant cycle period is measured using the autocorrelation periodogram algorithm. That dominant cycle dynamically sets the look-back period for the indicators. I employ my own streamlined computation for the indicators that provide smoother and easier to interpret outputs than traditional methods. Further, the indicator codes have been modified to remove the effects of spectral dilation.This basically creates a whole new set of indicators for your trading arsenal."
What is Adaptive RSI?
From his Ehlers' book mentioned above, page 137:
"The adaptive RSI starts with the computation of the dominant cycle using the autocorrelation periodogram approach. Since the objective is to use only those frequency components passed by the roofing filter, the variable "filt" is used as a data input rather than closing prices. Rather than independently taking the averages of the numerator and denominator, I chose to perform smoothing on the ratio using the SuperSmoother filter. The coefficients for the SuperSmoother filters have previously been computed in the dominant cycle measurement part of the code."
Happy trading!

Esqvair's Relative Strength IndexThe Indicator
Esqvair's Relative Strength Index is the another modification of very popular Relative Strength Index by J. Welles Wilder
The Modification
This version uses de-lagged price as source, de-lagging price improves performance of the indicator.
How to use
The ways of usage are same as original Relative Strength Index that means you can use it as overbought and oversold indicator or as divergence indicator.

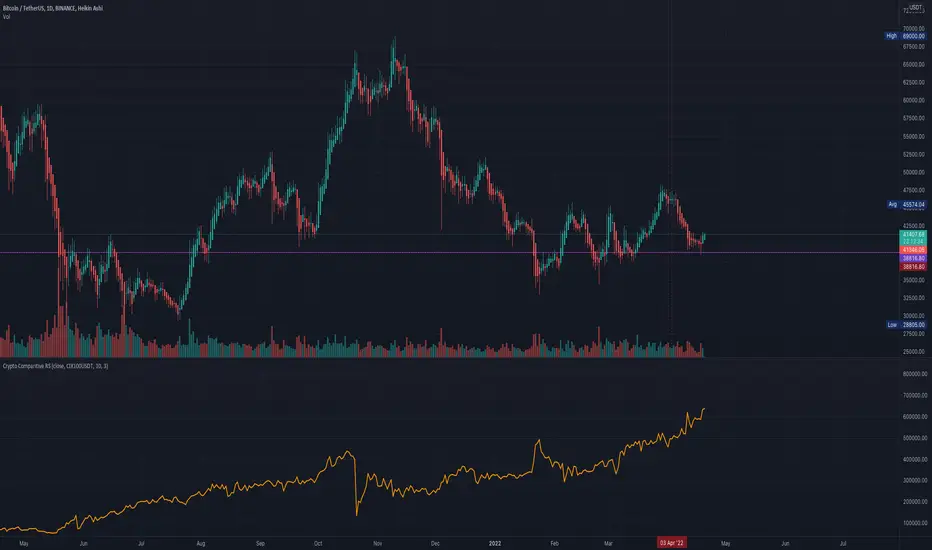
Comparative Relative Strength for Crypto (USDT/USD)Comparative Relative Strength for Crypto (USDT/USD)
An adaption of the indicator as published by © bharatTrader->
Please visit the link for details as published by the original coder.
Configured for Crypto by presetting (per filter) for CIX100 usage - either in USDT (Kucoin) or USD (Capitolcom)
R-Smart - Relative Strength On observing the market for years I learned that Relative Strength will help us in staying invested in strong bullish stocks (relative to primary indices of your country, in my case it's Nifty 50 for India). Once you identify a strong stock, it's important to know if the stock is trending and is in momentum. To identify, trends and momentum, I used ADX and MACD indicators respectively as part of the R-Smart.
In R-Smart, I used Relative Strength primarily to plot the chart, if the Histogram is positive (greater than 0) then the security is bullish. But then how do we know that it's in trend and having momentum. Well the below color code will help you identify them
1. Histogram in Green : Strong Bullish
2. Histogram in Blue : Weak Bullish
3. Histogram in Orange: Bearish
Apart from the above indicator, I would like to use Super Trend to know the immediate support/resistances on the chart.
# StayInvested
# StayProfitable
# ManageYourRisk

Jigga - Relative Strength - SectorsHi All !!
I came across relative strength concept from below indicator.
Indicator Name: (Relative-Strength by modhelius)
Note: Sorry !! Could not add indicator url here.
Formula:
RelativeStrength = (sectorValue / sectorValue ) / (indexValue / indexValue ) - 1 * 100
I used same concept and combine all sector's relative strength against Nifty50 index.
How to use:
You can change length based on your convenience and show/hide sectors.
Indicator will show strength line for that sector.
you can use this to identify momentum stocks.

RSI - Relative Strength Index Triple - TradingEDThis case study is based on a previous RSI study, but with three different counts to compare different trends. The use of this indicator is restricted to private use, and it can be used only by invitation. Different functionalities have been added to the original code, such as alerts and signals that seek to make trading much easier to interpret by any type of trading operator of any experience level, from beginner to intermediate and advanced.
Key components of the original indicator:
● The Relative Strength Index (RSI) is a popular momentum oscillator developed in 1978.
● The RSI provides technical traders signals about bullish and bearish price momentum, and it is often plotted beneath the graph of an asset's price.
● An asset is usually considered overbought when the RSI is above 70% and oversold when it is below 30%.
It is a momentum indicator used in technical analysis that measures the magnitude of recent price changes to assess overbought or oversold conditions in the price of an asset. The RSI is displayed as an oscillator (a line chart moving between two extremes) and can read from 0 to 100. Overbought does not necessarily mean that the price will reverse lower, just as oversold does not mean that the price will reverse higher. Rather, the overbought and oversold conditions simply alert traders that the RSI is near the extremes of its recent readings.
Main functions of this modified indicator:
1) The SOURCE for the counts can be determined by the trader (close, open, etc).
2) You can select the type of MOVING AVERAGE , among many available options ( SMA , EMA , DEMA , HMA , etc.)
3) The MEASURE can be based on a CANDLES count if you are trading OHLC Charts from 1D onwards , or if your trading is intraday, you can also select counts by MINUTES, HOURS or DAYS , depending on your trading style.
4) LENGTH , by default it will be loaded as in the STRATEGY , but considering the previous point, you can modify it according to your convenience.
5) You have the option to hide or show a LABEL at the top of the chart, with respect to the signals: BULLISH green, BEARISH red.
Main performance functions of this modified indicator:
I) In the case of the PERFORMANCE that appears at the right of the chart, you have the option to adjust the WIDTH of each box.
II) The TEXT of the PERFORMANCE is not modifiable, but you can customize the default color. *
III) The BACKGROUND of the PERFORMANCE , you can customize the default color. *
IV) You have the option to hide or show a PERFORMANCE that appears at the right of the chart.
Main functions to customize the style of this indicator:
a) You can select the color for the ADJUSTED LEVEL and for the MOVING AVERAGE , with the colors that best suit you.
b) The CROSSOVER/CROSSUNDER signal between the MOVING AVERAGE and the ADJUSTED LEVEL can also be customized. *
c) For any type of SIGNAL , it is painted as a VERTICAL LINE in the graph, you can change the color that comes by default. *
d) In the case of the LABEL that appear at the top, the text is not modifiable, but you can customize both the type of label and change the default color. *
e) You can select the color for OVERVALUED and for UNDERVALUED levels, with the colors that best suit you.
f) You can select the colors for the BACKGROUND of the indicator according to the trend, whether it is BEARISH or BULLISH , with the colors that best suit you. *
* By default, they are marked as red for downtrends and green for uptrends.

Sector/Market Relative StrengthSector/Market Relative Strength Indicator (SMRS) shows in one layout the relative strength of an asset against it's Sector and Market.
By default smoothed by EMA, however EMA can be disabled to see spot on strength with 'Relative Strength steps back' set to 1.
This indicator is at experimental stage and might be updated soon.
Green column: Base asset is stronger than market/sector.
Red Column: Base asset is weaker than than market/sector.
Bottom line (squares): Green- Sector is stronger than market. Red- Sector is weaker than market. Affected only by Sector and Market symbols that are defined in indicator settings!
Notes
-------
* Useful only with securities (not forex, cryptocurrencies,etc..)
* Market and sectors needs to be defined in indicator settings.
For any suggestion/comment write me.

Adaptive Relative StrengthAdaptive Relative Strength shows a line of relative strength with a moving period in relative to Nifty 500 for Indian Market,
by default its 45 days but you can change as per your need or change relative symbol as per your need.

Orti Relative Strength Index (Static Timeframe Multi-Period)The " Orti Relative Strength Index (Static Timeframe Multi-Period) ” is now a public script, based into an existing study named "Relative Strength Index or RSI", but with some better functions about time frame and its measurament.
The cherry on the top, for this private version: is when you want to get a predetermined count in a natural “units of time" as minutes, hours or days, in any graph you could get a static average, and this count will be automatically respected. For example, an average could be configurated to know a trend per day, week or month... or whatever comes to mind, and at every single chart that you move through (5m, 15m, 1h, 4h, etc), you will see the same average to make your own "trend analysis" into a micro/macro market view.
The Relative Strength Index is a Momentum Indicator that measures the magnitude of recent price changes to evaluate overbought or oversold conditions in the price of a stock or other asset. The RSI is displayed as an oscillator (a line graph that moves between two extremes) and can have a reading from 0 to 100.
The average gain or loss used in the calculation is the average percentage gain or losses during a lookback period. Traditional interpretation and usage of the RSI is that values of 70 or above indicate that a security is becoming overbought or overvalued and may be primed for a trend reversal or corrective pullback in price. An RSI reading of 30 or below indicates an oversold or undervalued condition.
For more technical information look at Investopedia .
Note: The previous calculation example is not the default, the parameters can be adjusted according to the criteria of the merchant.

BOSS Relative Strength MeterTHE BEST FOREX, STOCKS, COMMODITIES , AND CRYPTO INDICATORS FOR TRADINGVIEW.COM
The relative strength meter (RSM) is a momentum indicator that measures the magnitude of recent price changes to evaluate overbought or oversold conditions in the price of a stock or other asset.
The RSM is displayed as a color coded meter.
GREEN: Bullish Uptrend
RED: Bearish Downtrend
YELLOW: Disbursement
Highlights:
Add to any chart or time frame
Prints on the current bar in real time
DOES NOT repaint several bars after the fact
Freedom to Tune
User can change colors
Available Here: bosscripts.com
7_Day Trial: bosscripts.com

Weighted Relative Strength Index [SeerQuant]Weighted Relative Strength Index (WRSI)
The Weighted Relative Strength Index (WRSI) is an advanced momentum oscillator that enhances the traditional RSI by incorporating customizable weighting methods and moving average smoothing. With dynamic threshold logic, color-coded visuals, and optional candle coloring, the WRSI provides traders with a versatile tool for identifying trends, overbought/oversold conditions, and momentum shifts.
⚙️ How It Works
1. Weighted Momentum Calculation
The indicator calculates price changes (delta) and applies a user-defined weighting method (e.g., Volume, Momentum, Volatility, or Reversion Factor) to emphasize specific market dynamics.
2. Custom Moving Average Integration
Weighted upward and downward price movements are smoothed using a selectable moving average type (e.g., SMA, EMA, TEMA, etc.), producing a weighted RSI that blends momentum and trend data.
3. Smoothed RSI Output
An additional moving average is applied to the weighted RSI for a smoothed version, offering a clearer view of momentum trends.
4. Threshold Logic
Bullish (Uptrend): WRSI exceeds the upper neutral zone boundary (50 + Neutral Zone).
Bearish (Downtrend): WRSI falls below the lower neutral zone boundary (50 - Neutral Zone).
Neutral: WRSI remains within the neutral zone.
Extreme overbought (90+) and oversold (20-) levels are marked with X’s for quick identification.
5. Dynamic Visual Representation
A color-coded line reflects the WRSI, adjusting hues based on trend direction.
Gradient fills highlight overbought/oversold zones and neutral areas.
Optional candle coloring ties price action to WRSI or smoothed RSI values.
A histogram-style fill between the WRSI and midline enhances trend strength visibility.
✨ Customizable Settings
Calculation Settings:
Calculation Source: Select the price source (default: close).
Calculation Length: Set the lookback period for RSI calculation (default: 14).
Moving Average Type: Choose from SMA, EMA, RMA, WMA, VWMA, LSMA, HMA, ALMA, DEMA, or TEMA (default: RMA).
Moving Average Length: Adjust the smoothing period for the weighted RSI (default: 8).
Neutral Zone Range: Define the width of the neutral zone around the midline (default: 5).
RSI Weighting Method:
Volume: Weights by trading volume.
Momentum: Weights by absolute price momentum.
Volatility: Weights by standard deviation.
Reversion Factor: Weights inversely to variance for mean-reversion emphasis (default: Momentum).
Style Settings:
Colour Choice: Pick from predefined schemes: Default, Modern, Cool, or Monochrome (default: Default).
Use Custom Colors?: Toggle to use custom bull, bear, and neutral colors (default: false).
Bull/Bear/Neutral Colors: Set custom colors when enabled (default: green/red/gray).
Candle Color Mode: Color candles based on WRSI or smoothed RSI (default: RSI).
Color Candles?: Enable/disable candle coloring (default: false).
🚀 Features and Benefits
Weighted Momentum Analysis: Enhances RSI with dynamic weighting for deeper market insights.
Flexible Smoothing: Multiple MA types and adjustable lengths adapt to various trading styles.
Visual Intuition: Color-coded outputs, gradient fills, and optional candle coloring simplify trend analysis.
Customizable Thresholds: Neutral zone and extreme levels cater to individual strategies.
Overbought/Oversold Signals: Clear markers for extreme conditions improve decision-making.
📜 Disclaimer
This indicator is for educational purposes only and does not constitute financial advice. Past performance does not guarantee future results. Always consult a licensed financial advisor before making trading decisions. Use at your own risk.

Levy Flight Relative Strength Index [SeerQuant]Lévy Flight Relative Strength Index
A nuanced improvement on the classic RSI, the Lévy Flight RSI leverages the Lévy Flight model to calculate dynamic weighted gains and losses, offering improved responsiveness and smoothness in trend detection compared to the regular RSI. Ideal for traders seeking a balance between precision and adaptability, the Lévy Flight RSI is packed with customizable features and a sleek, modern aesthetic.
-----------------------------------------------------------------
🧠 What is Lévy Flight Modelling?
Lévy Flight modelling is a concept derived from probability theory and fractal mathematics, widely applied in fields such as finance and physics. In trading, Lévy Flights describe a random walk process characterized by small, frequent movements interspersed with larger, less frequent movements. This behaviour reflects real-world price dynamics, where markets often exhibit periods of relative calm followed by sharp, volatile movements. The Lévy Flight model introduces a weighting mechanism that amplifies extreme price changes while smoothing smaller ones, providing a more nuanced view of market trends.
In the context of the Lévy Flight RSI, this model enhances traditional RSI calculations by dynamically weighting price changes (gains and losses) based on their magnitude. This results in an RSI that is more responsive to significant price movements, making it ideal for detecting shifts in momentum and market direction.
-----------------------------------------------------------------
🌟 Key Features:
- Dynamic Lévy Flight Modelling: Adjust alpha (1 to 2) for responsive or smooth signals, making it perfect for varying market conditions.
- Custom RSI Smoothing: Choose from multiple moving average types, including TEMA, DEMA, HMA, ALMA, and more, to match your trading style.
- Visually Intuitive: Neon-inspired gradient colours and centered histogram provide instant insights into market conditions.
- Customizable Overbought/Oversold Levels: Clearly defined thresholds, with additional shaded regions for strength identification.
-----------------------------------------------------------------
⚙️ How the Code Works
The Lévy Flight RSI enhances the traditional RSI calculation by incorporating two primary elements:
Dynamic Weighting Using Lévy Flight:
The code calculates the price change (change) on each bar and applies a power function (alpha) to these changes. Gains are raised to the power of alpha (for positive price changes), and losses are similarly transformed (for negative price changes).
The parameter alpha (ranging from 1 to 2) determines the sensitivity of the weighting. Lower values emphasize responsiveness, while higher values smooth out signals.
Enhanced Moving Averages:
The weighted gains and losses are smoothed using a customizable moving average. Options include traditional averages like SMA and EMA, and more advanced ones like TEMA, HMA, and ALMA. These smoothed values are used to calculate the final RSI value.
-----------------------------------------------------------------
📈 Why Use Lévy Flight RSI?
This unique RSI indicator captures price momentum with enhanced sensitivity to market dynamics. Whether you’re trend-following, scalping, or identifying reversals, the Lévy Flight RSI provides robust insights to refine your trading decisions.
-----------------------------------------------------------------
🔧 Inputs:
RSI Settings: Control RSI length, calculation source, and smoothing type.
Lévy Flight Settings: Adjust alpha to tune the indicator's responsiveness.
Style Customization: Tailor the appearance with different colour themes and gradients.
-----------------------------------------------------------------

Multi Timeframe Relative Strength Index {DCAquant}Overview
The Multi Timeframe Relative Strength Index (MTF RSI) is a powerful technical analysis tool designed to provide insights into market momentum and potential trend reversals across multiple timeframes. Leveraging the Relative Strength Index (RSI) formula, this indicator offers traders a comprehensive view of market sentiment and identifies overbought and oversold conditions.
Key Features
RSI Calculation:
Utilizes the standard RSI calculation formula to measure the magnitude of recent price changes and assess the strength of market trends.
Employs a user-defined length parameter to customize the sensitivity of the RSI calculation based on trading preferences.
Multiple Timeframe Analysis:
Allows traders to analyze RSI values across up to six different timeframes, ranging from minutes to days, providing a holistic perspective on market dynamics.
Calculates RSI values independently for each selected timeframe, enabling comparison and trend identification.
Threshold Levels:
Defines overbought and oversold levels to highlight potential reversal points in market trends.
Offers flexibility in adjusting threshold levels based on individual risk tolerance and trading strategies.
Neutral Zone:
Establishes upper and lower neutral thresholds to identify periods of consolidation or sideways movement in price.
Helps traders distinguish between trending and ranging market conditions for more accurate analysis.
Moving Average Smoothing:
Provides the option to apply moving average smoothing to aggregated RSI values for enhanced clarity and reduced noise.
Enables smoother visualization of RSI trends, facilitating easier interpretation for traders.
Visual Representation:
Plots the aggregated MTF RSI values on the price chart, allowing traders to visually assess market momentum and potential reversal points.
Utilizes color-coded backgrounds to indicate Long, Short, or Neutral conditions for quick identification.
Dynamic Table Display:
Displays trading signals alongside graphical indicators (rocket for Long, snowflake for Short, and star for Neutral) in a customizable table format.
Offers flexibility in table placement and size to accommodate user preferences.
How to Use:
Parameter Configuration:
Adjust the length parameter to fine-tune the sensitivity of the RSI calculation based on the desired timeframe and trading strategy.
Define overbought and oversold levels to identify potential reversal points in market trends.
Customize upper and lower neutral thresholds to differentiate between trending and ranging market conditions.
Interpretation:
Monitor the aggregated MTF RSI values plotted on the price chart for signals of overbought or oversold conditions.
Pay attention to color-coded backgrounds and graphical indicators in the table for actionable trading insights.
Trading Strategy:
Consider entering Long positions when the aggregated MTF RSI is above the upper neutral threshold, indicating potential bullish momentum.
Evaluate Short opportunities when the aggregated MTF RSI falls below the lower neutral threshold, signaling possible bearish momentum.
Exercise caution during Neutral conditions, as there may be uncertainty in market direction.
Risk Management:
Combine MTF RSI analysis with robust risk management strategies, including stop-loss and take-profit levels, to manage trading risks effectively.
Practice prudent risk management and trade within your risk tolerance to minimize potential losses.
Disclaimer
Trading in financial markets involves risk, and past performance is not indicative of future results. The use of the MTF RSI indicator does not guarantee profits or prevent losses. Traders should conduct their own analysis, exercise caution, and seek advice from qualified financial professionals before making trading decisions.

Supertrended RSI [AlgoAlpha]🚀📈 Introducing the Supertrended RSI Indicator by AlgoAlpha!
Designed to empower your trading decisions, this innovative Pine Script™ creation marries the precision of the Relative Strength Index (RSI) with the dynamic prowess of the SuperTrend methodology. Whether you’re charting the course of cryptos, riding the waves of stock markets, or navigating the futures landscape, our SuperTrended RSI Indicator is your go-to tool for uncovering unique trend insights and crafting trading strategies. 🌟
Key Features:
🔍 Enhanced RSI Analysis: Combines the traditional RSI with a supertrend calculation for a dynamic look at market trends.
🔄 Multiple Moving Averages: Offers a selection of moving averages including SMA, HMA, EMA, and more for tailored analysis.
🎨 Customizable Visuals: Choose your own color scheme for uptrends and downtrends to match your trading dashboard.
📊 Flexible Input Settings: Tailor the indicator with customizable lengths, factors, and smoothing options.
⚡ Real-Time Alerts: Set alerts for bullish and bearish reversals to stay ahead of market movements.
Quick Guide to Using the Supertrended RSI Indicator
Maximize your trading with the Supertrended RSI by following these streamlined steps! 🚀✨
🛠 Add the Indicator: Search for "Supertrended RSI " in TradingView's Indicators & Strategies. Customize settings like RSI length, MA type, and Supertrend factors to fit your trading style.
🎨 Visual Customization: Adjust uptrend and downtrend colors for clear trend visualization.
📊 Market Analysis: Watch for the Supertrend color change for trend reversals. Use the 70 and 30 lines to spot overbought/oversold conditions.
🔔 Alerts: Enable notifications for reversal conditions to capture trading opportunities without constant chart monitoring.
How It Works:
At the core of this indicator is the combination of the Relative Strength Index (RSI) and the Supertrend framework, it does so by applying the SuperTrend on the RSI. The RSI settings can be adjusted for length and smoothing, with the option to select the data source. The Supertrend calculation takes into account a specified trend factor and the Average True Range (ATR) over a given period to determine trend direction.
Visual elements include plotting the RSI, its moving average, and the Supertrend line, with customizable colors for clarity. Overbought and oversold conditions are highlighted, and trend changes are filled with distinct colors.
🔔 Alerts: Enable alerts for crossover and crossunder events to catch every trading opportunity.
🌈 Whether you're a seasoned trader or just starting, the Supertrended RSI offers a fresh perspective on market trends. 📈
💡 Tip: Experiment with different settings to find the perfect balance for your trading style!
🔗 Explore, customize, and enhance your trading experience with the Supertrended RSI Indicator! Happy trading! 🎉

Comparative Relative Strength AutoselectComparative Relative Strength (CRS) is a relative momentum indicator, used to compare a security against an index, or against another security. The comparison is used to show the relative performance to each other.
This script is a Quality of Life improvement, which attempts to match the base symbol to its relevant index on the local stock exchange. Thus automagically selecting the best and most relevant comparative symbol.
Features:
*optional comparative symbol override, in case your favourite index is not included in this script, or you want to force it to function as as a traditional cRS script without the autoselect feature.
* optional moving average crossover line
* optional absolute momentum calculation, calculating the excess return of the basesymbol and comparativesymbol against its own simple moving average.