Candlestick DataCandlestick Data Indicator
The Candlestick Data indicator provides a comprehensive overview of key metrics for analyzing price action and volume in real-time. This overlay indicator displays essential candlestick data and calculations directly on your chart, offering an all-in-one toolkit for traders seeking in-depth insights.
Key Features:
Price Metrics: View the daily high, low, close, and percentage change.
Volume Insights: Analyze volume, relative volume, and volume buzz for breakout or consolidation signals.
Range Analysis: Includes closing range, distance from low of day (LoD), and percentage change in daily range expansion.
Advanced Metrics: Calculate ADR% (Average Daily Range %), ATR (Average True Range), and % from 52-week high.
Moving Averages: Supports up to four customizable moving averages (EMA or SMA) with distance from price.
Market Context: Displays the sector and industry group for the asset.
This indicator is fully customizable, allowing you to toggle on or off specific metrics to suit your trading style. Designed for active traders, it brings critical data to your fingertips, streamlining decision-making and enhancing analysis.
Perfect for momentum, swing, and day traders looking to gain a data-driven edge!
Cerca negli script per "relative volume"

RVWAP ENHANCED**Rolling VWAP with Alerts and Markers**
This Pine Script indicator enhances the traditional Rolling VWAP (Relative Volume Weighted Average Price) by adding dynamic features for improved visualization and alerting.
### Features:
1. **Dynamic VWAP Line Coloring**:
- The VWAP line changes color based on the relationship with the closing price:
- **Green** when the price is above the VWAP.
- **Red** when the price is below the VWAP.
2. **Candle and Background Coloring**:
- **Candles**: Colored green if the close is above the VWAP and red if below.
- **Background**: Subtle green or red shading indicates the price’s position relative to the VWAP.
3. **Alerts**:
- Alerts notify users when the VWAP changes direction:
- "VWAP Turned Green" for price crossing above the VWAP.
- "VWAP Turned Red" for price crossing below the VWAP.
4. **Small Dot Markers**:
- Tiny dots are plotted below the candles to mark VWAP state changes:
- **Green dot** for VWAP turning green.
- **Red dot** for VWAP turning red.
5. **Custom Time Period**:
- Users can select either a dynamic time period based on the chart's timeframe or a fixed time period (customizable in days, hours, and minutes).
6. **Standard Deviation Bands (Optional)**:
- Standard deviation bands around the VWAP can be enabled for further analysis.
This script is designed to provide clear and actionable insights into market trends using the RVWAP, making it an excellent tool for traders who rely on volume-based price action analysis.

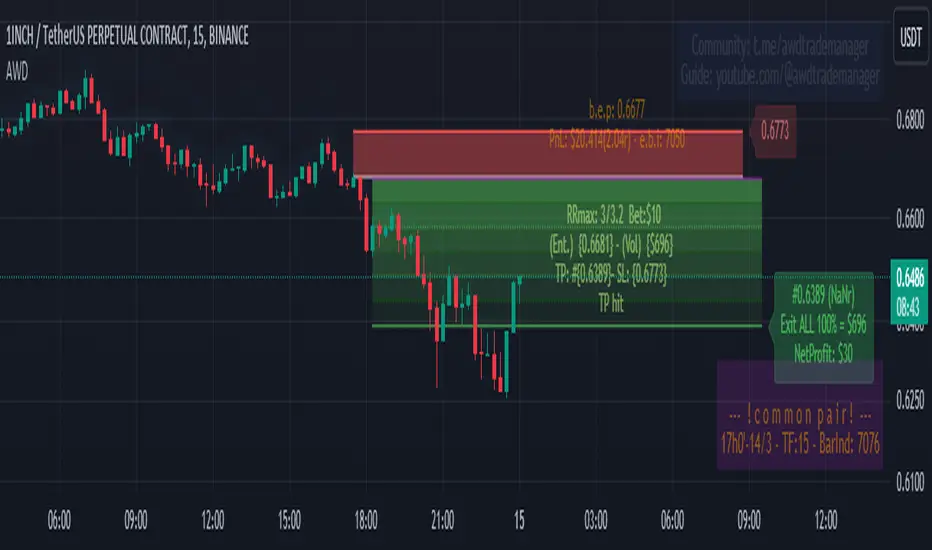
AWD TRADE MANAGER (ATM) by ManhDNAWD TRADE MANAGER (ATM) is a position management tool including with some advanced features and entry suggestions. It helps you to do most of position calculations and position management, reduce time spent for charting by alerts.
There are 3 main things to describe about the manager:
(1) The original function of the manager is to help traders to manage their trades with automatic calculations of all factors of their trades with some of input values. For example, it will calculate the trade volume when you enter the bet size, entry and stop loss price. It calculates take profit price when you enter entry, stop loss prices and the risk/reward ratio, …
(2) Another function is the system of alerts. After set up a trade, create an alert and the manager will do the rest. It will send you an alert when the limit order got filled, got stopped out, take profit level hit, or even it reached a key level or an opposite/spike move just occurred…
(3) Entry suggestions: Suggest entries with price action strategies. Details bellow.
Features in details:
(1) Automatic calculations:
- Auto calculate trade volume based on entry, stop loss prices and the money users willing to lose when the trade is failed. Auto detect some type of assets and volume will be calculated in USD (for cryptocurrencies) or in lot (for forex).
- Auto calculate take profit price based on entry, stop loss prices and expected rr ratio.
-Auto suggest take profit price based on pivot points.
- Auto suggest stop loss price based on pivot points.
- You can enter several exit points with percentages and the manager will calculate the averaged risk reward ratio you earned after the last exit price reached.
- Quick entry price pick to reduce typing requirement.
- Quick trade set up: 2 checkboxes and 1 number entering to set up a trade.
(2) Alert system
After setting up a trade and creating an alert of the manager, it will follow the market and your order. It will send you alerts for all the events that you should follow up your position. These alerts can be sent to your pc, your phone and your smart watch, so even you are a full-time day trader, you will save your time for charting or managing your positions. Here’s the list of alerts:
- Sending alert when suggesting an entry with details calculated from preset inputs so you can just pick that info to enter the position including trading volume, entry, stop loss, take profit prices, timeframe, estimated risk-reward ratio …
- Sending alert when a limit order got filled and auto switch to position-managing-mode.
- Sending alert when a limit order in still staying unfilled but should be canceled (because of price reaching a key level or is running too far, …)
- Sending alert when the position got stopped out or TP hit.
- Sending alert when the running position reached a key level and need to be watched out.
- Sending alert when a spike move or opposite move just occurred.
- Sending alert when a position is taking too long to run.
- You can also set 3 levels of price with messages then ATM will send you alerts when price reaches those levels.
- When price runs, ATM might suggest you to move stop loss to levels based on pivot points by sending you alerts.
- Alert when a BOS occurred.
- Options to turn on/off each kind of alert.
(3) Entry suggestions.
The script included price action entry suggestions.
The 1st strategy is getting in a position when a candle pattern occurred and confirmed by MA20.
The 2nd strategy is detecting double top/bottom and a candle pattern confirm break out after that.
The 3rd strategy is a pullback strategy, in a trending market, a candle pattern occurs and confirms the pullback ends, it will suggest an entry.
All those strategies I am using by myself for a long period of time but to make sure they are good for your trading style, do your own research and backtest before use. Keep in mind to manage risk and be responsible to your capital.
User side modifications:
- Those price action strategies have some major arguments that users can tune themselves to make it meet their style or their needs like choosing method to suggest entries, refine entry quality by changing the confirmation methods,…
- Most of appearance factors can be changed by users.
- one-click to toggle between full features and simple mode.
TradingView Chart demo pictures:
Author's bio:
I have been a full-time day trader for 7 years. I like coding with Pinescript and I also developed some helpful indicators that provide unique aspects to approach markets and the most favorite one from that is Relative Volume Index (RVI) that will be introduced in near future.
Disclaimer:
This tool has been tested and been using for my own trading career for a long period of time but practicing to use it yourself to understand it and use it correctly is needed. All of the features have been carefully tested before publishing but make sure to double-check all the info you get from it before getting into a trade to avoid losing money by a sudden mistake or even a bug. Keep in mind you will need to take all the responsibility with your capital or any potential loss while using this tool.
If you get anything wrong while using it, please leave some comments bellow, all of your ideas or suggestions will be taken seriously.
Thank you in advance!
(It is not possible to explain all the settings or features within the description, If you have questions, please leave comment, I will answer to help you to get familiar with the tool.)
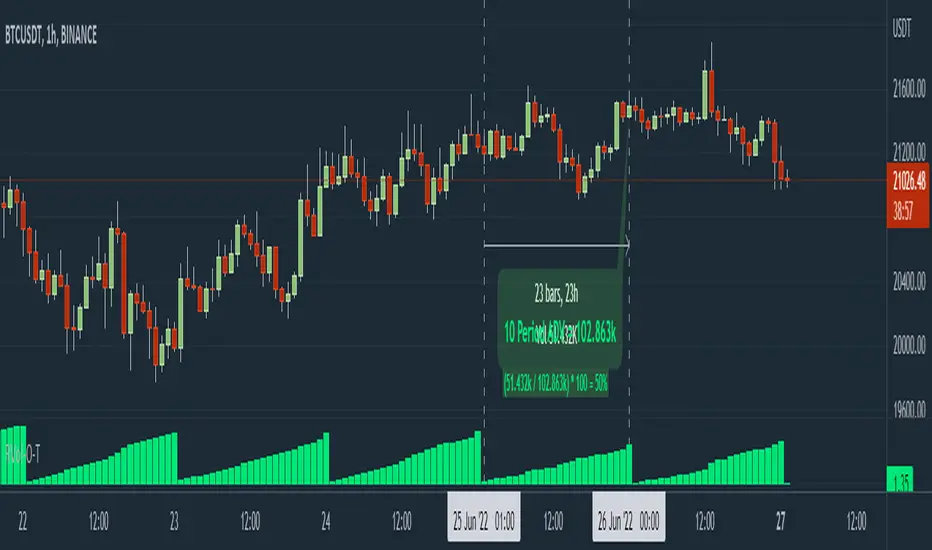
RVol Over Time [vnhilton]I recommend to do the following to give you indicator values at a better glance & for a cleaner chart: 1) Turn off labels on price scale. 2) Turn down opacity for Rvol-O-T down to 0%. 3) Move the indicator to the chart pane or to the volume pane. 4) Pin the indicator to scale A (same scale as the price chart/pane). Now you can only see the RVol-O-T on the top left.
Relative Volume (RVol) is an indicator that compares current volume with Average Daily Volume (ADV) for a set period of time. This can be used to find tickers in play, as those trading with an RVol >1 means it's trading above average volume, which may be worthy of your attention.
This indicator calculates RVol as the day progresses, which may be useful if you have strategies with an intraday criterion e.g. the ticker needs to be trading at Rvol > 2, 30 minutes after the open for stocks (You can see RVol in % or float form).
The chart snapshot image above shows BTCUSDT. Reason for this ticker is because for cryptocurrencies & forex pairs, market data is complete so this indicator can work correctly. If you try this indicator on stocks, indices or futures, you may notice that there's a discrepancy between daily volume candles & the summation of intraday candles (they don't equate each other - huge difference between the 2), causing the indicator to not work as effectively. To solve this problem, you would have to get extra market data from TradingView, or to integrate your broker with TradingView to pass along your broker's data feed (provided your broker also has real-time data - if not you may need to get extra market data via the broker).
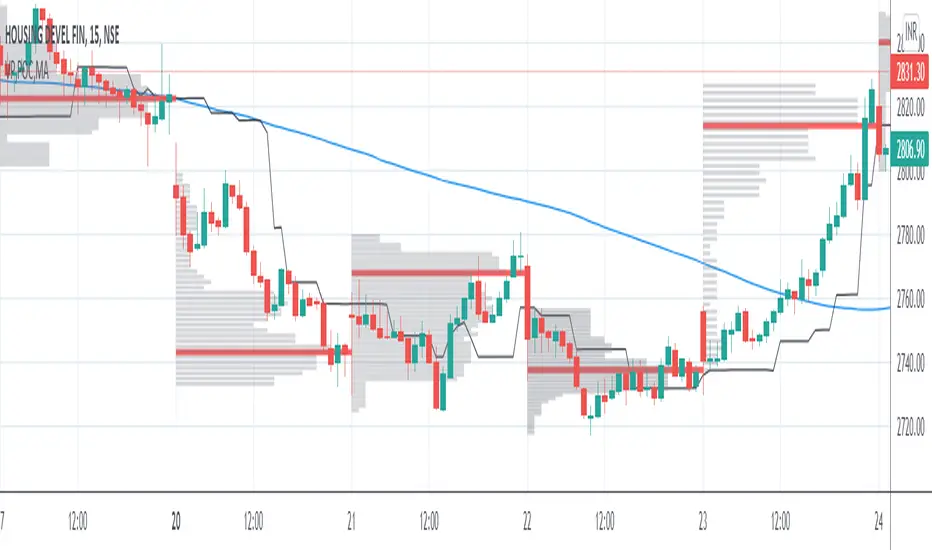
VP and POCThis code is credited to juliangonzaconde. Have taken his help to modify his beautiful creation.
Volume profile is a key study when comes to understanding the auction trading process. Volume Profiles will show you exactly how much volume, as well as relative volume, occurred at each price as well as the exact number of contracts for the entire session. It is a visualization tool to understand the high activity zone and low activity zone.
Volume profile measures the confidence of the traders in the market. From short term trading perspective monitoring the developing volume profile in realtime make more sense to track current market participation behavior to take better trading decisions.
Hope this helps you in trading on daily timeframe.
Happy Trading.
Delta-RSI Strategy (with filters)Delta-RSI Strategy (with filters):
This is a version of the Delta-RSI Oscillator strategy with several criteria available to filter entry and exit signals. This script is also suitable for backtesting over a user-defined period and offers several risk management options (take profit and stop loss).
Since the publication of the Delta-RSI Oscillator script, I have been asked many times to make it compatible with the Strategy Tester and add filtering criteria to minimize "false" signals. This version covers many of these requests. Feel free to insert your favorite D-RSI parameters and play around!
ABOUT DELTA-RSI
Delta-RSI represents a smoothed time derivative of the RSI designed as a momentum indicator (see links below):
INPUT DESCTIPTION
MODEL PARAMETERS
Polynomial Order : The order of local polynomial used to interpolate the relative strength index (RSI).
Length : The length of the lookback frame where local regression is applied.
RSI Length : The timeframe of RSI used as input.
Signal Length : The signal line is a EMA of the D-RSI time series. This input parameter defines the EMA length.
ALLOWED ENTRIES
The strategy can include long entries, short entries or both.
ENTRY AND EXIT CONDITIONS
Zero-crossing : bullish trade signal triggered when D-RSI crosses zero from negative to positive values (bearish otherwise)
Signal Line Crossing : bullish trade signal triggered when D-RSI crosses from below to above the signal line (bearish otherwise)
Direction Change : bullish trade signal triggered when D-RSI was negative and starts ascending (bearish otherwise)
APPLY FILTERS TO
The filters (described below) can be applied to long entry, short entry and exit signals.
RELATIVE VOLUME FILTER
When activated, the D-RSI-driven entries and exits will be triggered only if the current volume is greater than N times the average over the last M bars.
VOLATILITY FILTER
When activated, the D-RSI-driven entries and exits will be triggered only if the N-period average true range, ATR, is greater than the M-period ATR. If N < M, this condition implies increasing volatility.
OVERBOUGHT/OVERSOLD FILTER
When activated, the D-RSI-driven entries and exits will be triggered only if the value of 14-period RSI is in the range between N and M.
STOP LOSS/TAKE PROFIT
Fixed and trailing stop loss as well as take profit options are available.
FIXED BACKTESTING START/END DATES
If the checkboxes are not checked, the strategy will backtest all available price bars.

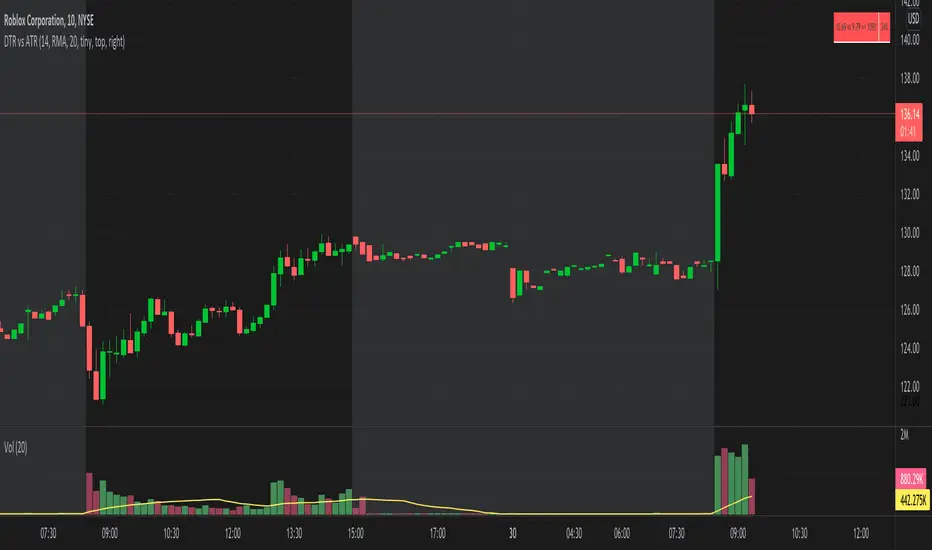
DTR vs ATR w RVolDTR vs ART along with Relative Volume in Percentage. So if you see RVol as 200% with input length of 10 days, today's volume is 2x compared to past 10 days. It helps if today's volume is already reached 20% or 30% within 30mins of market open, etc.
volume changesThis is based upon Daveatt script
I change the volume to VPT as I see this as more accurate .. the rest is same
Thanks Dave you have the best script here:)
green is bullish
red is bearish
I just wonder if we can filter some bad signals? then it would be much better

Planète_finance Day Trading 5m - Signal Achat/Vente EMA
Keep the original logic (EMA 8 & EMA 15 crossover on 5m).
Filter with the EMA200 trend on 1h (to stay in the direction of the market).
Add a simple relative volume filter to avoid false signals.
Display BUY when bullish conditions are met and SELL when bearish conditions are met.
No over-complexity (RSI, cooldown, etc.) → that can be added later if you want to refine.

ESTP MeterAuto Entry/SL/TP + Meter (no dashboard / no MA50 plot / no fixed levels)
Idea
The indicator builds Entry / SL / TP1–TP3 zones and highlights bars when the odds of trend continuation are high. Under the hood it runs a multi-factor Meter with HTF filtering, volume, volatility, and breakout context. It does not draw a dashboard, MA50 line, or fixed levels — only the working zones and setup highlights.
How it works
Signal LONG/SHORT comes from a combo of:
RSI(14), MACD (line/signal/hist), and trend vs SMA50 (used internally only, not plotted).
HTF filter (tfHTF): direction alignment on the higher timeframe via EMA50, RSI, MACD-hist.
Breakout factor: a brLen lookback high/low break in the trend direction boosts the score.
Meter/Score (0–100): weighted sum of RVOL, ATR%, TREND, ADX, BREAK, with a chop penalty when EMA20–EMA50 gap is small.
Bar highlight: when Score ≥ 70 and there’s a breakout in the aligned trend direction.
Zones:
On signal change (bar close) it pins Entry at the close.
SL: at the most recent confirmed pivot (5×5). If no pivot yet, a fallback SL = ±2% from Entry.
TP1/TP2/TP3: from wave = |Entry − SL| using your Fib multipliers.
Zones are drawn 20 bars forward with labels for Entry/SL/TP.
Key Inputs
TP1/TP2/TP3 Fib: 0.618 / 1.0 / 1.618 by default.
HTF (tfHTF): higher-timeframe filter (default 60m).
brLen: breakout lookback (suggest 20–50).
rvolMin / atrNorm: normalization floors for relative volume and ATR%.
emaBandMin: minimum EMA20–EMA50 gap; below this, score is penalized.
showBarHL: toggle bar highlighting.
Note: adxMin is reserved for future use (not enforced as a hard filter in this version).
Practical use
Timeframes: best from M15 to H4. On M1–M5, raise brLen and rvolMin to fight noise.
Markets: liquid futures/crypto/FX. For thin symbols, reduce RVOL impact.
Exits: scale out across TP1/TP2/TP3; after TP1, move to break-even.
Context filter: trade only when HTF & LTF align (built into the logic).
Risk: position size from SL distance; keep risk ≤ 1–2% per trade.
Caveats (repainting / behavior)
Pivot-based SL confirms after 5 bars — by design it’s delayed. Until then, a ±2% safety SL is used.
Zones/labels are placed on bar close when the signal flips — this reduces flicker and intrabar artifacts.
HTF data uses request.security — prefer closed bars to avoid intrabar higher-TF whipsaws.
This is an indicator, not a strategy; no guarantees. Forward-test and tune per market/TF.
Suggested presets
Trend/Swing (H1–H4): brLen=30–50, rvolMin=1.2–1.5, atrNorm=0.02–0.03, emaBandMin=0.002–0.004.
Intraday (M15–M30): brLen=20–30, rvolMin=1.1–1.3, atrNorm=0.03–0.05, emaBandMin=0.0015–0.003.

MA+RVol+ADR%Initial Release
MA + RVol + ADR%: Combines trend (Moving Average), unusual activity (Relative Volume), and daily volatility (Average Daily Range %) to spot strong, high-momentum trade setups.

simple trend Scanner Dashboard Script Does
- Calculates key metrics:
- Percent Change from previous day
- Relative Volume (% vs 10-bar average)
- RSI and ADX for strength/trend
- 20 EMA for dynamic support/resistance
- Classifies market condition:
- 🟢 Strong if RSI > 60 and ADX > 25
- 🔴 Weak if RSI < 40 and ADX < 20
- ⚪ Neutral otherwise
- Displays a table dashboard:
- Compact, color-coded summary of all metrics
- Easy to scan visually
- Plots visual signals:
- Arrows and triangles for percent change and volume spikes
- Data window plots for deeper inspection

ATR Squeeze BackgroundThis simple but powerful indicator shades the background of your chart whenever volatility contracts, based on a custom comparison of fast and slow ATR (Average True Range) periods.
By visualizing low-volatility zones, you can:
* Identify moments of compression that may precede explosive price moves
* Stay out of choppy, low-momentum periods
* Adapt this as a component in a broader volatility or breakout strategy
🔧 How It Works
* A Fast ATR (default: 7 periods) and a Slow ATR (default: 40 periods) are calculated
* When the Fast ATR is lower than the Slow ATR, the background is shaded in blue
* This shading signals a contraction in volatility — a condition often seen before breakouts or strong directional moves
⚡️ Why This Matters
Many experienced traders pay close attention to volatility cycles. This background indicator helps visualize those cycles at a glance. It's minimal, non-intrusive, and easy to combine with your existing tools.
🙏 Credits
This script borrows core logic from the excellent “Relative Volume at Time” script by TradingView. Credit is given with appreciation.
⚠️ Disclaimer
This script is for educational purposes only.
It does not constitute financial advice, and past performance is not indicative of future results. Always do your own research and test strategies before making trading decisions.

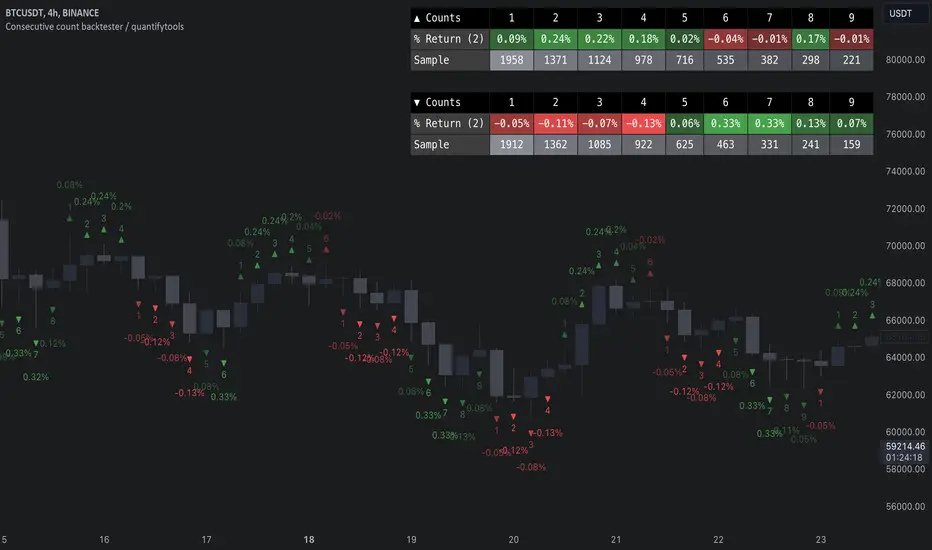
Consecutive count backtester / quantifytools- Overview
Consecutive counting is a simple method to mechanically define trending states to the upside and downside. Consecutive counts are calculated by taking reference price level (e.g. close 4 candles ago) and count closes above/below it up to a maximum count that resets the consecutive count back to 1. This tool provides the means to backtest each count by measuring % change in price after each count (e.g. % gain 2 candles after a given count).
Users can define reference source that starts the consecutive count (e.g. close 4 candles ago), maximum count where counter resets (e.g. after 9th count) and backtesting period (e.g. price change 2 candles after count).
Filters add extra conditions that must be met on the consecutive count to qualify as valid, which are also reflected on the backtest metrics. The counts can be refined using the following filters:
- RSI above/below X
- Price above/below/at moving average of choice
- Relative volume above/below X
Average gain corresponding to each count as they occur can be toggled off for less clutter. Average price change can also be visualized using candle color. Colors, gradient and table/label sizes are fully customizable.
- Practical guide
Example #1: Identify reversal potential
Consecutive counting is a simple yet effective method to for detecting reversals, for which 7-9 counts are traditionally used. Whether that holds true or not can now be put through a test with different variations of the method as well as using additional filters to improve the probability of a turn.
Example #2: Identify trend following potential
Consecutive counts can also have utility value for trend following. When historical short term change is to the downside, expect downside, when to the upside, expect upside.
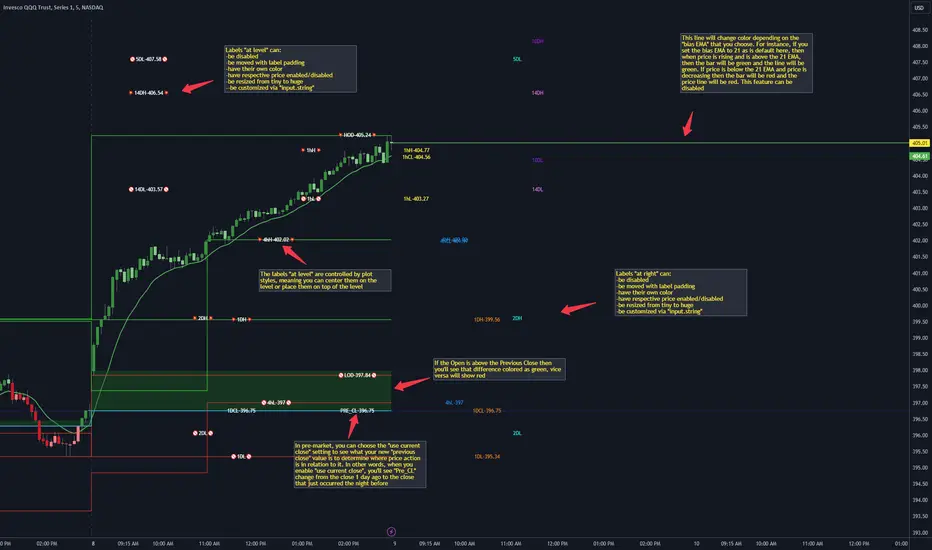
CANDLE LEVELS [PRO]This indicator provides you with 55 levels! with labels to help you identify quickly where current price is in relation to the OPEN, CLOSE, HIGH OF DAY and LOW OF DAY to a respective level. Choose from levels as low as the 5 minute time frame all the way up to 200 days. All of the levels except the day's OPEN, HIGH OF DAY AND LOW OF DAY use the PREVIOUS time frame's level. In other words, when you're looking at the "1 DAY HIGH", that's actually the previous day's HIGH OF DAY. Whether you're a scalper on the lower time frames or a swing trader that mainly uses the 1 hour and above, these candle levels can be an invaluable source of support and resistance; in other words you'll often see price bounce off of a level (whether price is increasing or decreasing) once or multiple times and that could be an indication of a price's direction. Another way that you could utilize this indicator is to use it in confluence with other popular signals, such as an EMA crossover. For instance, you could watch as price rises above the 21 EMA all the while price is also crossing up and over the previous day's HIGH OF DAY with a relative volume that's double that of the previous week's average. These are just a few of some potential bullish signals that you could look for to go long on a trade using the candle levels provided.
I've made this indicator extremely customizable:
⚡Each level has 2 labels: 1 "at level" and 1 "at right", each label and price can be disabled
⚡Each label has its own input for label padding. The "at right" label padding input allows you to zoom in and out of a chart without the labels moving along their respective axis
⚡Each label's text can be customized via an "input.string" code base
⚡Each level's label can be changed via a plot style setting to determine if the label is centered with it's respective level or rides along the top of it
⚡Significant figures input allows you to round price up or down
⚡A "bias EMA" tool that color codes the candles and price line to show you where price is in relation to the 21 EMA (or another value that you pick). As a result, this can be an effective visual to help reduce cognitive load
⚡A "fill level" where color is determined by price opening above or below the previous day's close
⚡A "use current close" setting that's great to use in pre-market as it shows you where price is in relation to the previous days' close
----------------------------------------------------------------------------------------------------------------------
🙏Thanks to (c)satymahajan for the inspiration behind the ATR "previous close" and "bias candle" code base
🙏Thanks to my mentor (c)SimpleCryptoLife for the libraries and extensive code to help create this indicator
Moving Average CandlesInspired by Ricardo Santos's " Multiple Moving Average Candle System V0" ()
This script plots 6 moving averages using the plotcandle function rather than the normal plot function. Result is a stylish indicator that shows moving average crossovers in a more visual way. Moving average type options available are , or Simple, Exponential, Hull, Relative, Volume Weighted, and Arnaud Legoux Moving Averages, Linear Regression Curve, and Median. Lengths for each can be set in settings along with selection specific parameters. Good for plotting/visualizing potential entry/exit points based on your preferred moving averages crossing over, or just as some eye candy.

.b pin-up symbolWhen trading cryptocoins, it is necessary to check the price trend of NASDAQ, BTC.D, BTC.OI, BTC spot or other coins of similar groups.
However it is very cumbersome to put a comparison symbol in the Tradingview chart and combine individual indicators one by one.
Moreover even with such a combination, the chart is messy and visibility is not good.
This script was developed as a composite-solution to that situation, and will make you happy.
- NQ1!, USTECH100CFD | symbol fixed
- BTC.Dominance, BTC.OpenInterest, BTC symbol, others pin-up-symbol | selectable
- Pin-up-symbol | selectable
- Pin-up-symbol's candle chart
- Trending
* EMA 9,21,50,200 ribbon classic EMA
* .b price line ; .b price = unique trending price with price-action + relative-volume-action + ATR
* Dynamic S/R Cloud ; BB + donchian band + high/low + atr mixed custom-logic
* VWWMA + .b price Shadow ; Volume-weighted WMA on .b price = unique MA faster than classic VWMA
Trending shadow direction is not bad even on low-timeframe (1, 2, 3, 5m, 15m...)
- Pattern
* Harmonic Pattern ; A simplified version of the harmonic pattern indicator, simply show-up pattern complete position
for reference only - adopted from HeWhoMustNotBeNamed's script.
- Information Panel
* BTC Dominance, BTC Open Interest, Pin-Up-Symbol price
* Trend meter ; 5,15,30,1h,2h,4h Meter Calc with 1 minute-timeframe candles
5 = Green if the current price is higher than the price 5 minutes ago.
1h = Green if the current price is higher than the price 2 hours ago.
4h = Red if the current price is lower than the price 4 hours ago.
* caution ; To use real-time chart of "CME_MINI:NQ1!" you have to additional subscribe CME data,
default setting is 'NQ1!' , you can change to 'USTECH100CFD'
* When you choose symbol which is closed trading hours, the script's update stopped.
Even if the selected pin-up-symbol is on trading hours, the currently selected symbol's chart doesn't update.
* recommended | chart setting > Appearance : Top margin 0%, Bottom margin 0% for optimized screen usage :)
if you have any questions freely contact to me by message on tradingview, or telegram @sr_bt
but please understand that responses may be quite late.
------------------------------------------------------------------------------------------------------------------------------------------------------------
copyright 2022 (sr_b)
Special thanks to all of contributors of community.
The script (originaly .b) may be freely distributed under the MIT license.
The other classic script code also may be freely distributed under the MIT license.
Simplified Harmonic script part | core adopted from 'Multi ZigZag Harmonic Patterns (HeWhoMustNotBeNamed)' MPL2.0 license

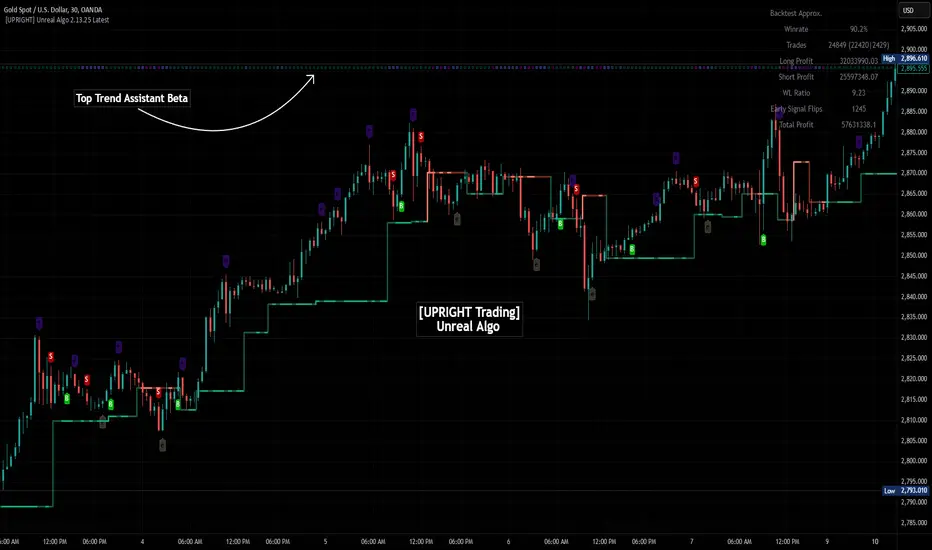
Unreal Algo [UPRIGHT] (cc)Hello Traders,
It's finally that time, I'm releasing my baby out into the world.
Unreal Algo is the answer to the question you didn't know you were asking.
It's for beginners and advanced traders alike. I've made the settings very customizable, but also easy to just jump right in.
How it works:
It uses tons of calculations, confirmations, and filters to bring you the most accurate predictive algorithm possible. The algo will automatically adjust to different volatility in the market to still provide accurate signals and confirmation. It will automatically show support and resistance in real-time. A Moving Average cloud with speeds varying from extra fast to slow; they will help traders confirm whether they should stay in the trade. Also, I added 2 stoplosses, because the importance of risk management should always be emphasized even with strong accuracy.
Features:
---The Most Accurate Signals on the planet.
--------Buy/Sell, Up/Down direction change, and Red/Green arrows.
--- MA cloud with beautiful color blend that can act as a confirmation of direction.
-------- 17 different types/versions of moving Averages to choose from.
--------Easy line transparency and toggle adjustments.
--------Easy cloud transparency adjustments.
--- Support and Resistance .
--- Advanced PSAR that will show red when bearish while in a bullish trend, and visa-versa.
---Potential Orderblocks that can be extended to show a grid (adding additional support/resistance information).
--- Fibonacci Lines.
--- Pivot bar that changes colors based on pivot direction.
---Resistance Breakout and Support Breakdown Signals .
--- Relative volume & momentum bar coloring.
---Two Separate Stoplosses .
--------Circles change color and flip to top and red for Short, bottom and green for long.
--------Horizontal stoploss that tracks the price and flags to take profit. White for Long and Yellow for short.
---As always... Fully customizable .
Different customization options:
Without stoplosses and Support/Resistance.
Without Support/Resistance, arrows and psar removed.
Added back Support/Resistance, lightened MA cloud
Fully loaded (minus trailing stoploss)
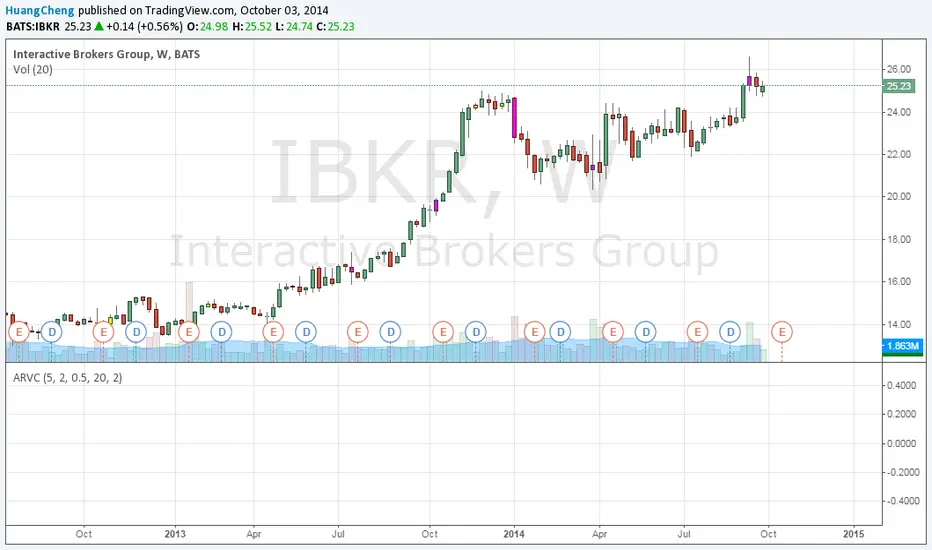
Support and Resistance by CainKellyeCheck out my automatic support and resistance indicator that uses the EMA of price change * relative volume as the bases of pivot search.
It also tells the strength of the support and resistance lines calculated using a 4 times quicker EMA and using its distance from the slower one.
The strongest plotted line has the maximum opacity and the weakest has the minimum opacity inside the given range.
This calculation results in an organic detection of the support and resistance prices.
You can set the distance range in percentage you want to have lines calculated around the current price.
You can set the lines gravity distance inside which they are snapped together: the stronger line pulls the weaker to it by using strength weighted average for the new price value.
You can increase the minimum opacity value in case you only see few lines (but the maximum is 15)
You can change the used price for the lines to Close or High/Low but recommended is to use the average of those two (default)
The distances multiplier helps to get a birds eye view easily when using 4H (or higher) chart and a separate one to use on Daily / Weekly / Monthly for even broader view.
Lines and labels are drawn near the candles so you are still able to zoom in.
Labels are not drawn when their line is barely visible (transparency >= 80)
This indicator has been refined on the 15 minute and 1 hour charts of BTC and other cryptos but it works well in smaller volatility markets as well if the distances are adjusted accordingly.

ProAlgo OscillatorThe ProAlgo Oscillator is a momentum based oscillator created using a RSI based approach to trading. The oscillator rises with relative volume and velocity of price action and falls with the opposite. Amongst the signals, there are Bull Bear and R which stands for reversal. Bull and Bear indicates a moment of dying momentum on the oscillator and signifies a trend reversal in the opposite direction. However, the R which stands for reversal has a much higher accuracy % because it also takes into consideration key privot points
This indicator is designed to be used with the ProAlgo indicator and should be not be used to make entries and exits without other analysis.

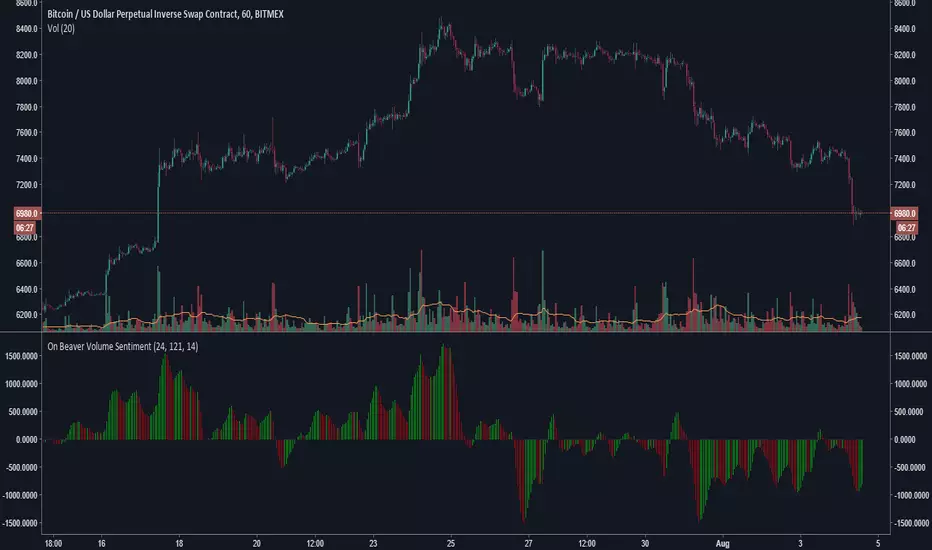
On Beaver Volume SentimentGeneral Market sentiment decoded from two Lazybear OBV's and a CCI.
Lots of strategies with this.
Main point is this indicator tries to be extra sensitive to relative volume changes but keep grounded in sentiment with the cci.
Let me know if you use this!
-Beaverman