Cerca negli script per "renko"
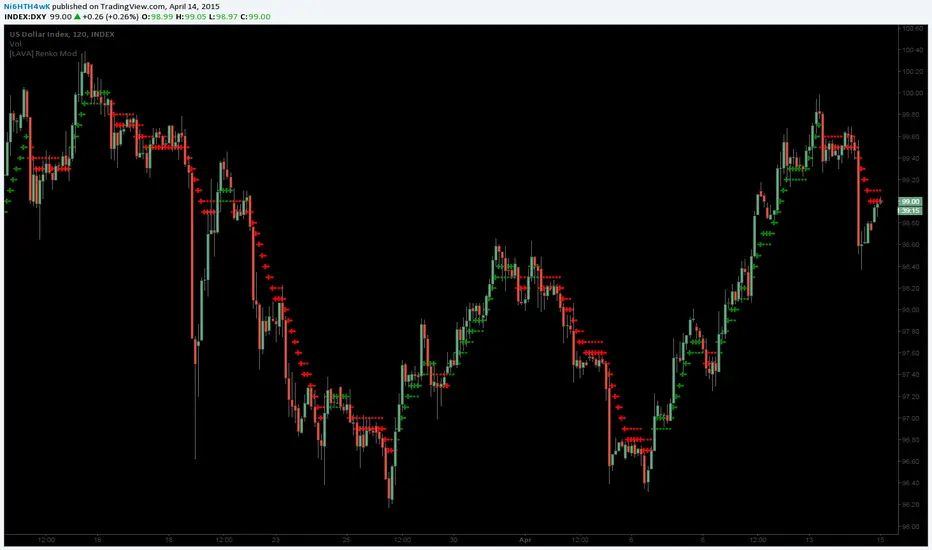
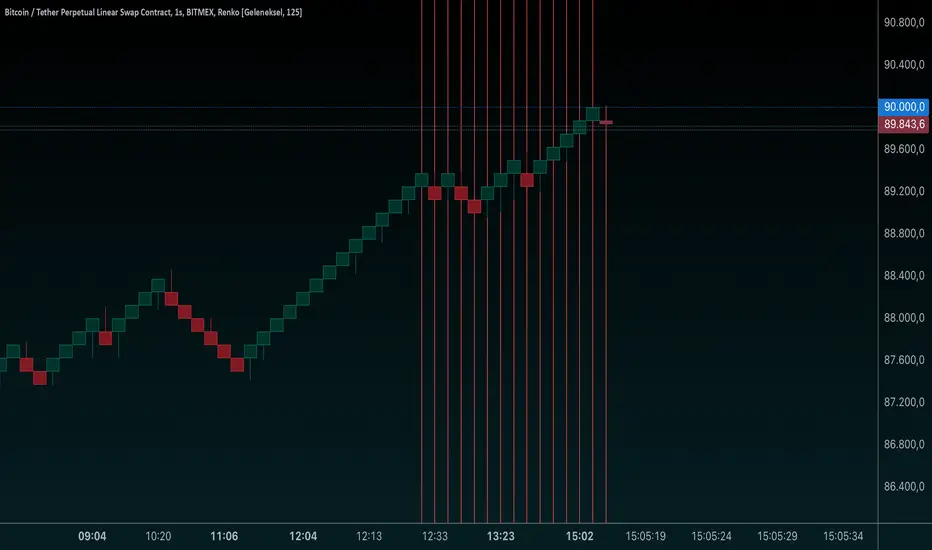
[LAVA] Renko ModTradingview.com Pinescript @author Ni6HTH4wK (LAVA) with assistance from @zmm20
Original code by Richard Santos, (RS)Renko Mod
(RS) www.tradingview.com
(LAVA) 19P7bkzqSAwSm6X7tXmRVkx6AuBXEUZioo
Traditional cross and circles view displayed here, but my favorite look is small linebreak and circles.
Different views available...
Type 2 -
Type 1 -
Without barcoloring -
**EDIT**
pastebin.com - Fixes missed bottoms / tops (April 15th, 2015)
pastebin.com - Fixes slow recognition of steep movements (April 25th, 2015)
Trend Finder - Buy/Sell (Anuj Edition)Renko Trend Finder – Anuj Edition is a powerful trend-following tool designed to detect market direction using Renko logic instead of traditional candlesticks.
Renko filtering removes market noise, making trends clearer and reversals easier to identify.
This indicator internally builds Renko-style price movement and generates clean, high-quality Buy and Sell signals without repainting.

VRS+BarTrend+BarPatternIdentifiedRenko Sniper with Trend bar colours and flintlockwood's identified bar patterns.
Credits for Renko Sniper go to VDUB, Chart patterns identified go to flintlockwood and trend bars to me.
Works like a charm with Hull MACD EFI -24.00% (by Tom1Trader) and CM_Ult_RSI.
Free, but invite only so PM me.

RenkoFlow PercentualIt calculates brick size as a percentage of the chart’s initial price and updates bricks only when price moves one full brick size up or down.
Green bricks represent upward movement and red bricks represent downward movement.
This tool is designed to help visualize directional price changes independently of time and can be used as a clean trend-filtering reference on any timeframe.

Renkoizer[UO]Sometimes you need a rough view of what is going on. Ignoring the details could be a blessing. In the configuration, you can change how much you want to ignore

Renko Periodic Spiral of Archimedes-Secret Geometry - AYNETHow It Works
Dynamic Center:
The spiral is centered on the close price of the chart, with an optional vertical offset (center_y_offset).
Spiral Construction:
The spiral is drawn using segments_per_turn to divide each turn into small line segments.
spacing determines the radial distance between successive turns.
num_turns controls how many full rotations the spiral will have.
Line Drawing:
Each segment is computed using trigonometric functions (cos and sin) to calculate its endpoints.
These segments are drawn sequentially to form the spiral.
Inputs
Center Y Offset: Adjusts the vertical position of the spiral relative to the close price.
Number of Spiral Turns: Total number of full rotations in the spiral.
Spacing Between Turns: Distance between consecutive turns.
Segments Per Turn: Number of segments used to create each turn (higher values make the spiral smoother).
Line Color: Customize the color of the spiral lines.
Line Width: Adjust the thickness of the spiral lines.
Example
If num_turns = 5, spacing = 2, and segments_per_turn = 100:
The spiral will have 5 turns, with a radial distance of 2 between each turn, divided into 100 segments per turn.
Let me know if you have further requests or adjustments to the visualization!
RenKagi Fusion: Aura & SMA Clash IndicatorRenKagi Fusion: Aura & SMA Clash Indicator
Welcome to the RenKagi Fusion Indicator – a powerful, customizable tool that blends the strengths of Renko and Kagi charts to provide noise-filtered trend insights, enhanced with visual Aura effects and SMA (Simple Moving Average) crossover signals. Designed for traders seeking a unique edge in trend detection and reversal identification, this indicator combines traditional charting techniques with modern visualizations to help you navigate markets more effectively. Whether you're trading stocks, forex, or crypto, RenKagi Fusion offers a clean, actionable overview of market dynamics.
Key Features
RenKagi Line (Weighted Fusion of Renko and Kagi): The core of the indicator is the RenKagi line, a weighted average of Renko (brick-based trend filtering) and Kagi (reversal-focused line charts). Users can adjust the weight (default: 60% Renko, 40% Kagi) to prioritize stability or sensitivity. This fusion reduces market noise while highlighting key price movements.
Trend Scoring System: Calculates strength scores for Renko, Kagi, and RenKagi (capped at 20 points, converted to percentages). Scores increase with trend continuation and reset on reversals, giving a quantitative measure of momentum.
Aura Effects (Optional): Visual "glow" around lines based on score percentage – higher scores mean more opaque and thicker auras, adding a dynamic layer to trend visualization.
SMA Clash (Crossover Detection): Monitors daily SMA50, SMA100, and SMA200 for golden/death crosses (SMA50 crossing above/below longer SMAs) and RenKagi-SMA crossovers. These are displayed in a persistent info table for quick reference.
Customizable Visuals: Toggle lines, boxes, shapes, auras, and labels. Background coloring based on selected source (Renko, Kagi, or RenKagi) for intuitive trend bias.
Info Table: A configurable table (position and colors adjustable) summarizing scores, directions, cross states, brick size (with type), Kagi reversal (with type), and weights. No clutter – all in one place.
Alert Conditions: Built-in alerts for direction changes (Renko, Kagi, RenKagi), SMA crossovers, and golden/death crosses – perfect for real-time notifications.
How It Works
Renko Logic: Builds bricks based on user-selected type (Traditional fixed size, ATR dynamic, or Percentage). Scores build as trends persist, resetting on reversals.
Kagi Logic: Line reverses on thresholds (Traditional, ATR, or Percentage), scoring continuous moves.
RenKagi Calculation: Weighted average: (renkoPrice * renkoWeight + kagiLine * (100 - renkoWeight)) / 100. Score is a blend of individual scores.
SMA Integration: Daily timeframe SMAs for reliable long-term signals. Crossovers trigger alerts and update table states persistently until reversed.
Advantages for Traders
Noise Reduction: By fusing Renko's block structure with Kagi's reversal focus, it filters out minor fluctuations, helping identify strong trends early.
Versatility: Fully customizable – adjust weights, types, and visuals to fit any market or timeframe. Ideal for swing trading, trend following, or scalping.
Visual Clarity: Aura and background coloring provide at-a-glance insights, while the table consolidates data without overwhelming the chart.
Actionable Signals: Golden/Death crosses and direction changes offer clear entry/exit points, backed by alerts for timely execution.
Performance Optimization: Limits on lines/labels/boxes (500 each) ensure smooth operation on large datasets.
Usage Tips
Start with default settings for balanced performance.
Use in higher timeframes for trend confirmation or lower for intraday signals.
Combine with your favorite strategies – e.g., buy on RenKagi upward cross with SMA50 and golden cross confirmation.
Test on historical data to optimize weights and thresholds.
Note: This indicator is for educational and informational purposes only. Past performance is not indicative of future results. Always conduct your own analysis and use risk management. No financial advice is provided.
If you find this useful, please like, comment, or share your feedback!

Stochastic RSI Momentum TranformThis is my version of Stochastic RSI, but not the stochastic RSI alone, hell no, it's a lagging indicator, I don't like lagging indicators.
This is a leading indicator that has momentum calculations in it and not only that, it has a momentum shifting calculation based on modified ehler's transformation !
Simple for user, a hell to program !
Price and how to get access to ? contact me in PM !

Trader Set - Modified MTF BOTTOMThis is a modified formula for MFT. It's prefabricated with numbers that would work best with my methodology and system.
Please don't ask for getting access. Only my students can get access to these indicators.
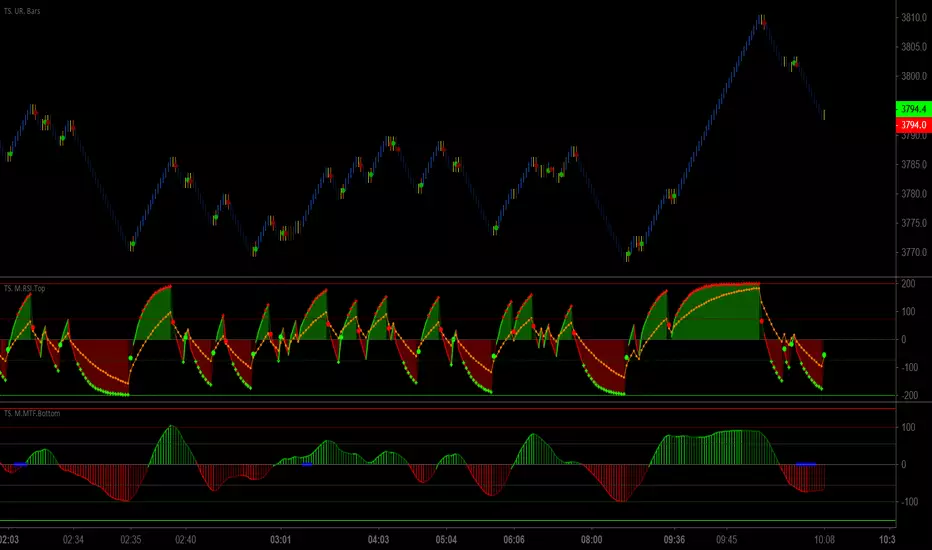
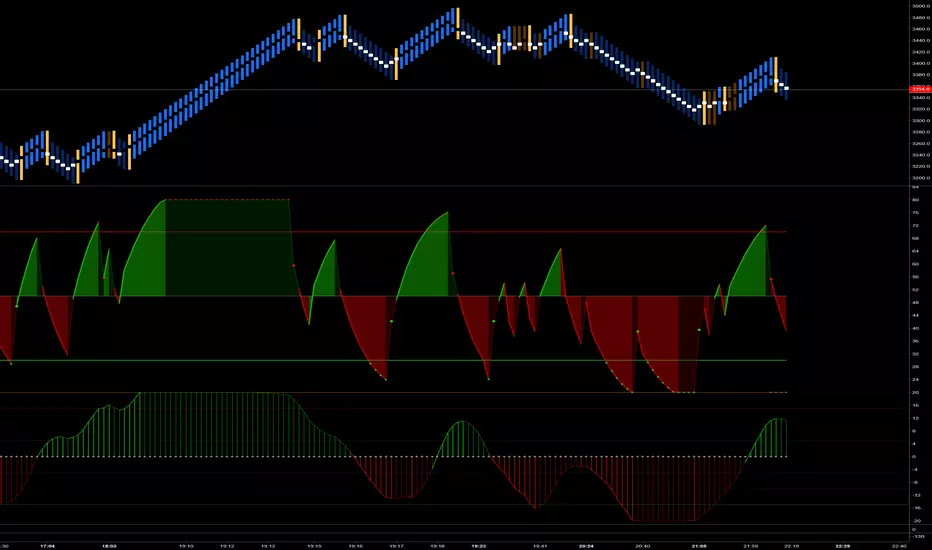
Trader Set - Modified RSI TOPThis is a modified RSI formula that draws two different RSI time frames on top of eachother with additional signal points on it.
Please don't ask for getting access. Only my students can have access to these tools because they are part of my methodology and prefabricated with fixed numbers that would work ONLY on my system.
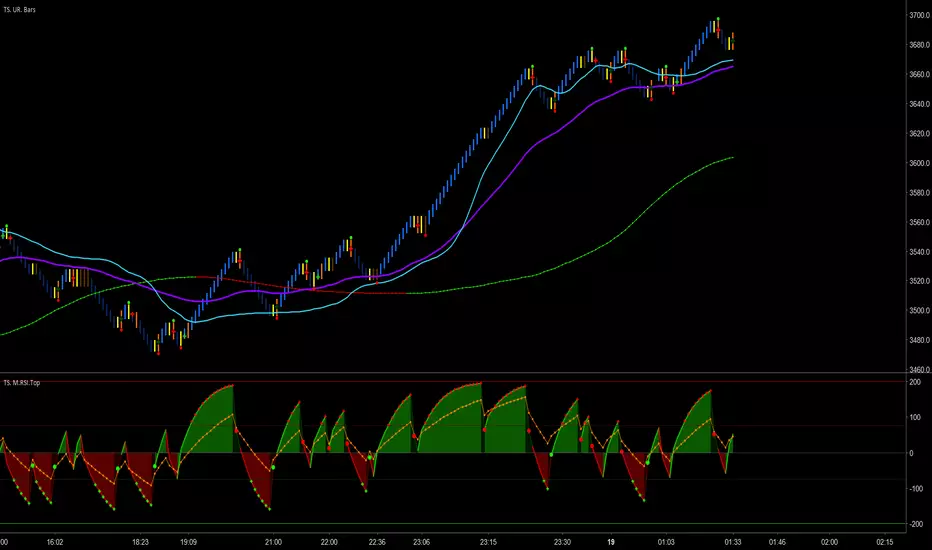
Trader Set - Modified RSI MTFThis is a modified version of RSI MTF, a similar indicator can be found in public library if anyone is interested, mine, is fabricated to work with my methology with all the addition i will add to this (just like others when i added the ability to change the moving types in critical places of formula) so that students can experiment with them (it will come in next version). also, I normalize both sections for better visualization.
Please don't ask me for getting access. "CM Modified RSI MFI" search it for the base and almost similar indicator without my additions. This script will be available only for my students at the time being. like other scripts, if the learning material will be ready i will be announce in comment section, and like others, again, if i decide to sell this separated from courses i will announce in the comment section too.
Trader Set - Fisher CycleUnfortunately, the fihser transform's formula has specifications that are not compatible with newer versions of pine script (calling mutable variables on security function).
So, I had to separate this section of "Cycle" script to it's own little world and remove the versioning from the script.
That, means that i can't even write the name of the oscillator on the right hand side (show_last is not there in older versions).
Welcome to the world of pine script and haphazard updates of trading view without thinking about consequences of their new move !
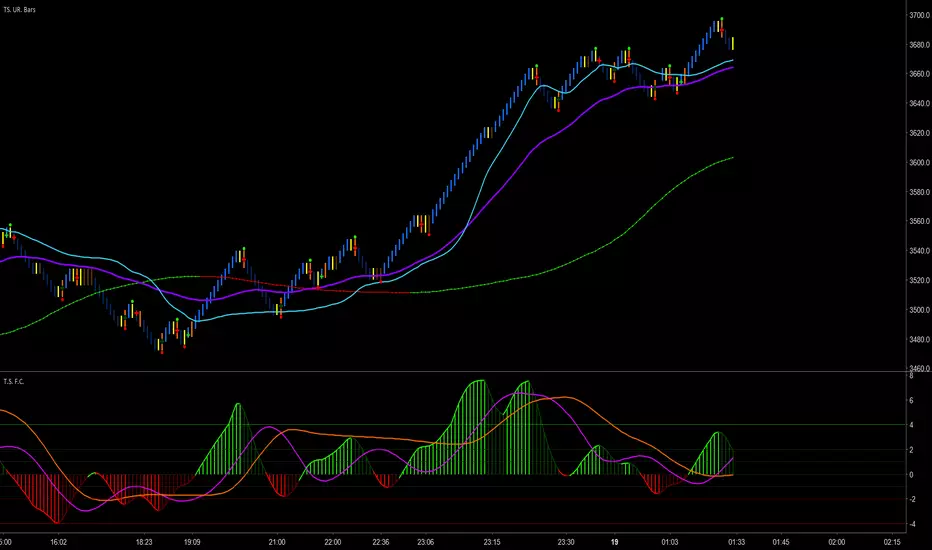
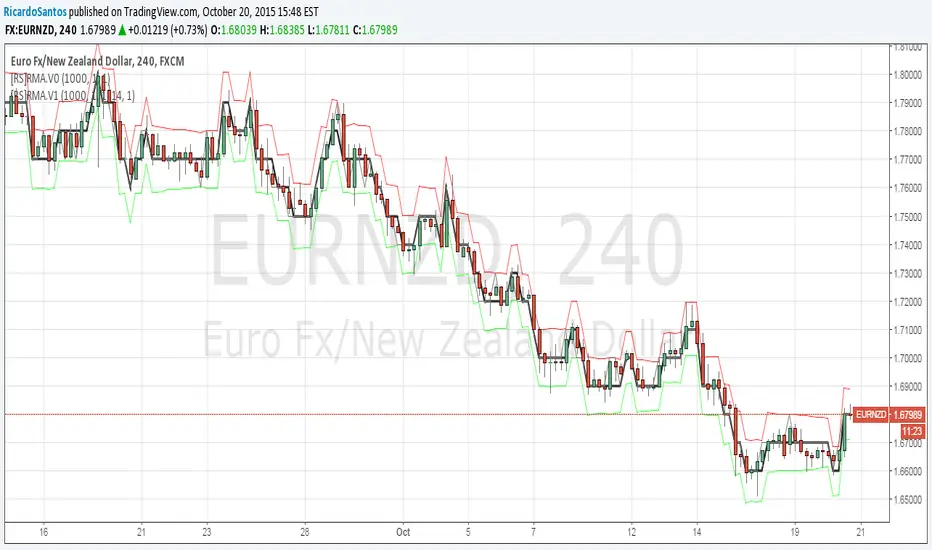
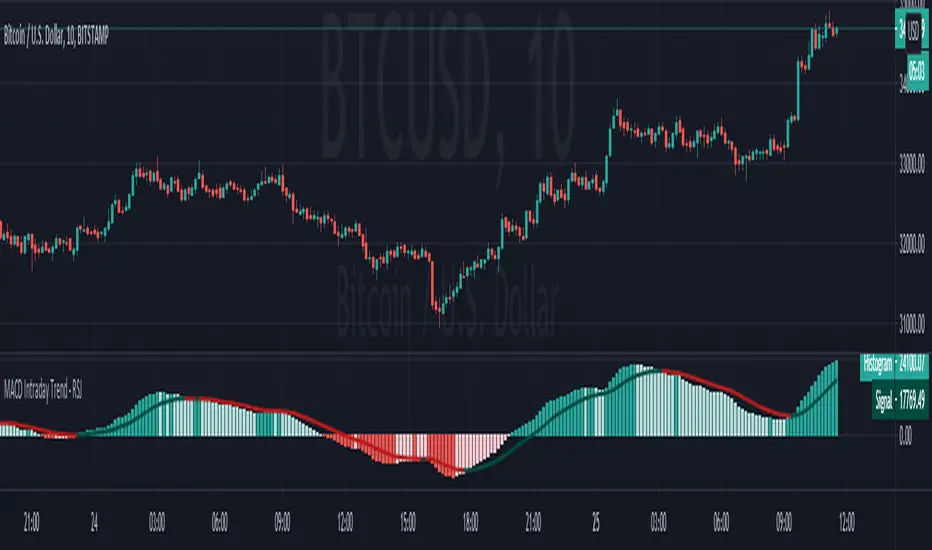
MACD Intraday Trend - RSJMACD Intraday Trend is an Indicator developed through an adaptation made of the original MACD created by Gerald Appel in the 1960s.
Through years of trading it was observed that by changing the parameters of the MACD with Fibonacci proportions we achieve a better presentation of the continuity of the trend movements, making that it is possible to more efficiently detect the beginning and end of a price trend.
Due to its efficiency in detecting price trends, it is also possible to identify very clearly the divergences of tops and bottoms, thus taking better advantage of trading opportunities.
-> Every time the histogram is positive and crosses the signal line down there is a high probability that an uptrend will end and a downtrend will start.
-> Every time the histogram is negative and crosses the signal line up there is a high probability of ending a downtrend and starting an uptrend.
The Indicator MACD Intraday Trend works with any currency pair, at any candlesticks timeframe and with Renko charts.
The Indicator has an amazing performance on Renko charts.
------------------------------------------------------------------------------------------------------------------------------------------------------------------------
MACD Intraday Trend é um Indicador desenvolvido através de uma adaptação feita do MACD original criado por Gerald Appel nos anos 1960.
Através de anos de trading foi observado que alterando os parâmetros do MACD com proporções de Fibonacci conseguimos uma melhor apresentação de continuidade dos movimentos de tendência, fazendo com que seja possível detectar de forma mais eficiente o início e fim de uma tendência de preços.
Devido sua eficiência em detecção de tendências de preços é possível também identificar com muita clareza as divergências de topos e fundos, desta forma aproveitando melhor as oportunidades de trading.
-> Toda vez que o histograma estiver positivo e cruzar a linha de sinal para baixo existe uma alta probabilidade de fim de uma tendência de alta e início de uma tendência de baixa.
-> Toda vez que o histograma estiver negativo e cruzar a linha de sinal para cima existe uma alta probabilidade de fim de uma tendência de baixa e início de uma tendência de alta.
O Indicador MACD Intraday Trend funciona com qualquer par de moedas, em qualquer tempos gráficos com candlesticks e gráficos do tipo Renko.
O Indicador tem uma performance surpreendente em gráficos do tipo Renko.
Weis Wave ChartThis indicator is based on the Weis Wave described by David H. Weis in his book Trades About to Happen: A Modern Adaptation of the Wyckoff Method, more info how to use this indicator can be found in this video . The Weis Wave is an adaptation of Richard D. Wyckoff’s method Wave Charts. It works in all time periods and can be applied to all asset types.
Unlike other implementations I found here on TradingView, this implementation make use of a Renko-like zig zag pattern, very similar to how it is described in David H. Weis' book. The settings for the zig zag pattern are very similar to the standard Renko settings here on TradingView, in the "Renko Assignment Method" you either chose "ATR" or "Traditional" (read more about it here ). The ATR length or the brick size is then entered in the textbox "Value". You can also chose another setting in the "Renko Assignment Method" drop down named "Part of Price" which calculate the brick size from the current close and divide it by the value in the text box "Value". It is also possible to chose if the zig zag pattern shall use the high/low, the open/close or just the close as the most extreme values in its calculation, you select this in the drop down "Price Source".
TradingView's pine script does currently not support to print non-static text on the chart, so it is not possible at this point to write out the volume on the zig zag chart. It is also not possible to have both an overlay and separate chart pane in the same indicator, therefor this indicator is split up in two.
You can find the volume indicator here:

Weis Wave VolumeThis indicator is based on the Weis Wave described by David H. Weis in his book Trades About to Happen: A Modern Adaptation of the Wyckoff Method, more info how to use this indicator can also be found in this video . The Weis Wave is an adaptation of Richard D. Wyckoff’s method Wave Charts. It works in all time periods and can be applied to all asset types. For assets that do not support volume Weis propose in his book to use the true range instead, so if you want to use this indicator for assets that do not support volume, make sure to enable the checkbox "Use True Range instead of Volume".
Unlike other implementations I found here on Trading, this implementation make use of a Renko-like zig zag pattern, very similar to how it is described in David H. Weis' book. The settings for the zig zag pattern are very similar to the standard Renko settings here on TradingView, in the "Renko Assignment Method" you either chose "ATR" or "Traditional" (read more about it here ). The ATR length or the brick size is then entered in the textbox "Value". You can also chose another setting in the "Renko Assignment Method" drop down named "Part of Price" which calculate the brick size from the current close and divide it by the value in the text box "Value". It is also possible to chose if the zig zag pattern shall use the high/low, the open/close or just the close as the most extreme values in its calculation, you select this in the drop down "Price Source". If you want the price to oscillate around a zero value, enable the "Oscillating" checkbox.
TradingView's pine script does currently not support to print non-static text on the chart, so it is not possible at this point to write out the volume on the zig zag chart. It is also not possible to have both an overlay and separate chart pane in the same indicator, therefor this indicator is split up in two.
You can find the zig zag indicator here:

FTX Index Advance Decline LineAs of publishing, all the tickers from FTX with the word "index" in it, plus bitcoin.
This is your regular ADL except instead of hundreds in the basket you've got them condensed into 7 (for now) and in open/close candle form instead of a line.
I'm a bit disappointed because I thought I'd lever more utility from indexes. It may just need some tweaking.
Doesn't it look like Renko?
Some notes:
Reason why it expands:
Total number of constituents is a static 7, to fix that use time to change the total variable based on dates of introduction.
Reallly looks like Renko:
Renko with ATR, length 14, hourly chart.

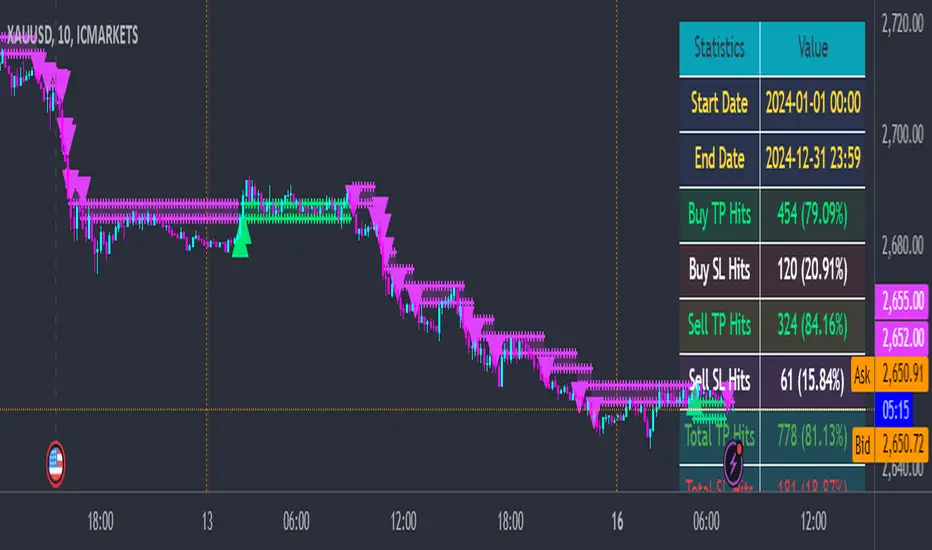
Quantum ChronoRenko Dynamics Edge - Traditional### **Quantum ChronoRenko Dynamics Edge - Traditional**
**Description:**
The **Quantum ChronoRenko Dynamics Edge - Traditional** is an advanced Renko-based indicator designed for precision trading. It leverages the power of Renko charts to detect price movements, highlight critical trading signals, and dynamically track profit and risk levels. This indicator is built with modern trading strategies in mind, offering robust tools for all traders, from beginners to professionals.
**Key Features:**
1. **Renko-Based Signal Generation**:
- Detects **Buy Signals** when the price closes above the Renko high level.
- Detects **Sell Signals** when the price closes below the Renko low level.
- Ensures signals are non-repainting and confirmed on bar closures.
2. **Take Profit (TP) and Stop Loss (SL) Tracking**:
- Automatically calculates and plots TP and SL levels for every signal.
- Dynamic levels are displayed directly on the chart for better decision-making.
3. **Advanced Signal Management**:
- Prevents duplicate signals within the same Renko range.
- Resets signal conditions when a new Renko range is formed.
4. **Visual Enhancements**:
- Renko high and low levels are plotted with customizable colors and styles.
- TP and SL levels are marked with distinct cross shapes for clarity.
- Optional fill between Renko levels to highlight price ranges.
5. **Real-Time Alerts**:
- Generates alerts for Buy and Sell signals when a candle closes above or below the Renko levels.
- Alerts are designed to help traders react quickly to opportunities.
6. **Comprehensive Statistics**:
- Tracks the number of Buy/Sell signals.
- Calculates the number of TP and SL hits for each signal type.
- Displays detailed percentages and totals in an easy-to-read table.
**Key Benefits**:
- **Non-Repainting Logic**: Ensures stable and reliable signals based on confirmed price movements.
- **Customizability**: Flexible settings for Renko brick size, TP/SL values, and visual enhancements.
- **Professional-Level Insights**: Provides detailed statistics for tracking strategy performance.
**Use Cases**:
- Perfect for intraday and swing traders who rely on Renko charts for clear trend signals.
- Suitable for identifying key breakout opportunities and managing trades with precise TP/SL levels.
Example Usage:
For daily scalping, set the following parameters:
Brick Size: 3
Time Frame: 10 Minutes
This setup provides clean trend signals and dynamic TP/SL tracking for short-term trades.
**Why "Traditional"?**
This version uses the **Traditional Renko method**, ensuring consistent price-based calculations that align with professional trading strategies.
---
**Disclaimer**:
This indicator is a tool to aid trading decisions but does not guarantee profits. Always use proper risk management.
---
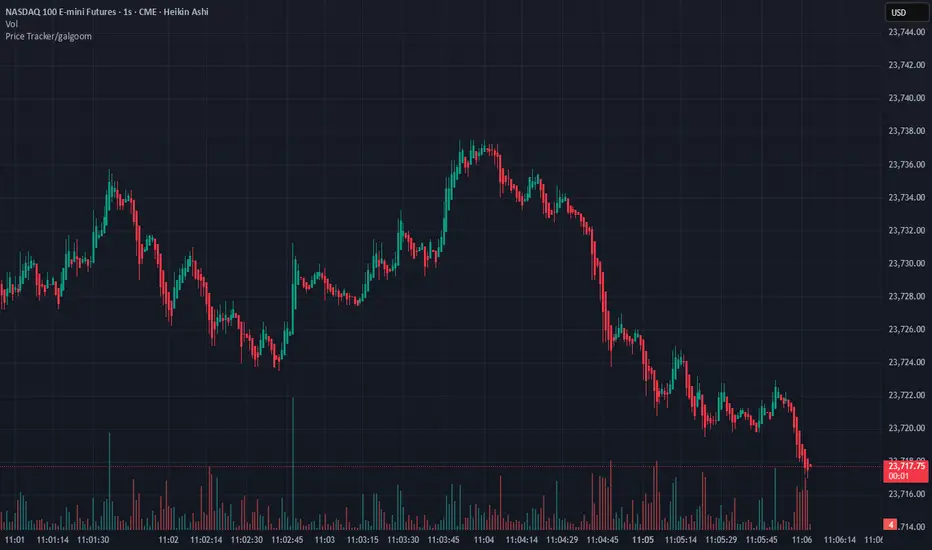
Price Tracker/galgoomThis indicator is designed for Renko chart traders who want to combine price action relative to a key line (qLine) with Moneyball buy/sell signals as a confirmation. It helps filter trades so you only get signals when both conditions align within a chosen time window.
How It Works
First Event – Price Trigger
Detects when the Renko close crosses above/below your selected qLine plot from the qPro indicator.
You can choose between:
Cross – only triggers on an actual crossover/crossunder.
State (Close) – triggers whenever price closes above/below qLine.
Second Event – Moneyball Confirmation
Waits for Moneyball’s Buy Signal (for long) or Bear/Sell Signal (for short) plot to fire.
You select the exact Moneyball plot from the source menu.
You can specify how the Moneyball signal is interpreted (== 1, >= 1, or any nonzero value).
Sequential Logic
The Moneyball signal must occur within N Renko bricks after the price event.
The final buy/sell signal is printed on the Moneyball bar.
Key Features
Works natively on Renko charts.
Adjustable confirmation window (0–5 bricks).
Flexible detection for both qLine and Moneyball signals.
Customizable label sizes, arrow display, and alerts.
Alerts fire for both buy and sell conditions:
BUY: qLine ➜ Moneyball Buy
SELL: qLine ➜ Moneyball Sell
Inputs
qLine Source – Pick the qPro qLine plot.
Price Event Type – Cross or State.
Moneyball Buy/Sell Signal Plots – Select the correct plots from your Moneyball indicator.
Confirmation Window – Bars allowed between events.
Visual Settings – Label size, arrow visibility, etc.
Use Case
Ideal for traders who:
Want a double-confirmation entry system.
Use Renko charts for cleaner trend detection.
Already have qPro and Moneyball loaded, but want an automated, rule-based confluence check.
38 minutes ago
Release Notes
This indicator is designed for Renko chart traders who want to combine price action relative to a key line (qLine) with Moneyball buy/sell signals as a confirmation. It helps filter trades so you only get signals when both conditions align within a chosen time window.
How It Works
First Event – Price Trigger
Detects when the Renko close crosses above/below your selected qLine plot from the qPro indicator.
You can choose between:
Cross – only triggers on an actual crossover/crossunder.
State (Close) – triggers whenever price closes above/below qLine.
Second Event – Moneyball Confirmation
Waits for Moneyball’s Buy Signal (for long) or Bear/Sell Signal (for short) plot to fire.
You select the exact Moneyball plot from the source menu.
You can specify how the Moneyball signal is interpreted (== 1, >= 1, or any nonzero value).
Sequential Logic
The Moneyball signal must occur within N Renko bricks after the price event.
The final buy/sell signal is printed on the Moneyball bar.
Key Features
Works natively on Renko charts.
Adjustable confirmation window (0–5 bricks).
Flexible detection for both qLine and Moneyball signals.
Customizable label sizes, arrow display, and alerts.
Alerts fire for both buy and sell conditions:
BUY: qLine ➜ Moneyball Buy
SELL: qLine ➜ Moneyball Sell
Inputs
qLine Source – Pick the qPro qLine plot.
Price Event Type – Cross or State.
Moneyball Buy/Sell Signal Plots – Select the correct plots from your Moneyball indicator.
Confirmation Window – Bars allowed between events.
Visual Settings – Label size, arrow visibility, etc.
Use Case
Ideal for traders who:
Want a double-confirmation entry system.
Use Renko charts for cleaner trend detection.
Already have qPro and Moneyball loaded, but want an automated, rule-based confluence check.
Auto Levels & Smart Money [ #Algo ] Pro : Smart Levels is Smart Trades 🏆
"Auto Levels & Smart Money Pro" indicator is specially designed for day traders, pull-back / reverse trend traders / scalpers & trend analysts. This indicator plots the key smart levels , which will be automatically drawn at the session's start or during the session, if specific input is selected.
🔶 Usage and Settings :
A :
⇓ ( *refer 📷 image ) ⇓
B :
⇓ ( *refer 📷 images ) ⇓
🔷 Features :
a : automated smart levels with #algo compatibility.
b : plots auto SHADOW candle levels Zones ( smart money concept ).
c : ▄▀ RENKO Emulator engine ( plots Non-repaintable #renko data as a line chart ).
d : session 1st candle's High, Low & 50% levels ( irrespective of chart time-frame ).
e : 1-hour High & Low levels of specific candle, ( from the drop-down menu ), for any global market symbols or crypto.
f : previous Day / Week / Month, chart High & Low.
g : pivot point levels of the Daily, Weekly & Monthly charts.
h : 2 class types of ⏰ alerts ( only signals or algo execution ).
i : auto RENKO box size (ATR-based) table for 30 symbols.
j : auto processes " daylight saving time 🌓" data and plots accordingly.
💠Note: "For key smart levels, it processes data from a customized time frame, which is not available for the *free Trading View subscription users , and requires a premium plan." By this indicator, you have an edge over the paid subscription plan users and can automatically plot the shadow candle levels and Non-repaintable RENKO emulator for the current chart on the free Trading View Plan at any time frame .
⬇ Take a deep dive 👁️🗨️ into the Smart levels trading Basic Demonstration ⬇
▄▀ 1: "RENKO Emulator Engine" ⭐ , plots a noiseless chart for easy Top/Bottom set-up analysis. 10 types of 💼 asset classes options available in the drop-down menu.
LTP is tagged to current RSI ➕ volatility color change for instant decisions.
⇓ ( *refer 📷 image ) ⇓
🟣 2: "Shadow Candle Levels and Zones" will be drawn at the start of the session (which will project shadow candle levels of the previous day), and it comes with a zone. which specifies the Supply and Demand Zone area. *Shadow levels can be drawn for the NSE & BSE: Index/Futures/Options/Equity and MCX: Commodity/FNO market only.
⇓ ( *refer 📷 image ) ⇓https://www.tradingview.com/x/SIskBm77/
🟠 3: plots "Session first candle High, low, and 50%" levels ( irrespective of chart time-frame ), which a very important levels for an intraday trader with add-on levels of Previous Day, Week & Month High and Low levels.
⇓ ( *refer 📷 image ) ⇓
🔵 4: plots "Hourly chart candle" High & Low levels for the specific candles, selected from the drop-down menu with Pivot Points levels of Daily, Weekly, Monthly chart.
Note: The drop-down menu gives a manual selection of the hour candles for all "🌐 Crypto / XAU-USD / Forex / USA".
ex: "2nd hr" will give the session's First hour candle "High & Low" level.
⇓ ( *refer 📷 image ) ⇓
🔲 5: "Auto RENKO box size" ( ATR based ) : This indicator is specially designed for 'Renko' trading enthusiasts, where the Box size of the ' Renko chart ' for intraday or swing trading, ( ATR based ) , automatically calculated for the selected ( editable ) symbols in the table.
⇓ ( *refer 📷 image ) ⇓
*NOTE :
Table symbols are for NSE/BSE/USA.
Symbols are Non-editable (fixed).
Table Symbols for MCX only.
Table Symbols for XAU & 🌐CRYTO.
⏰ 6: "Alert functions."
⇓ ( *refer 📷 image ) ⇓
◻ : Total 8 signal alerts can be possible in a Single alert.
◻ : Total 12 #algo alerts , ( must ✔ tick the Consent check box for algo and alerts execution/trigger ).
💹 Modified moving average line. Includes data from both the exponential and simple moving average.
This Indicator will work like a Trading System . It is different from other indicators, which give Signals only. This script is designed to be tailored to your personal trading style by combining components to create your own comprehensive strategy . The synergy between the components is key to its usefulness.
It focuses on the key Smart Levels and gives you an Extra edge over others.
✅ HOW TO GET ACCESS :
You can see the Author's instructions to get instant access to this indicator & our premium suite. If you like any of my Invite-Only indicators, let me know!
⚠ RISK DISCLAIMER :
All content provided by "TradeWithKeshhav" is for informational & educational purposes only.
It does not constitute any financial advice or a solicitation to buy or sell any securities of any type. All investments / trading involve risks. Past performance does not guarantee future results / returns.
Regards :
TradeWithKeshhav & team
Happy trading and investing!

Point and Figure (PnF) RSIThis is live and non-repainting Point and Figure Chart RSI tool. The script has it’s own P&F engine and not using integrated function of Trading View.
Point and Figure method is over 150 years old. It consist of columns that represent filtered price movements. Time is not a factor on P&F chart but as you can see with this script P&F chart created on time chart.
P&F chart provide several advantages, some of them are filtering insignificant price movements and noise, focusing on important price movements and making support/resistance levels much easier to identify.
P&F RSI is calculated and shown by using its own P&F engine.
If you are new to Point & Figure Chart then you better get some information about it before using this tool. There are very good web sites and books. Please PM me if you need help about resources.
Options in the Script
Box size is one of the most important part of Point and Figure Charting. Chart price movement sensitivity is determined by the Point and Figure scale. Large box sizes see little movement across a specific price region, small box sizes see greater price movement on P&F chart. There are four different box scaling with this tool: Traditional, Percentage, Dynamic (ATR), or User-Defined
4 different methods for Box size can be used in this tool.
User Defined: The box size is set by user. A larger box size will result in more filtered price movements and fewer reversals. A smaller box size will result in less filtered price movements and more reversals.
ATR: Box size is dynamically calculated by using ATR, default period is 20.
Percentage: uses box sizes that are a fixed percentage of the stock's price. If percentage is 1 and stock’s price is $100 then box size will be $1
Traditional: uses a predefined table of price ranges to determine what the box size should be.
Price Range Box Size
Under 0.25 0.0625
0.25 to 1.00 0.125
1.00 to 5.00 0.25
5.00 to 20.00 0.50
20.00 to 100 1.0
100 to 200 2.0
200 to 500 4.0
500 to 1000 5.0
1000 to 25000 50.0
25000 and up 500.0
Default value is “ATR”, you may use one of these scaling method that suits your trading strategy.
If ATR or Percentage is chosen then there is rounding algorithm according to mintick value of the security. For example if mintick value is 0.001 and box size (ATR/Percentage) is 0.00124 then box size becomes 0.001.
And also while using dynamic box size (ATR or Percentage), box size changes only when closing price changed.
Reversal : It is the number of boxes required to change from a column of Xs to a column of Os or from a column of Os to a column of Xs. Default value is 3 (most used). For example if you choose reversal = 2 then you get the chart similar to Renko chart.
Source: Closing price or High-Low prices can be chosen as data source for P&F charting.
you can use PNF type RSI or RENKO type RSI.
What is the difference between them?
While calculating PNF type RSI, the script checks last X/O column's closing price but when using RENKO type RSI the scipt calculates RSI on every price changes according to number of boxes. and also with RENKO type RSI, calculation is made for each boxes on price changes.
Important note if you use this PNF script with reversal = 2 then you get RENKO chart. So, with this RENKO chart better to use RENKO type RSI ;)

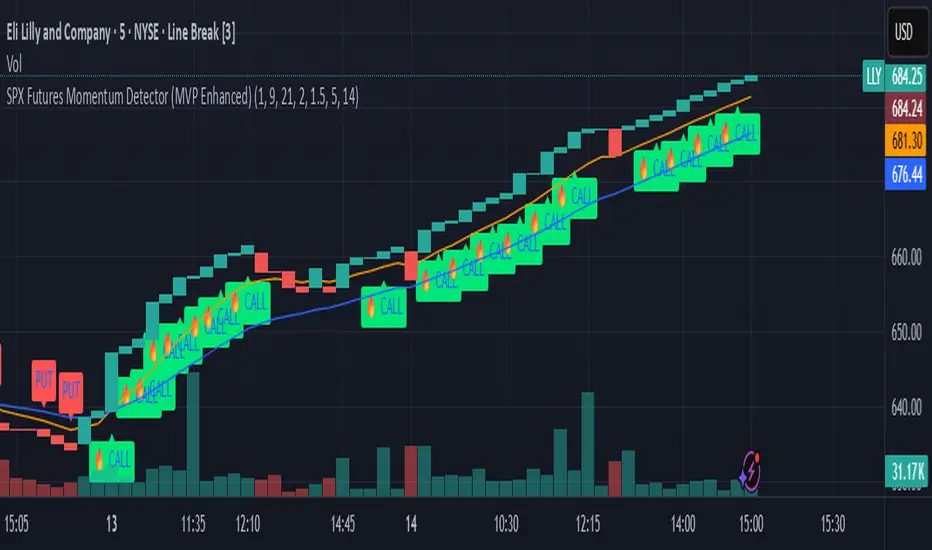
SPX Futures Momentum Detector (MVP Enhanced)Our SPX Futures Momentum Detector is a precision trading tool built for professional futures and options traders.
Optimized for SPX and ES/MES futures, this indicator identifies high probability momentum entries, filters noise, and provides clear CALL/PUT signals for rapid decision-making.
It layers proprietary filters to reduce false positives in volatile or choppy conditions.
This enhanced version leverages our proprietary MVP Momentum framework, incorporating Renko-style brick simulation and momentum confirmation layers.
It is designed for scalping and short-term swing strategies in highly liquid markets.
**Key Features**
• Proprietary momentum detection logic
• Optimized for 5m, 15m, and Renko charts
• Works with SPX, ES, and MES futures contracts and any highly liquid option contracts
• CALL/PUT labeling with A+ setup classification (Hot CALL Signal)
• Zero repaint logic for reliable backtesting
**What it does**
• Detects momentum inflections on SPX/ES/MES using a Renko-style brick simulation + dual EMA context.
• Designed for 1m–5m timeframes; exceptional clarity on Line Break charts.
• Signals: CALL (momentum up), PUT (momentum down). No lookahead; signals print on confirmed bar close.
**How to use**
• Recommended charts: SPX, ES, MES (futures) or any highly liquid options charts.
• Recommended chart types: Line Break for clarity; standard candles for entry points.
• Timeframes: 1m or 5m (scalping to intraday).
• Add alerts: “CALL Signal” and “PUT Signal”, set to “Once per bar close.”
**Inputs explained**
• Fast EMA / Slow EMA – Short/medium trend filters for momentum context.
• Renko Box Size ($) – Sensitivity of the brick simulation (larger = fewer but higher-quality signals).
• Confirmation Bars – Ensures price follow-through (filters weak trends).
• Volume Breakout Multiplier – Confirms breakouts with significant volume increase.
• Consolidation Bars – Filters out sideways action before a momentum shift.
**Risk & limitations**
• Momentum tools perform best in trending sessions. Expect fewer clean signals in chop.
• No guarantees of profit. Use with your own risk management and exit plan.
• Backtest across multiple regimes (trend, post-FOMC, month-end) before live use.
**Best practices**
• Pair with optional companion exit logic for trade management.
• Use alerts at bar close to avoid noise.
• Not recommended for full automation yet: validate broker fills, slippage, and latency.
**Disclaimers**
• Educational tool. Not financial advice. Past performance ≠ future results.
• We do not guarantee outcomes, you are responsible for your trades.
**Changelog**
v1.0 – Initial invite-only release (MVP Enhanced): Renko-style momentum + EMA filters, bar-close alerts, repaint safe security calls.