Trendy Bar Trend Color LiteLite version of the original Trendy Bar Trend Color
This will only color the candlestick body of your chart
Can be used with solid, hollow, renko, or any other chart type
Custom coloring for Highs, Lows, and consolidation is removed
Cerca negli script per "renko"

Trading Safely Market Crusher Pro IndicatorWith The Market Crusher Pro You Can Trade Options, Futures, Cryptocurrencies, Equities, Commodities, Currencies, and Stock Market Indexes.
The Market Crusher Pro Buy & Sell signals are determined utilizing our price range volatility algorithmic technical indicator designed to generate alpha.
The Market Crusher Pro Buy & Sell signals will only be visible during your specified trading times.
The Market Crusher Pro Profit Targets are determined in percentages and you can take profit up to 4 times per trade.
I suggest setting limit orders at profit targets.
To determine how much of position to close divide position size by number of profit targets
Example: If your position size is 100k and you are in a Long trade set 4 limit sell orders of 25k each at your 4 profit targets.
*Percentage of position to be closed for each trade is set to 25% however, you can adjust this to take profit 3 times by changing settings on 1st, 2nd, and 3rd profit targets to 33.3%, or 2 times by changing 1st and 2nd profit targets to 50%
Highlights:
Add to any ticker, and time frame
Specify trading times
Specify both long and short profit targets in percentages
Take profit up to 4 times per trade
Use either a fixed stop loss or a trailing stop loss or both
Set sound alerts and Syntax alerts for automated trading
Prints on the current bar in real time
DOES NOT repaint several bars after the fact
*We only use candles for trading and back testing because, Heikin Ashi, Renko, Kagi, Point & Figure, and Range produce unrealistic results.
*Back test results below are based on a initial capital of $5000 and Trade using 10% of initial capital.
Please Note: For forex trading to enter a trade on EURUSD for example the spread is typically 1.2-2.0 pips to enter a trade so you are not charged a commission on every market buy or sell or for limit orders set at profit targets. We are not able to input this into back test settings.
Example: If you open a 100k position it will cost you $12-$20 assuming the spread is 1.2 to 2.0 pips
Please Note: All users get access to weekly trading and strategy building sessions and a interactive Q&A. You can get more information on these benefits as well as get access to the strategy builder by clicking the MC PRO link listed in signature section below

LT Trend 2.0This is a short term trend based indicator which colours the bars blue and red indicating the probable trend: blue indicating the probable upward (or “bullish”) trend and red indicating the probable downward (or “bearish”) trend.
The first criteria (called “volatility trend) colours the bars (blue or red) based on one of the indicators which we use that measures momentum and the key support/resistance level. When price is closed above this level, the bars are coloured blue and when price closes below this level the price bars turn red. The purpose is to show the likely trends, swing in price and path of least resistance, specially in the short term (depending on the timeframe chosen).
The second criteria (optional) uses the average range of the last 7 bars (although the period can be changed by the user). It colours the bars blue or red based on the average range and momentum bias of the past 7 bars. In this respect, it is slower to react to the constant “noise” and volatility in the price action by smoothing out a lot of the noise (depending on which setting one has chosen e.g. period of default 7 or lower). If the volatility or range of the next bar exceeds the average range of the previous 7 bars in an opposite direction (e.g. opposite directional momentum), the colour of the bars may change. For example, if the previous bar has been blue, and the range of the next bar is greater than the average of the previous 7 bars in the downward direction, the colour of the bars could likely turn red. This second (optional) criteria can be chosen by deselecting (unticking) the “volatility trend” criteria in the settings.
The main idea behind the indicator is to be able to observe the probable short term trends in the price, and to smooth out a lot of the bar-by-bar (or candle-by-candle) volatility and up/down action. If the bars are blue, this is a potentially bullish sign, as it often means that “bulls” may have the edge. The reverse is the case for red bars, as it is a bearish sign – or that “bears” may have the edge. Usually 2 consecutive bars of the opposite colour can signify a potential trend change (although one bar of the opposite colour can also suffice).
The indicator also incorporates a “trend following pivot” – shown by a yellow dot. This indicator waits for a pullback (or retracement) to either the 21 and 34 EMA - shown by blue and pink EMA lines respectively - and when the price bounces off or “pulls away” from either of these EMAs by a certain degree, the indicator then shows the yellow trend following pivot as a yellow dot. For example, if price is in an uptrend, then price pulls back to the 21 or 34 EMA, and then bounces off either of these levels by a certain extent, we may then see a yellow dot (or pivot) at the lowest most recent point (which would then become support). The yellow dot (or pivot) can indicate that the uptrend could potentially continue, provided price remains above the pivot (yellow dot). Similarly, in a downtrend example, if price pulls back to either the 21 or 34 EMA, then price gets rejected from these levels by a certain extent (so that price then falls back below these EMAs again), we may see a yellow dot at the highest recent point (which would become resistance). The yellow dot (or pivot) can indicate that the downtrend could potentially continue provided price remains below the pivot (yellow dot).
The “ultra” overbought and oversold signal colours the bars orange when price hits an extreme “overbought” or “oversold” level. Usually the price tends to reverse direction or start a correction when it reaches an extreme “overbought” or “oversold” level. Of course, it is possible for the price to ignore overbought/oversold readings – and if the price ignores the orange “ultra” signal by continuing in its original direction, it can mean that the momentum or trend is stronger than originally anticipated. Often the orange “ultra” signal can also mean that it may be time to tighten stops (specially as the risk or probability of a pullback or reversal increases).
Chartists should be aware of the probabilistic and uncertain nature of price action and the markets, and therefore prepare to limit and control any potential risks.
The indicator can be used on the charts of the majority of markets (e.g. stocks, indices, ETFs, currencies, cryptocurrencies, precious metals, commodities etc.) and any timeframe. It should be noted that the degree of noise and randomness increases significantly on lower timeframes. So the lower the timeframe that is chosen (e.g. 15-min or lower) the greater the degree of noise and randomness and therefore the higher the frequency of false signals or whipsaws. The indicator can be applied to candlestick, bar, line, line break, range and renko charts.
If you would like access, please send me a PM on Tradingview.

Volume AccumulationThis simple indicator shows the cumulative volume within the current uptrend or uptrend. The bull&bear trend is detected by a change in the direction of the candles.This indicator works particularly well with Heikin Ashi and Renko charts.Alternatively, you can use a moving average direction to indicate the direction of the trend.You can select from several different types of moving averages, each MA line can be of a different type: WMA Weighted Moving Average, VWMA Volume Weighted Moving Average, SMA Simple Moving Average, EMA Exponential Moving Average, and more ...

Up/Down Trend MarkerA simple indicator of trend by using 3 EMAs of multiplies of 2, 5 and 10, filtered by standard positive/negative directional movements (DM) which are the base of Average Directional Index (ADX).
The "Trend Strength" option is included to set the EMA multipliers and also the variation between DM+ and DM- which interpret the trend as a weak or a strong one.
Note that the markers only point to almost the beginning of the trends and just change the direction when the opposite trend is detected.
Feel free to send me your opinions.

Ichimoku Cloud - AlertsIchimoku cloud
IC is a trend - following system with an indicator similar to moving averages
It predicts price movements
Offers a unique perspective of support and resistance levels.
Conversion Line (Turning Line)
- Measures Short Term Trend
- SIgnals an area of minor support and resistance
Base Line (Confirmation Line)
Measures Medium term trend
Used as Trailing Stop Level.
Lagging Span (Lagging Line)
Used for Confirmation of signals
Can also serve as Support and Resistance Level
Kumo Cloud
Formed of two lines: Span A (Green Line) and Span B (Red Line)
Dynamic Support and Resistance .
HOW TO READ ICHIMOKU INDICATOR
Conversion Line
If the Market Price is above the Conversion Line = Short Term Upward Movement
If the Market Price is below the Conversion Line = Short Term Downward Movement
Increasing Conversion Line = Upward Short Term Trend
Decreasing Conversion Line = Downward Short Term Trend
Base Line
If the Market Price is above the baseline = Medium - term upward trend
If the Market price is below the baseline = Medium - Term downward Trend
Increasing Base Line = Upward Medium term trend
Decreasing Base Line = Downward Medium Term Trend
Lagging Span
The Evolution of the current price action in relation to previous price action
If the Lagging span is above the current price = Bullish Bias
If the Lagging span is below the current price = Bearish Bias
Lagging span near the current price = Trading range
Kumo Cloud
Dynamic Support and Resistance based upon price action.
The longer the price stays below/above the Kumo cloud, the STRONGER the trend is.
When the cloud is wide, the expected support or resistance is strong
When the cloud is thin, the expected support or resistance is weak
Never trade inside the KUMO CLOUD.
HOW TO TRADE WITH ICHIMOKU CLOUD
Baseline and conversion Line crossover (Lagging Span as a Filter)
crossover(conversion line, baseline) = Buy
crossunder(conversion line, baseline) = Sell
FILTER
crossover(conversion line, baseline) and lagging span is Bullish (i.e above the price) = Buy
Crossunder(conversion line, baseline) and lagging span is Bearish (i.e below the price) = Sell
2. Baseline - Conversion line crossover (Kumo cloud Filter)
crossover(conversion line, baseline) above the Kumo Cloud = Strong Buy
crossover(conversion line, baseline) below the Kumo cloud = Weak Buy
crossunder(conversion line, baseline) below the Kumo Cloud = Strong Sell
crossunder(conversion line, baseline) above the Kumo Cloud = Weak Sell
3. Kumo Cloud Breakout
When the price enters the Kumo Cloud, and breaks its Upper wall upward = Bullish Signal
When the price enters the Kumo Cloud, and breaks its Lower wall downward = Bearish Signal
4. Kumo Cloud Crossover
When Span A cuts the Span B from below to the upside and prices are positioned above the Kumo Cloud = Strong Buy Signal
When Span A cuts the Span B from upside to the bottom and the prices are positioned below the Kumo Cloud = Strong Sell
When Span A cuts Span B from bottom to the upside and prices are positioned below the Kumo Cloud = Weak Buy Signal
When Span A cuts Span B from the upside to the bottom and the prices are positioned above the Kumo Cloud = Weak Sell Signal.
NOTE:- Some of the signals collide with each other, but they collide for the same call, so shouldn't really be a problem overall. Let me know if you have any suggestions to nullify the trading Range. Though I do plan on adding my Renko code to it for filtering out Trading Range.

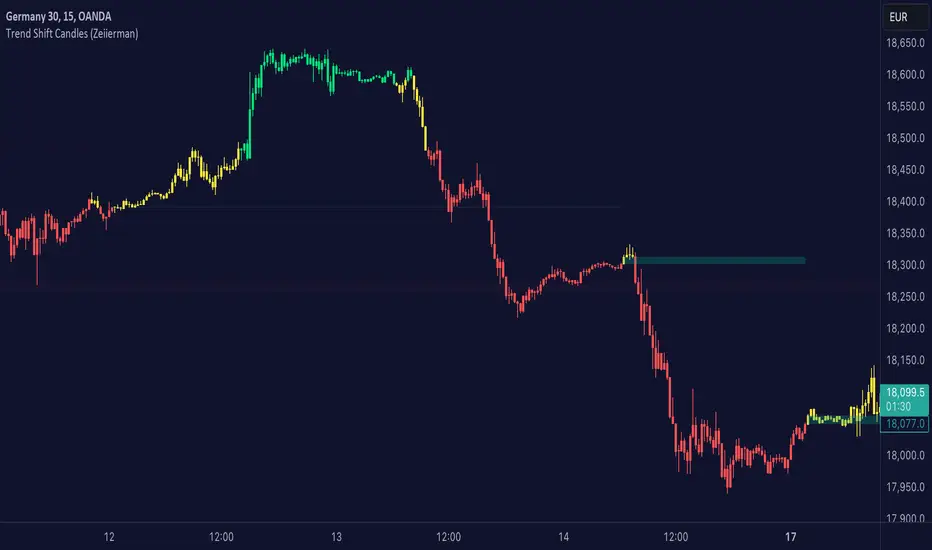
Trend shift Candles (Expo)Trend shift Candles (Expo) identifies where the market characteristics change. Trend shifts often occur in these areas. This is visualized with white candlesticks and Zones.
-> When the market enters a positive trend the candlesticks become green and when the market enters a negative trend the candlesticks become red.
-> The user can choose which timeframe to use. Vwap can be enabled as an input source instead of using price.
-> Please play around with the settings, I haven't set them to any specific values.
HOW TO USE
1. Use the indicator to identify the direction of the trend.
2. Use the indicator to identify trend changes.
-> Visual Order should be set to "Bring to Front" in order to see the color of the candles.
INDICATOR IN ACTION
4 hour chart
The indicator work on Heikin Ashi, Candles, Bars, Renko, Line Break, Kagi, and Point & Figure chart.
I hope you find this indicator useful , and please comment or contact me if you like the script or have any questions/suggestions for future improvements. Thanks!
I will continually work on this indicator, so please share your experience and feedback as it will enable me to make even better improvements. Thanks to everyone that has already contacted me regarding my scripts. Your feedback is valuable for future developments!
ACCESS THE INDICATOR
• Contact me on TradingView or use the links below
-----------------
Disclaimer
Copyright by Zeiierman.
The information contained in my scripts/indicators/ideas does not constitute financial advice or a solicitation to buy or sell any securities of any type. I will not accept liability for any loss or damage, including without limitation any loss of profit, which may arise directly or indirectly from the use of or reliance on such information.
All investments involve risk, and the past performance of a security, industry, sector, market, financial product, trading strategy, or individual’s trading does not guarantee future results or returns. Investors are fully responsible for any investment decisions they make. Such decisions should be based solely on an evaluation of their financial circumstances, investment objectives, risk tolerance, and liquidity needs.
My scripts/indicators/ideas are only for educational purposes
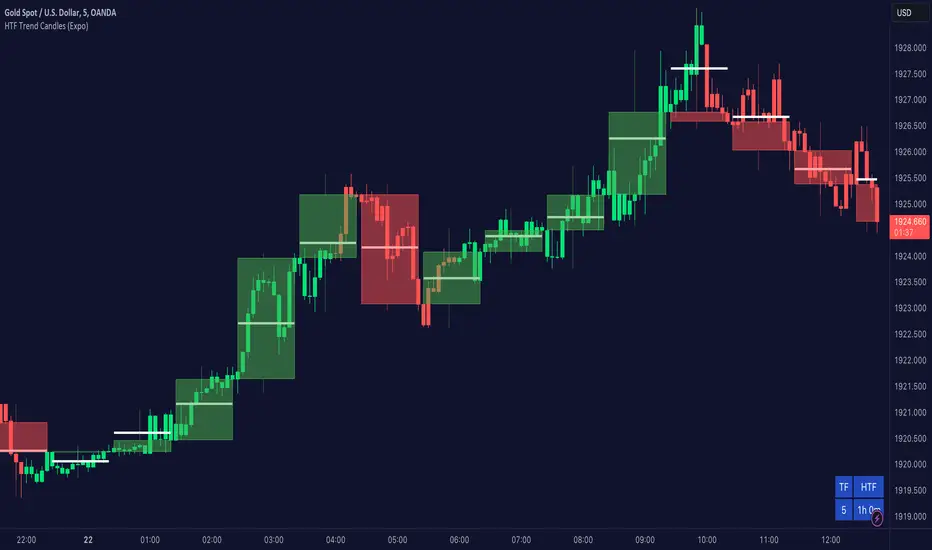
Higher TimeFrame Trend Candles (Expo) The trend is your friend!
Higher TimeFrame Candles (Expo) identifies the trend from Higher TimeFrame and displays a Zone where the trend changes. It is an effective and convenient way of getting a broader picture of the market and you will always be sure that you're trading in the same direction as the higher timeframe trend.
The user can choose which time frame to use. Heikin Ashi Trend can be displayed.
HOW TO USE
1. Use the indicator to identify the direction of the trend.
2. Use the indicator to identify trend changes.
--> Visual Order should be set to "Bring to Front" in order to see the color of the candles.
INDICATOR IN ACTION
4 hour chart
The indicator work on Heikin Ashi, Candles, Bars, Renko, Line Break, Kagi, and Point & Figure chart.
I hope you find this indicator useful , and please comment or contact me if you like the script or have any questions/suggestions for future improvements. Thanks!
I will continually work on this indicator, so please share your experience and feedback as it will enable me to make even better improvements. Thanks to everyone that has already contacted me regarding my scripts. Your feedback is valuable for future developments!
ACCESS THE INDICATOR
• Contact me on TradingView or use the links below
-----------------
Disclaimer
Copyright by Zeiierman.
The information contained in my scripts/indicators/ideas does not constitute financial advice or a solicitation to buy or sell any securities of any type. I will not accept liability for any loss or damage, including without limitation any loss of profit, which may arise directly or indirectly from the use of or reliance on such information.
All investments involve risk, and the past performance of a security, industry, sector, market, financial product, trading strategy, or individual’s trading does not guarantee future results or returns. Investors are fully responsible for any investment decisions they make. Such decisions should be based solely on an evaluation of their financial circumstances, investment objectives, risk tolerance, and liquidity needs.
My scripts/indicators/ideas are only for educational purposes
The trend changes direction.
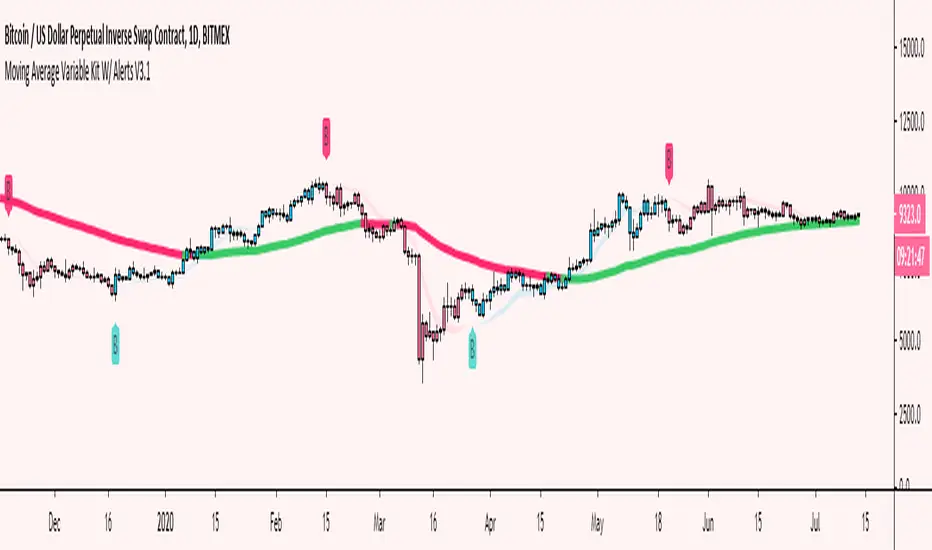
Moving Average Variable Kit W/ Alerts V3 [Moon]Create your own MA system
5 basic kinds of Moving Average types available for now
DEMA
EMA
SMA
TEMA
WMA
Mix and match moving average types and lengths.
Create your own alerts built into Tradingview.
Turn alerts or MAs off or on with 1 click.
Choose visual transparency and alert coloration - everything is customizable.
Trend candles on crossovers.
Choose your MA input source.
Create your own MA cloud or cloud ribbons.
Trend MA coloration on candle or bar interactions.
It really empowers you to experiment and create your own trading system or strategy.
Don't be afraid to use Renko or Heikin Ashi for trend spotting or reversals.
Copy built in exchange bands or indicators for an edge up on the competition or exchange users (these are heavily watched and in my opinion do affect the price action especially on smaller coins like alts).
This is Binance's default kit that you can easily make (7/25/99) SMAs.
Works well on traditional markets or Forex | Should be cross compatible on any asset or timeframe.
Turn off a majority of signals except for "buy" or "sell" alerts. Use these clusters to DCA, short, long or take profit.
Use it to monitor classic "Golden" or "Death" crosses - Set a TV alert to get a notification when it official goes off.
These are just a few of the things you can create. I encourage you to explore further.
Send me a DM if interested.
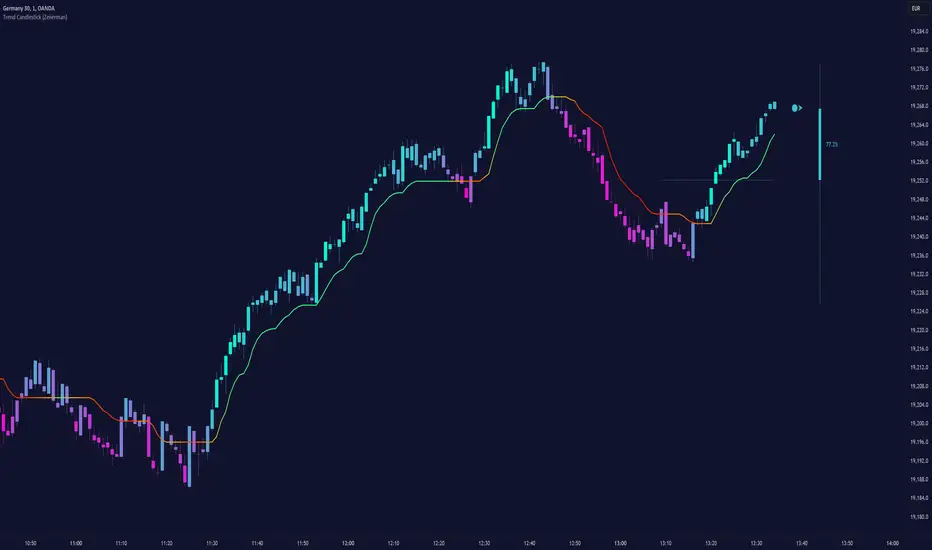
Trend Candlestick (Expo)Trading with the Trend!
Trend Candlestick (Expo) identifies the direction of the trend and Zones are displayed where the trend changes. The user has the ability to adjust the settings so that long term, as well as short term trend direction and trend changes, can be visualized.
The indicator is visual and easy to use.
HOW TO USE
1. Use the indicator to identify the direction of the trend.
2. Use the indicator to identify trend changes.
3. Use the indicator to find support and resistance levels.
--> Visual Order should be set to "Bring to Front" in order to see the color of the candles.
INDICATOR IN ACTION
15 min chart
The indicator work on Heikin Ashi, Candles, Bars, Renko, Line Break, Kagi, and Point & Figure chart.
I hope you find this indicator useful , and please comment or contact me if you like the script or have any questions/suggestions for future improvements. Thanks!
I will continually work on this indicator, so please share your experience and feedback as it will enable me to make even better improvements. Thanks to everyone that has already contacted me regarding my scripts. Your feedback is valuable for future developments!
ACCESS THE INDICATOR
• Contact me on TradingView or use the links below
-----------------
Disclaimer
Copyright by Zeiierman.
The information contained in my scripts/indicators/ideas does not constitute financial advice or a solicitation to buy or sell any securities of any type. I will not accept liability for any loss or damage, including without limitation any loss of profit, which may arise directly or indirectly from the use of or reliance on such information.
All investments involve risk, and the past performance of a security, industry, sector, market, financial product, trading strategy, or individual’s trading does not guarantee future results or returns. Investors are fully responsible for any investment decisions they make. Such decisions should be based solely on an evaluation of their financial circumstances, investment objectives, risk tolerance, and liquidity needs.
My scripts/indicators/ideas are only for educational purposes
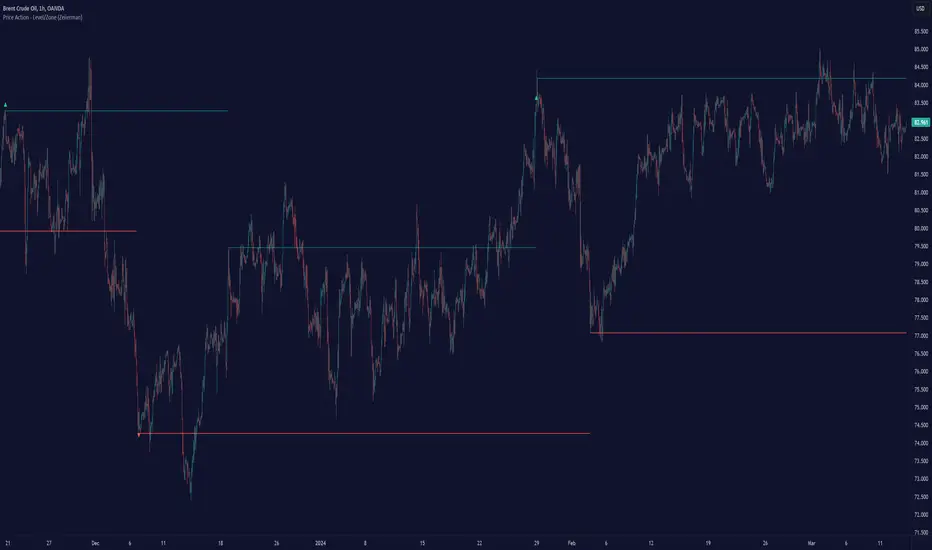
Price Action - Level/Zone (Expo)Price Action - Level/Zone (Expo) indicator identifies buying and selling pressure that has an impact on the price movement. This is visualized by a Zone, or Levels or with Barcolors depending on which settings are used.
Depending on the selected settings the indicator can identify buying and selling pressure which pushes the price further in the trend direction and it can show exhausted buyers/sellers which is seen in reversal points.
HOW TO USE
1. Use the indicator to identify buying and selling pressure.
2. Use the indicator to identify exhausted buyers and sellers.
3. Use the indicator to identify reversal points, pullbacks, or trend shifts.
4. Use the indicator to buy/short-sell breakouts of the zones.
5. Use the indicator to buy/short-sell when the price re-test the zones.
-> Try the indicator on Heikin Ashi Candles , but it works as good at any type of candlestick, bars, Renko, or line break.
INDICATOR IN ACTION
4 hour chart
4 hour chart
I hope you find this indicator useful , and please comment or contact me if you like the script or have any questions/suggestions for future improvements. Thanks!
I will continually work on this indicator, so please share your experience and feedback as it will enable me to make even better improvements. Thanks to everyone that has already contacted me regarding my scripts. Your feedback is valuable for future developments!
ACCESS THE INDICATOR
• Contact me on TradingView or use the links below
-----------------
Disclaimer
Copyright by Zeiierman.
The information contained in my scripts/indicators/ideas does not constitute financial advice or a solicitation to buy or sell any securities of any type. I will not accept liability for any loss or damage, including without limitation any loss of profit, which may arise directly or indirectly from the use of or reliance on such information.
All investments involve risk, and the past performance of a security, industry, sector, market, financial product, trading strategy, or individual’s trading does not guarantee future results or returns. Investors are fully responsible for any investment decisions they make. Such decisions should be based solely on an evaluation of their financial circumstances, investment objectives, risk tolerance, and liquidity needs.
My scripts/indicators/ideas are only for educational purposes!
Momentum FactorThis indicator provides alerts for trading opportunities the idea is based of momentum shifting in the market.
We combine this signal indicator with a system of rules to increase the probability of having a winning trade.
when combined with renko charts this signal can help you catch market breakouts
Use the link below to obtain access to this indicator.

Trend Risk Indicator (TRI)The Trend Risk Indicator is a simple bands indicator made of 2 custom averages of candlesticks ranges calculated within the variable “ BandBars ” period.
Upper and lower channel bands width can be adjusted with the “ Deviation ” variable, which act as a simple factor to enlarge the spread between them.
When Close crosses over the upper band, it is a bearish signal and candlesticks are painted in Red.
When Close crosses under the lower band, it’s a bullish signal and candlesticks are painted in Green.
One of the most interesting indicators for 1 minute scalping. Recommended to use on Renko bars.
*drag to chart and pin to scale, also remove borders from candlesticks.

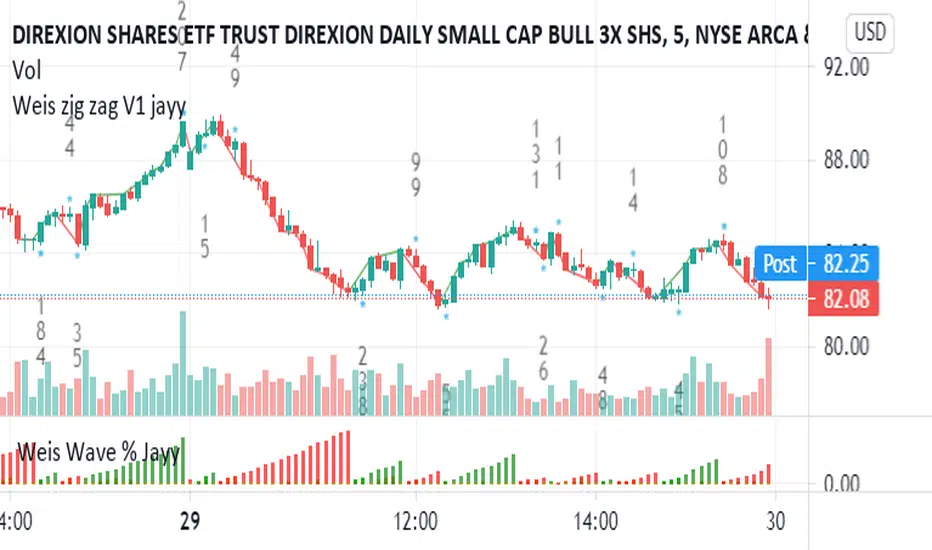
Weis pip zigzag jayyWhat you see here is the Weis pip zigzag wave plotted directly on the price chart. This script is the companion to the Weis pip wave ( ) which is plotted in the lower panel of the displayed chart and can be used as an alternate way of plotting the same results. The Weis pip zigzag wave shows how far in terms of price a Weis wave has traveled through the duration of a Weis wave. The Weis pip zigzag wave is used in combination with the Weis cumulative volume wave. The two waves must be set to the same "wave size".
To use this script you must set the wave size. Using the traditional Weis method simply enter the desired wave size in the box "Select Weis Wave Size" In this example, it is set to 5. Each wave for each security and each timeframe requires its own wave size. Although not the traditional method a more automatic way to set wave size would be to use ATR. This is not the true Weis method but it does give you similar waves and, importantly, without the hassle described above. Once the Weis wave size is set then the pip wave will be shown.
I have put a pip zigzag of a 5 point Weis wave on the bar chart - that is a different script. I have added it to allow your eye to see what a Weis wave looks like. You will notice that the wave is not in straight lines connecting wave tops to bottoms this is a function of the limitations of Pinescript version 1. This script would need to be in version 4 to allow straight lines. There are too many calculations within this script to allow conversion to Pinescript version 4 or even Version 3. I am in the process of rewriting this script to reduce the number of calculations and streamline the algorithm.
The numbers plotted on the chart are calculated to be relative numbers. The script is limited to showing only three numbers vertically. Only the highest three values of a number are shown. For example, if the highest recent pip value is 12,345 only the first 3 numerals would be displayed ie 123. But suppose there is a recent value of 691. It would not be helpful to display 691 if the other wave size is shown as 123. To give the appropriate relative value the script will show a value of 7 instead of 691. This informs you of the relative magnitude of the values. This is done automatically within the script. There is likely no need to manually override the automatically calculated value. I will create a video that demonstrates the manual override method.
What is a Weis wave? David Weis has been recognized as a Wyckoff method analyst he has written two books one of which, Trades About to Happen, describes the evolution of the now popular Weis wave. The method employed by Weis is to identify waves of price action and to compare the strength of the waves on characteristics of wave strength. Chief among the characteristics of strength is the cumulative volume of the wave. There are other markers that Weis uses as well for example how the actual price difference between the start of the Weis wave from start to finish. Weis also uses time, particularly when using a Renko chart. Weis specifically uses candle or bar closes to define all wave action ie a line chart.
David Weis did a futures io video which is a popular source of information about his method.
This is the identical script with the identical settings but without the offending links. If you want to see the pip Weis method in practice then search Weis pip wave. If you want to see Weis chart in pdf then message me and I will give a link or the Weis pdf. Why would you want to see the Weis chart for May 27, 2020? Merely to confirm the veracity of my algorithm. You could compare my Weis chart here () from the same period to the David Weis chart from May 27. Both waves are for the ES!1 4 hour chart and both for a wave size of 5.
Weis Pip Wave jayyWhat you see here is the Weis pip wave. The Weis pip wave shows how far in price a Weis wave has traveled through the duration of a Weis wave. The Weis pip wave is used in combination with the Weis cumulative volume wave. The two waves must be set to the same "wave size" and using the same method as described by Weis.
Using the traditional Weis method simply enter the desired wave size in the box "Select Weis Wave Size". In the example shown, it is set to 5 points. Each wave for each security and each timeframe requires its own wave size. Although not the traditional method a more automatic way to set wave size would be to use ATR. This is not the true Weis method but it does give you similar waves and, importantly, without the hassle of selecting a wave size for every chart. Once the Weis wave size is set then the pip wave will be shown.
I have put a zigzag of a 5 point Weis wave on the above bar chart. I have added it to allow your eye to get a better appreciation for Weis wave pivot points. You will notice that the wave is not in straight lines connecting wave tops to bottoms this is a function of the limitations of Pinescript version 1. This script would need to be in version 4 to allow straight lines. I will elaborate on the Weis pip zigzag script.
What is a Weis wave? David Weis has been recognized as a Wyckoff method analyst he has written two books one of which, Trades About to Happen, describes the evolution of the now popular Weis wave. The method employed by Weis is to identify waves of price action and to compare the strength of the waves on characteristics of wave strength. Chief among the characteristics of strength is the cumulative volume of the wave. There are other markers that Weis uses as well for example how the actual price difference between the start of the Weis wave from start to finish. Weis also uses time, particularly when using a Renko chart. Weis specifically uses candle/bar closes to define all wave action.
David Weis did a futures.io video which is a popular source of information about his method.
Cheers jayy
PS This script was published a day ago, however, I had included some links to the website of a person that uses Weis pip waves and also a dropbox link that contains the Weis wave chart for May 27, 2020, published by David Weis. Providing those links is against TV policy and so the script was hidden by TV. This is the identical script with the identical settings but without the offending links. If you want to see the pip Weis method in practice then search Weis pip wave. I have absolutely no affiliation. If you want to see Weis chart in pdf then message me and I will give a link or the Weis pdf. Why would you want to see the Weis chart for May 27, 2020? Merely to confirm the veracity of my algorithm. You could compare my chart () from the same period to the Weis chart. Both waves are for the ES!1 4 hour chart and both for a wave size of 5.

TA Basics: further "Steps" with our Moving AverageSo far in this series of posts, we have worked thru creating a basic zero-lag moving average, then moved forward all the way to coding a "Fibonacci" Weighted Moving Average.
in this post we take a look at a technique that can help traders minimize noise in the underlying data and get better insight on the changes that are happening in the data series represented by the moving average. we'll look at adding "stepping" to our Fibonacci Moving Average as an example. we introduce the Stepping Fibonacci Moving Average , or Step_FiMA
note that you can use the same technique with any plot you may have. feel free to copy or leverage the relevant parts of the script - the script is commented to make this easier.
How is this useful?
==================
with "stepping", you get your indicator to "round" the outcome into pre-specified bands or ranges. this works very similar to how, for example, range or Renko charts work. you can easily see the difference in the chart above once we look at a non-stepped and a stepping moving average of the same length side-by-side
the more granular your timeframe is, you will see the effect of the stepping clearer - here's how the same chart looks when we go into the 1-hr aggregation
Notes about this script
====================
there are couple of pieces i wanted to highlight in the script if you plan to use some of it :
1 - the step(x) function is meant to try to automatically pick the best "suitable" step size based on the range of the underlying series (for example, the closing price). these ranges i included here in the code are just my own "best choices" - you are totally welcome to adjust these ranges and the resulting step size to your own preference
2 - we applied the stepping as a user-choice. user can choose a manual entry, or "0" to get the code to automatically pick the step size, or enter -1 (or actually any value below zero) to cancel the stepping option altogether - this gives us some flexibility on how to use the stepping in an indicator
3 - very important (and somehow confusing): on the "rounding" approach:
the magic math formula that actually creates the stepping is this one
result = round(input / step) * step
now, this tells the script to "round" the result up or down (the basic rounding) -- so for example, a price of 17 with a step of 5 would be rounded (down) to 15, where as a price of 18 would be rounded "up" to 20 -- this is not the way some of us would expect or want, cause the price never reached 20 and they would want an 18 to still be rounded to 15 - and the stepping line not to show 20 *until* the price actually hits or exceeds 20 -- in that case, you would need to replace the function "round" with the function "floor" --
so the new formula becomes: floor(input / step) * step
-- in an ideal world, we can make this rounding choice a user-option in the settings -- maybe in an improved version
4 - we kept the smoothing option, and it takes place before the stepping is applied - we continue to use that smoothing to further minimize the level changes in the FiMA line.
I hope you find this script useful in your journey with technical analysis and DIY scripting, and good luck in your trading.

Fibonacci Retracement level with 10 preset cross alert.The Fibonacci retracement is also called the golden mean or golden section.
It has been used to analyze the proportions of natural objects as well as man-made systems such as financial markets.
The mathematics of the golden ratio and of the Fibonacci sequence is intimately interconnected. The Fibonacci sequence is:
1, 1, 2, 3, 5, 8, 13, 21, 34, 55, 89, 144, 233, 377, 610, 987, ....
The golden ratio is the limit of the ratios of successive terms of the Fibonacci sequence (or any Fibonacci-like sequence).
This Fibonacci retracement level indicator automatically plots 7 support and resistance levels on chart based on selected number of bars.
How it works?
It shows the Fibonacci retracement support and resistance levels for a given range and display the corresponding ratio on the right side of the levels. The price range and levels are adjustable by user, you can easily identify the major and minor support/resistance levels from the chart with your desired inputs.
Features and inputs:
Show Level Label, enable to display the level on chart.
Range, it's the number of bars used to detect the highest and lowest price. The default value is 300 it means the indicator will plot the Fibonacci retracement based on the price range of last 300 bars.
If you want to use different ratios other than the default ones, you can change them from input Level1 to Level5.
You can change the color of each level line from the following available colors: silver , gray, white, maroon, red, purple, fuchsia, green, lime, olive, yellow, navy, blue, teal, aqua, orange.
The highest and lowest level are auto detected and can't be changed.
Line style: you can choose from: Solid, Dotted and Dashed.
1 is Solid like this: ______________________
2 is Dashed - - - - - - - - - - - - - - - - - - -
3 is dotted ............................................
It works on all timeframes and Renko, Heikin Ashi, Bars, Candle and Line chart types.
There are also 10 pre-set alert conditions for you to choose.
For example, if you chose "Cross over Level 1", alert will be triggered when close price cross above level 1.
"Please Use the link below to obtain access to this indicator".

Hakimi - Ichi Based Pivot Time Prediction - V.2This indicator is based on multitime ichimoku and can be used to predict some of pivots .
How to use:
1- Select the arbitrary chart (Candles, Heikin Ashi, Line and Renko) and time frame.
2. Set the “Offset” value. Default value is -1.
3. Set the “Time Coefficient 1” to “Time Coefficient 4”. Default values are 2, 3, 4 and 5.

Bullish/Bearish Candle Series DistributionThe tool counts the number of consecutive bullish or bearish candles in a row and build a distribution of those series lengths. The entire history of an instrument is used.
Available modes:
Strict Bullish ( close > open )
Bullish ( close >= open )
Strict Bearish ( close <= open )
Bearish ( close < open )
Different chart types have different distributions:
Renko
Line Break

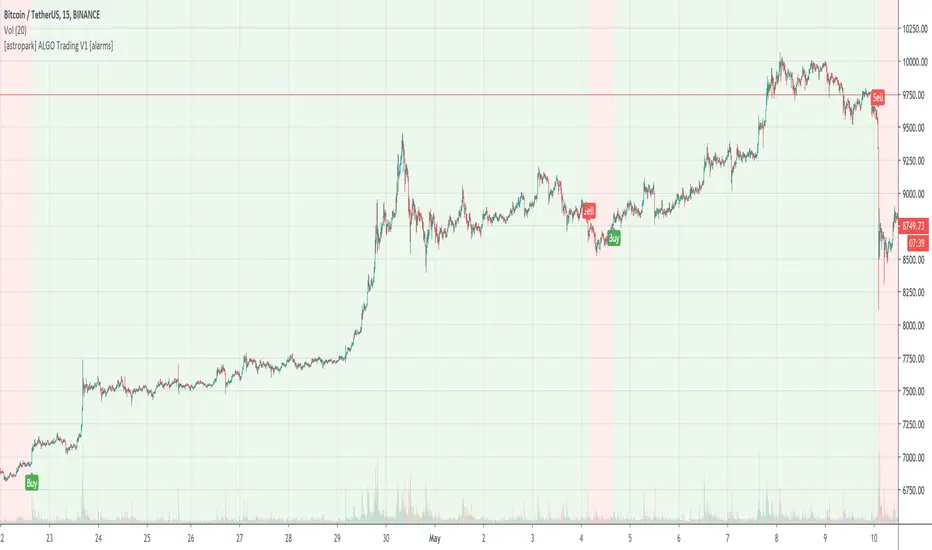
[astropark] ALGO Trading V3 [alarms]Dear Followers,
today another awesome Swing and Scalping Trading Strategy indicator, runnable on a bot , which works great on many timeframes (from 1h and above is suggested), just write me in order to help you find correct settings).
It must be said that this strategy works even better on 1m Renko chart!
If you are a scalper or you are a swing trader, you will love suggested entries for fast and long-lasting profit.
Keep in mind that a proper trailing stop strategy and risk management and money management strategies are very important (DM me if you need any clarification on these points).
This is not an evolution of "ALGO Trading V1" or "ALGO Trading V2" , but a twin sister of them.
For your reference, here it is the "ALGO Trading V1" indicator
and here the "ALGO Trading V2"
This strategy has the following options:
enable/disable signals on chart
enable/disable bars and background coloring based on trend
enable/disable a "filter noise" option , which try to reduce overtrading (you can easily check it on backtesting)
enable/disable a Take Profit / Stop Loss option (you can easily check it on backtesting too)
enable/disable a secret SmartOption which may improve profit on your chart (again, check it on you chart if it helps or not)
This strategy only trigger 1 buy or 1 sell. If you enable Take Profit / Stop Loss option, consider that many TP can be triggered before trend reversal, so take partial profit on every TP an eventually buy/sell back lower/higher to maximize your profit.
This script will let you set all notifications you may need in order to be alerted on each triggered signals.
The one for backtesting purpose can be found by searching for the astropark's "ALGO Trading V3" and then choosing the indicator with "strategy" suffix in the name, or you can find here below
Strategy results are calculated on the time window from 1995 to now, so on more than 15 years, using 1000$ as initial capital and working at 1x leverage (so no leverage at all! If you like to use leverage, be sure to use a safe option, like 3x or 5x at most in order to have liquidation price very far).
This is not the "Holy Grail", so use a proper risk management strategy.
This script will let you backtest how the indicator will perform on any chart and timeframe you may like to test and/or trade. Of course results will be very different depending on the chart and timeframe you will open. I tested a lot of charts and always you can find a combination that keep this strategy in profit on swing trading style (and this means that if you can have a daily look at the chart you can always manage to maximize your profit on each trade!)
This is a premium indicator , so send me a private message in order to get access to this script.

[astropark] ALGO Trading V2 [alarms]Dear Followers,
today another awesome Swing and Scalping Trading Strategy indicator, runnable on a bot , which works great on many timeframes (ones between 1h and 1D are suggested, but just write me in order to help you find correct settings).
It must be said that this strategy works even better on 1m Renko chart!
If you are a scalper or you are a swing trader, you will love suggested entries for fast and long-lasting profit.
Keep in mind that a proper trailing stop strategy and risk management and money management strategies are very important (DM me if you need any clarification on these points).
This is not an evolution of "ALGO Trading V1" or "ALGO Trading V3" , but a twin sister of them. Search them on TradingView to know them better.
Here you can find ALGO Trading V1
This strategy has the following options:
enable/disable signals on chart
enable/disable bars and background coloring based on trend
enable/disable a "filter noise" option , which try to reduce overtrading (you can easily check it on backtesting)
enable/disable a Take Profit / Stop Loss option (you can easily check it on backtesting too)
enable/disable a secret SmartOption which may improve profit on your chart (again, check it on you chart if it helps or not)
This strategy only trigger 1 buy or 1 sell. If you enable Take Profit / Stop Loss option, consider that many TP can be triggered before trend reversal, so take partial profit on every TP an eventually buy/sell back lower/higher to maximize your profit.
This script will let you set all notifications you may need in order to be alerted on each triggered signals.
The one for backtesting purpose can be found by searching for the astropark's "ALGO Trading V2" and then choosing the indicator with "strategy" suffix in the name, or you can find here below
Strategy results are calculated on the time window from January 2018 to now, so on more than 2 years, using 1000$ as initial capital and working at 1x leverage (so no leverage at all! If you like to use leverage, be sure to use a safe option, like 3x or 5x at most in order to have liquidation price very far).
This is not the "Holy Grail", so use a proper risk management strategy.
This is a premium indicator , so send me a private message in order to get access to this script.

[astropark] ALGO Trading V1 [alarms]Dear Followers,
today another awesome Swing and Scalping Trading Strategy indicator, runnable on a bot , which works great on Low Timeframes (1h is suggested) but also on even lower ones (till 15m) and on higher ones (no further than 1D), just write me in order to help you find correct settings).
It must be said that this strategy works even better on 1m Renko chart!
If you are a scalper or you are a swing trader, you will love suggested entries for fast and long-lasting profit.
Keep in mind that a proper trailing stop strategy and risk management and money management strategies are very important (DM me if you need any clarification on these points).
This is not an evolution of "ALGO Trading V2" or "ALGO Trading V3" , but a twin sister of them. Search them on TradingView to know them better.
This strategy has the following options:
enable/disable signals on chart
enable/disable bars and background coloring based on trend
enable/disable a "filter noise" option , which try to reduce overtrading (you can easily check it on backtesting)
enable/disable a Take Profit / Stop Loss option (you can easily check it on backtesting too)
enable/disable a secret SmartOption which may improve profit on your chart (again, check it on you chart if it helps or not)
This strategy only trigger 1 buy or 1 sell. If you enable Take Profit / Stop Loss option, consider that many TP can be triggered before trend reversal, so take partial profit on every TP an eventually buy/sell back lower/higher to maximize your profit.
This script will let you set all notifications you may need in order to be alerted on each triggered signals.
The one for backtesting purpose can be found by searching for the astropark's "ALGO Trading V1" and then choosing the indicator with "strategy" suffix in the name, or you can find here below
Strategy results are calculated on the time window from January 2019 to now, so on more than 1 year, using 1000$ as initial capital and working at 1x leverage (so no leverage at all! If you like to use leverage, be sure to use a safe option, like 3x or 5x at most in order to have liquidation price very far).
This is not the "Holy Grail", so use a proper risk management strategy.
This is a premium indicator , so send me a private message in order to get access to this script.
Dekidaka-Ashi - Candles And Volume Teaming Up (Again)The introduction of candlestick methods for market price data visualization might be one of the most important events in the history of technical analysis, as it totally changed the way to see a trading chart. Candlestick charts are extremely efficient, as they allow the trader to visualize the opening, high, low and closing price (OHLC) each at the same time, something impossible with a traditional line chart. Candlesticks are also cleaner than bars charts and make a more efficient use of space. Japanese peoples are always better than everyone at an incredible amount of stuff, look at what they made, the candlesticks/renko/kagi/heikin-ashi charts, the Ichimoku, manga, ecchi...
However classical candlesticks only include historical market price data, and won't include other type of data such as volume, which is considered by many investors a key information toward effective financial forecasting as volume is an indicator of trading activity. In order to tackle to this problem solutions where proposed, the most common one being to adapt the width of the candle based on the amount of volume, this method is the most commonly accepted one when it comes to visualizing both volume and OHLC data using candlesticks.
Now why proposing an additional tool for volume data visualization ? Because the classical width approach don't provide usable data regarding volume (as the width is directly related to the volume data). Therefore a new trading tool based on candlesticks that allow the trader to gain access to information about the volume is proposed. The approach is based on rescaling the volume directly to the price without the direct use of user settings. We will also see that this tool allow to create support and resistances as well as providing signals based on a breakout methodology.
Dekidaka-Ashi - Kakatte Koi Yo!
"Dekidaka" (出来高) mean "Volume" in a financial context, while "Ashi" (足) mean "leg" or "bar". In general methods based on candlesticks will have "Ashi" in their name.
Now that the name of the indicator has been explained lets see how it works, the indicator should be overlayed directly to a candlestick chart. The proposed method don't alter the shape of the candlesticks and allow to visualize any information given by the candles. As you can see on the figure below the candle body of the proposed tool only return the border of the candle, this allow to show the high/low wick of the candle.
The body size of the candle is based on two things : the absolute close/open difference, and the volume, if the absolute close/open difference is high and the volume is high then the body of the candle will be clearly visible, if the volume is high but the absolute close/open difference is low, then the body will be less visible. This approach is used because of the rescaling method used, the volume is divided by the sum between the current volume value and the precedent volume value, this rescale the volume in a (0,1) range, this result is multiplied by the absolute close/open difference and added/subtracted to the high/low price. The original approach was based on normalization using the rolling maximum, but this approach would have led to repainting.
You have access to certain settings that can help you obtain a better visualization, the first one being the body size setting, with higher values increasing the body amplitude.
In green body with size 2, in red with size 1. The smooth parameter will smooth the volume data before being used, this allow to create more visible bodies.
Here smooth = 100.
Making Bands From The Dekidaka-Ashi
This tool is made so it output two rescaled volume values, with the highest value being denoted as "Dekidaka-high" and the lowest one as "Dekidaka-low". In order to get bands we must use two moving averages, one using the Dekidaka-high as input and the other one using Dekidaka-low, the body size parameter should be fairly high, therefore i will hide the tool as it could cause trouble visualizing the bands.
Bands with both MA's of period 20 and the body size equal to 20. Larger periods of the MA's will require a larger amount of body size.
Breakout Signals
There is a wide variety of signals that can be made from candles, ones i personally like comes from the HA candles. The proposed tool is no exception and can produce a wide variety of signals. The signals generated are basic ones based on a breakout methodology, here is each signal with their associated label :
Strong Bullish signal "⇈" : The high price cross the Dekidaka-high and the closing price is greater than the opening price
Strong Bearish signal "⇊" : The low price cross the Dekidaka-low and the closing price is lower than the opening price
Weak Bullish signal "↑" : The high price cross the Dekidaka-high and the closing price is lower than the opening price
Weak Bearish signal "↓" : The low price cross the Dekidaka-low and the closing price is greater than the opening price
Uncertain "↕" : The high price cross the Dekidaka-high and the low price cross the the Dekidaka-low
In order to see the signals on the chart check the "Show signals" option. Note that such signals are not based on an advanced study, and even if they are based on a breakout methodology we can see that volatile movement rarely produce signals, therefore signals mostly occur during low volume/volatility periods, which isn't necessarily a great thing.
Conclusion
A trading tool based on candlesticks that aim to include volume information has been presented and a brief methodology has been introduced. A study of the signals generated is required, however i'am not confident at all on their accuracy, i could work on that in the future. We have also seen how to make bands from the tool.
Candlesticks remain a beautiful charting technique that can provide an enormous amount of information to the trader, and even if the accuracy of patterns based on candlesticks is subject to debates, we can all agree that candlesticks will remain the most widely used type of financial chart.
On a side note i mostly use a dark color for a bullish candle, and a light gray for a bearish candle, with the border color being of the same color as the bullish candle. This is in my opinion the best setup for a candlestick chart, as candles using the traditional green/red can kill the eyes and because this setup allow to apply a wide variety of colors to the plot of overlayed indicators without the fear of causing conflict with the candles color.
Thanks for reading ! :3 Nya
A Word
This morning i received some hateful messages on twitter, the users behind them certainly coming from tradingview, so lets be clear, i know i'am not the most liked person in this community, i know that perfectly, but no one merit to be receive hateful messages. I'am not responsible for the losses of peoples using my indicators, nor is tradingview, using technical indicators does not guarantee long term returns, your ability to be profitable will mostly be based on the quality and quantity of knowledge you have.
