Numbers RenkoRenko with Volume and Time in the box was developed by David Weis (Authority on Wyckoff method) and his student.
I like this style (I don't know what it is officially called) because it brings out the potential of Wyckoff method and Renko, and looks beautiful.
I can't find this style Indicator anywhere, so I made something like it, then I named "Numbers Renko" (数字 練行足 in Japanese).
Caution : This indicator only works exactly in Renko Chart.
////////// Numbers Renko General Settings //////////
Volume Divisor : To make good looking Volume Number.
ex) You set 100. When Volume is 0.056, 0.05 x 100 = 5.6. 6 is plotted in the box (Decimal are round off).
Show Only Large Renko Volume : show only Renko Volume which is larger than Average Renko Volume (it is calculated by user selected moving average, option below).
Show Renko Time : "Only Large Renko Time" show only Renko Time which is larger than Average Renko Time (it is calculated by user selected moving average, option below).
EMA period for calculation : This is used to calculate Average Renko Time and Average Renko Volume (These are used to decide Numbers colors and Candles colors). Default is EMA, You can choice SMA.
////////// Numbers Renko Coloring //////////
The Numbers in the box are color coded by compared the current Renko Volume with the Average Renko Volume.
If the current Renko Volume is 2 times larger than the ARV, Color2 will be used. If the current Renko Volume is 1.5 times larger than the ARV, Color1.5 will be used. Color1 If the current Renko Volume is larger than the ARV . Color0.5 is larger than half Athe RV and Color0 is less than or equal to half the ARV. Color1, Color1.5 and Color2 are Large Value, so only these colored Numbers are showed when use "Show Only ~ " option.
Default is Renko Volume based Color coding, You can choice Renko Time based Color coding. Therefore you can use two type coloring at the same time. ex) The Numbers Colors are Renko Volume based. Candle body, border and wick Colors are Renko Time based.
////////// Weis Wave Volume //////////
Show Effort vs Result : Weis Wave Volume divided by Wave Length.
ex) If 100 Up WWV is accumulated between 30 Up Renko Box, 100 / 30 = 3.33... will be 3.3 (Second decimal will be rounded off).
No Result Ratio : If current "Effort vs Result" is "No Result Ratio" times larger than Average Effort vs Result, Square Mark will be show. AEvsR is calculated by 5SMA.
ex) You set 1.5. If Current EvsR is 20 and AEvsR is 10, 20 > 10 x 1.5 then Square Mark will be show.
If the left and right arrows are in the same direction, the right arrow is omitted.
Show Comparison Marks : Show left side arrow by compare current value to previous previous value and show right side small arrow by compare current value to previous value.
ex) Current Up WWV is 17 and Previous Up WWV (previous previous value) is 12, left side arrow is Up. Previous Dn WWV is 20, right side small arrow is Dn.
Large Volume Ratio : If current WWV is "Large Volume Ratio" times larger than Average WWV, Large WWV color is used.
Sample layout
Cerca negli script per "renko"

Renko ScalperWhat it is-
A lightweight Renko Scalper that combines Renko brick direction with an internal EMA trend filter and MACD confirmation to signal high-probability short-term entries. EMAs are used internally (hidden from the chart) so the visual remains uncluttered.
Signals-
Buy arrow: Renko direction turns bullish AND EMA trend up AND MACD histogram positive.
Sell arrow: Renko direction turns bearish AND EMA trend down AND MACD histogram negative.
Consecutive same-direction signals are suppressed (only one arrow per direction until opposite signal).
Visuals-
Buy / Sell arrows (large) above/below bars.
Chart background tints green/red after the respective signal for easy glance recognition.
Inputs:-
Renko Box Size (points)
EMA Fast / EMA Slow
MACD fast/slow/signal lengths
How to use-
Add to chart
Use smaller Renko box sizes for scalping, larger for swing-like entries.
Confirm signal with price action and volume—this indicator is a signal generator, not a full automated system.
Use alerts (built in) to receive Buy / Sell arrow notifications.
Alerts-
Buy Arrow — buySignal
Sell Arrow — sellSignal
Buy Background / Sell Background — background-color state alerts
Recommended settings-
Timeframes: 1m–15m for scalping, 5m for balanced intraday.
Symbols: liquid futures/currency pairs/major crypto.
Disclaimer
This script is educational and not financial advice. Backtest and forward test on a demo account before live use. Past performance is not indicative of future results. Use proper risk management.

Renko Box Chart Overlay by BDThis is Renko chart overlay for Candles chart. You can use it to identify market direction and potential key points.
To use it simply select box size and any timeframe you want.
With this overlay you can be sure that you'll see every brick on a chart showing general market direction with all the details of a candles chart.
Alternatives Renko overlay charts:
If you don't have access to 1s timeframe or you don't want to use low TF here is the situation with built in Renko chart on 5m TF:
This Renko boxes are linked to chart by time(candle) and price. It will draw a box even if price didn't close above(or below) of box level:
But be careful when setting box size too small because it will produce bad results:
The issue is known and I'll work on fixing it in next update, for now use box size at least the size of a body of a candle, after all renko is for general market movement and not for marking up every tick.
Let me know if you want to see any additions.
[NLX-L2] Renko Flip- Renko Flip -
This indicator give you signals based on non-repainting Renko blocks (ATR based) on regular candle charts and is Multi-Timeframe compatible.
- Example: How to Use -
1. Add a Trend Indicator like Trend Index MTF to your chart
2. Add this Renko Flip Indicator to your Chart and select the Trend Index MTF with Type L1 in the Settings as Signal Source
3. Add the Backtest Module to your Chart and select the Renko Flip Signal with Type L2 as Source
The Hurst-Exponent-Signal-Filter can be used as well, simply add it in between the Renko Flip and Backtest/Alert module :)
- Alerts for Automated Trading -
See my signature below. Contact me for the Alert module.

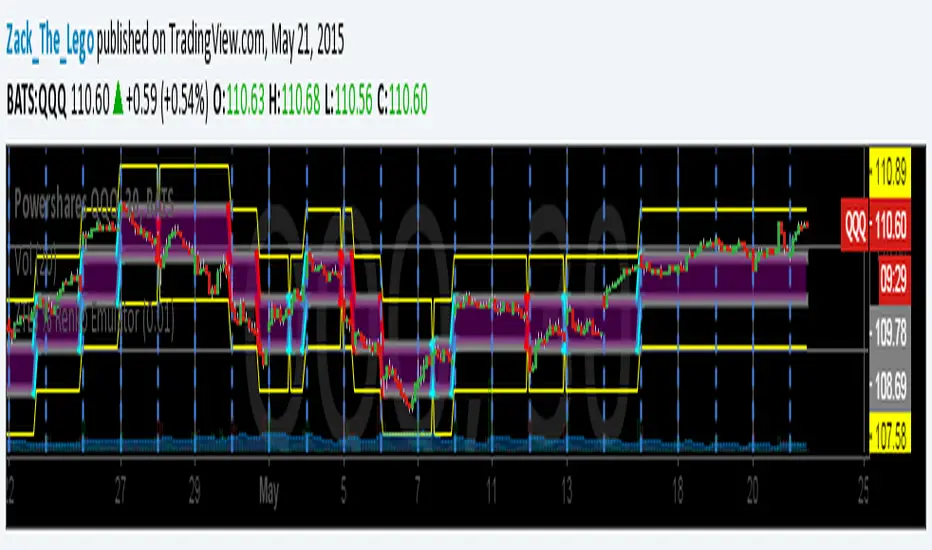
ZTLs Percentage-based Renko EmulatorHere is a version of my Renko script but with percentage-based Renko brick sizes instead of ATR or static brick sizes. This way, you can add dependable alerts that won't need to be adjusted due to fluctuating ATR values but also allows you move through different charts without having to adjust your Renko Brick-sizes for each ticker.
To use: The Renko size setting defaults to ".001" or 10 basis points. So ".01" is 1 percent or 100 basis points. This Renko Script is perfect for those that trade in a strictly percentage based style (instead of price levels).
The yellow lines are where the next brick will be drawn.
Enjoy!!
Zack_the_Lego
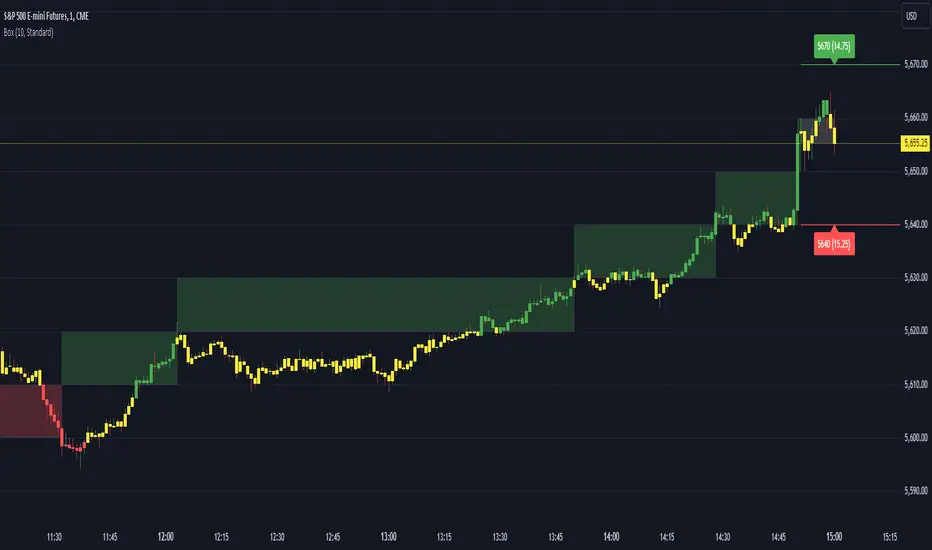
Renko Open Range delta
Delta Renko-Style Indicator Guide (NQ Focus)
This indicator takes inspiration from the Renko Chart concept and is optimized for the RTH session (New York time zone), specifically applied to the Nasdaq futures (NQ) product.
If you’re unfamiliar with Renko charts, it may help to review their basics first, as this indicator borrows their clean, block-based perspective to simplify price interpretation.
⸻
🔧 How the Indicator Works
• At market open (9:30 AM EST), the indicator plots a horizontal open price line, referred to as 0 delta.
• From this anchor, it plots 10 incremental levels (deltas) both above and below the open, each spaced by 62.5 NQ points.
Why 62.5?
• With NQ currently trading in the 23,000–24,000 range, a 62.5-point move represents roughly 0.26% of the daily average range.
• This makes each delta step significant enough to capture movement while filtering out smaller noise.
A mini table (location adjustable) displays:
• Current delta zone
• Last touched delta level
This gives you a quick snapshot of where price sits relative to the open.
⸻
📈 How to Read the Market
• At the open, price typically oscillates between 0 and +1 / -1 delta.
• A break beyond this zone often signals stronger directional intent:
• Trending day: price can push into +2, +3, +4, +5 (or the inverse for downside).
• Range day: expect price to bounce between +1, 0, -1 deltas.
⚠️ Note: This is a visualization tool, not a trading system. Its purpose is to help you quickly recognize range vs. trend conditions.
⸻
📊 Example
• In this case, NQ reached +1 delta shortly after open.
• A retest of 0 delta followed, and price later surged to +5/+6 deltas (helped by Fed news).
⸻
🛠️ Practical Uses
This indicator can help you:
• Define profit targets
• Place hard stop levels
• Gauge whether a counter-trend trade is worth the risk
⚠️ Caution: Avoid counter-trend trades if price is aggressively pushing toward +5/+6 or -5/-6 deltas, as trend exhaustion usually hasn’t set in yet.
⸻
🔄 Adapting for ES (S&P Futures)
• On NQ, 62.5 points ≈ $1,250 per contract.
• For ES, this translates to 25 points.
• Since 1 NQ contract ≈ 2 ES contracts in dollar terms, an optimized ES delta step would be 12.5 points.
You may also experiment with different delta values (e.g., 50 or 31.25 for NQ) to align with your risk profile and trading style.
⸻
🧪 Extending Beyond NQ
You can experiment with applying this indicator to ES or even stocks, but non-futures assets may require additional calibration and testing.
⸻
✅ Bottom line: This tool provides a clean, Renko-inspired framework for quickly gauging trend vs. range conditions, setting realistic profit targets, and avoiding poor counter-trend setups.

Renko GuppyI like renko blocks and I like guppy mma's so I decided to put together a study for using them with each other while I'm using other bar types.
Additionally, I added two line plots for two different renko sizes of your choice. This has a nice benefit of being able to see how price appears to be ranging between the "block sizes".
Being able to see the lines contract, especially within these "ranging" zones, gives you a great indication of an impending breakout.
The example you see above shows the guppy block size set to 15, the white line is 50 and the blue is 100. It should hopefully illustrate the idea.
The current close price (red line) can also be optionally plotted as a separate moving average, or simply the close price. I defaulted it to a 3 period EMA to smooth it out a bit so it flows a bit better with the guppy ma's. It's helpful to see how price is actually moving around within these Renko blocks.
Pick either Traditional or ATR block sizes.
There are the fast (5) / slow (5) moving averages.
Pick your poison: EMA (default), SMA, WMA, SMMA, DEMA, TEMA, HullMA, ZEMA, TMA, SSMA
There's some options to disable/enable things as you see fit.
The defaults are set to my own needs so you'll probably want to change block sizes for you preferences/symbols/timeframes.
Note: This is presumably only usable for those of you with access to Renko charts on here.

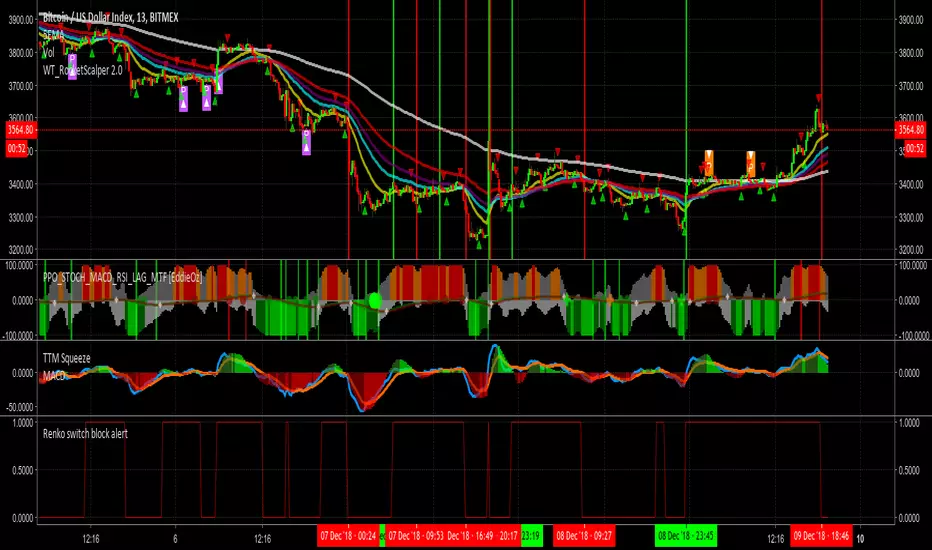
Renko Stop and GoSimilar to crossover systems, this indicator uses the renko calculation of the brick open position instead of the slow average in a crossover system, it also generates a signal marker on the crossover of the price and renko lines, both can be smoothed in the optional parameters.
update version to V5 for this script:

Renko MTF - Traditional and ATRSomehow there aren't too many renko bars that have the traditional setting built-in so I put one up. This one has the option to choose between Traditional and ATR, the size number corresponds to the option that was chosen. And just in case if anyone wanted, I put up a multi-time frame option to choose the time frame the bars take place. D is for day, W is for week, flat numbers are in minutes, and leaving it blank looks at the current time frame the chart is in. The calculation comes from how Tradingview handles renko bars.
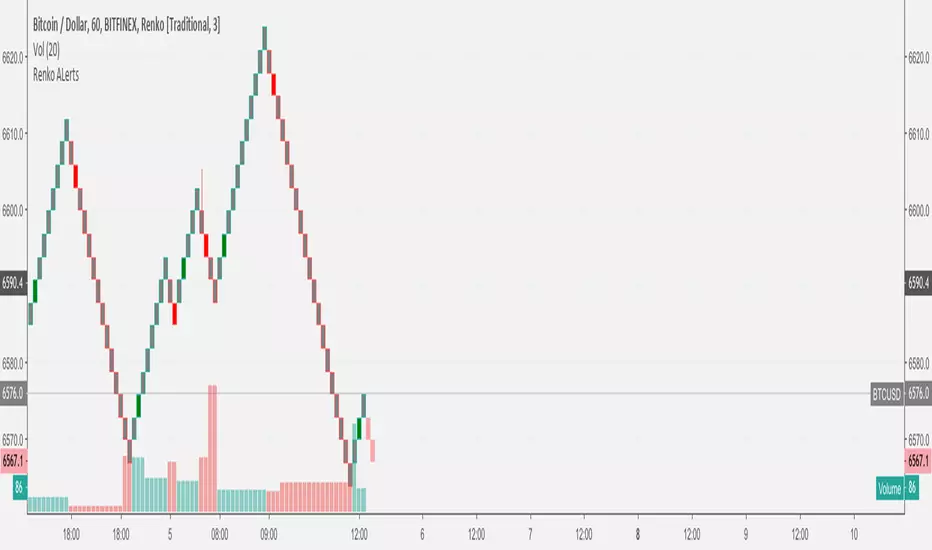
Renko bars don't paint a color unless the market moves a certain amount based on its settings. When the market moves up it turns green, if it moves down it turns red, simple color changes alone can say a lot. They're a good way to try to find trends somewhat objectively and seem to be a good way to eliminate time and can replace other time-based indicators that can whipsaw or lag. The bars have a tendency to repeat themselves so it's a good way to find trends. There aren't too many settings for the box size, most people either just choose 5, 10, 14, etc where as other indicators have many options that differ on different markets. The numbers can be chosen easily enough to pick a sweet spot with just a single input where other indicators such as MACD have multiple inputs to pick the right number that can make it difficult to choose from(although it won't be as precise as a MACD would sometimes but can be worth the objectiveness and consistency and same setting repeatability in different markets in my opinion). Some example strategies could be to use them as an alternative trailing stop, finding trends, a simple color change for entry and exit on top of other strategies, etc. It can do the job of many in an all in one price action type indicator(although not better all the time, it can come close enough). Despite all this, it does seem to depend on which time-frame it's being looked at, how TV does the calculation for it, and how one can use this with the lack of practical information on it out there.

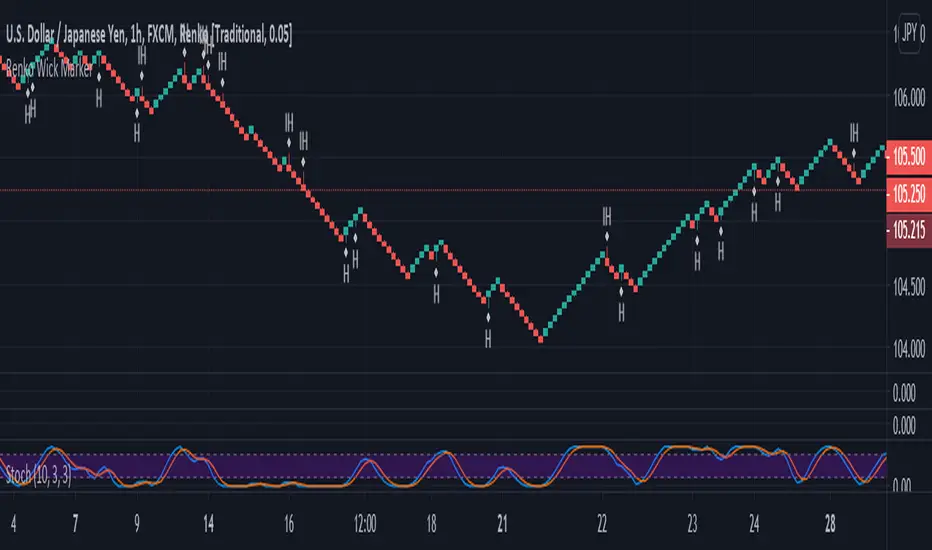
Renko Bar Time by JustUncleLThis indicator in designed to be used with Renko and other price only bars (ie Kagi, LineBreak, Point&Figure) and shows the number of minutes a bar was open before it was confirmed and printed.
NOTE: It will only work on currencies and symbols that are in the 24/5 market, it does account for weekend market close time but does not account for any Forex market holiday close times.
HINTS:
When the BAR TIME is long and the Renko Bricks have wicks, this is an indication of consolidation.
When the BAR TIME is short and the Renko Bricks have no wicks, this is an indication of acceleration.

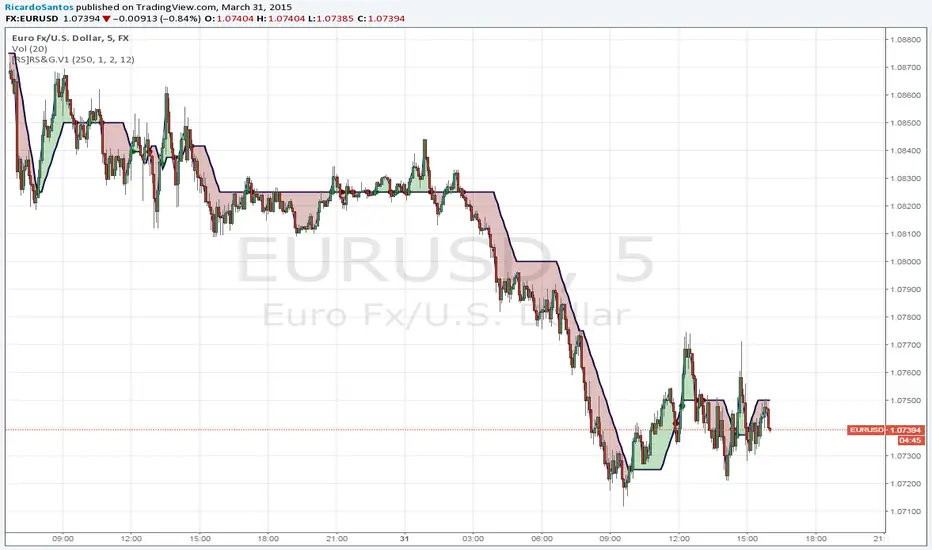
[RS]Renko ZigZag V0Renko based zigzag:
mode: can be Traditional or ATR .
modeValue: can be whole number if you use ATR mode, or floating point number in case of Traditional mode.
showOverlay: displays basis Renko overlay.


RENKO MTFMultiframe RENKO panes with timeframe-weighted signal line and warning dots. All timeframes in settings MUST be <= your timeframe or it will repains on bigger timeframes.


ZTLs Flex Renko EmulatorUpdate to my Flex Renko Emulator. I have added yellow projection lines where the price needs to be for next brick to be drawn.