SMA Reversal Sequential MTF - Pure Confirmed Final V2SMA Reversal Sequential MTF - Detailed Indicator Manual
This indicator identifies trend reversal points based on the shape of a Simple Moving Average (SMA) and monitors these signals across multiple timeframes (MTF). By synchronizing trends from various intervals, it provides a robust framework for identifying high-probability entry points.
1. Core Logic Overview
The indicator detects "peaks" and "troughs" in the SMA to identify potential reversal points.
Bullish Reversal (UP): Occurs when the SMA turns upward after a period of decline (forming a "trough").
Bearish Reversal (DN): Occurs when the SMA turns downward after a period of inclination (forming a "peak").
In addition to detecting these turns, the indicator tracks the high/low prices of the most recent reversal points on a "Confirmed Bar" basis. When the current price breaks these levels, it confirms a trend continuation or a breakout.
2. Full Description of Input Settings
Basic Settings / Main Settings
Use Short Period (5, 4, 7) / 短期設定を使用:
true: Increases sensitivity to price movements by using shorter parameters (e.g., SMA 5). Suitable for scalping.
false: Uses standard parameters (e.g., SMA 20). Suitable for day trading and swing trading.
Timeframe Visibility / 時間足表示設定
Allows individual toggling of visibility for each timeframe's labels and lines.
Show 1M to 1m / 1M〜1m表示: Individually enable or disable the calculation and display of data for Monthly (1M), Weekly (1W), Daily (Daily), 4H, 1H, 15M, 5M, and 1m timeframes.
Hide Higher TF Settings on Lower TFs / 下位足での上位設定を非表示: When enabled, this removes lower timeframe data from higher timeframe charts to reduce visual noise.
Drawing Options / 表示オプション
Show Only Current TF Labels / 現在足のラベルのみ表示: If enabled, only labels corresponding to the chart's current interval (e.g., "5" labels on a 5M chart) will be displayed.
Show Trendlines & Channels / トレンドライン&チャネルを表示: Automatically draws trendlines and parallel channels by connecting recent local reversal points on the current timeframe.
Show Sequential Labels / 転換点ラベル表示: Displays timeframe labels (e.g., "15", "1H") at the exact point where the SMA reversed.
Show Break Lines / ブレイクライン表示: Draws horizontal lines from the most recent peaks or troughs and displays a "BREAK" label when price crosses them.
Break Label Offset / ブレイク文字の右オフセット: Adjusts the horizontal distance of the "BREAK" label from the current bar for better visibility.
Additional Alert Settings / 追加アラート設定
Alert 1: Current + 2 Higher TFs Sync (Blue/Red) / アラート1: 現在・上位2つ同調:
Triggers a notification when the trend (UP/DN) of the current chart's timeframe, the next higher timeframe, and the second higher timeframe all align.
Alert 2: 4-TF Sync Including Current (Orange) / アラート2: 表示足を含む4足同調:
Triggers a notification when four consecutive timeframes (Current + 3 Higher) align in the same direction. This is considered a high-conviction signal.
3. How to Read the Dashboard (Table)
The compact table in the top-right corner displays the current trend status for key timeframes in real-time.
Blue Background (UP): Indicates price has broken the recent peak, confirming an uptrend for that timeframe.
Red Background (DN): Indicates price has broken the recent trough, confirming a downtrend for that timeframe.
Gray Background: Indicates the trend status is yet to be determined or is in a neutral state.
The table items are fixed to show 1D, 4H, 1H, 15M, and 5M from top to bottom. When all rows turn the same color, it indicates a strong market trend across the entire spectrum.
4. Key Feature: MTF Sync Alerts
The primary advantage of this indicator is its automation of manual Multi-Timeframe Analysis.
3-TF Sync: On a 15M chart, if the 15M, 1H, and 4H trends align, a small Blue (Buy) or Red (Sell) label appears on the chart.
4-TF Sync: If the alignment extends to a 4th timeframe (e.g., up to the Daily timeframe on a 15M chart), an Orange label is displayed, signaling a very strong trend confluence.
このインジケーター(SMA Reversal Sequential MTF)は、移動平均線(SMA)の形状からトレンドの転換点を特定し、それを複数の時間足(MTF)で監視・同期させることで、高精度なエントリーポイントを探るためのツールです。
以下に、すべてのインプット項目を含む詳細な説明をまとめました。
1. 概要と基本ロジック
このインジケーターは、SMA(単純移動平均線)が「山」や「谷」を作ったポイントを転換点として認識します。
上昇転換: SMAが一定期間、下降した後に上昇へ転じた(谷を作った)タイミング。
下降転換: SMAが一定期間、上昇した後に下降へ転じた(山を作った)タイミング。
これに加えて、直近の転換点の価格(高値・安値)を「確定足」で更新し、そのラインを価格がブレイクした際にトレンドの継続や転換を判定します。
2. インプット項目の詳細
基本設定 / Main Settings
短期設定を使用 (5, 4, 7):
true(チェックあり): 短期的な動きに敏感になります(SMA 5期間など)。スキャルピング向け。
false(チェックなし): 標準的な設定(SMA 20期間など)。デイトレード・スイング向け。
時間足表示設定 / Timeframe Visibility
各時間足のラベルやラインを表示するかどうかを個別に設定します。
1M〜1m表示: 月足(1M)から1分足(1m)まで、各MTFデータの計算・表示をオン/オフします。
下位足での上位設定を非表示: * 現在表示しているチャートより上位の時間足設定だけを表示し、ノイズを減らすためのスイッチです。
表示オプション / Drawing Options
現在足のラベルのみ表示: チェックすると、チャートの時間足と一致するラベル(例:5分足チャートなら「5」のラベル)のみ表示されます。
トレンドライン&チャネルを表示: 現在表示している足の直近の転換点同士を結び、トレンドラインと並行チャネルを自動描画します。
転換点ラベル表示: SMAが反転した位置に「15」や「1H」などの時間足ラベルを表示します。
ブレイクライン表示: 直近の転換点(高値・安値)から右側に水平線を引き、そこを価格が抜けた際に「BREAK」の文字を表示します。
ブレイク文字の右オフセット: 「BREAK」ラベルを右側にどれくらい離して表示するかを調整します。
追加アラート設定 / GRP_NEW_AL
アラート1: 現在・上位2つ同調 (青/赤):
「表示中の足 + 1つ上 + 2つ上」の計3つのトレンド(UP/DN)が一致した瞬間に通知します。
アラート2: 表示足を含む4足同調 (オレンジ):
「表示中の足 + 上位3つ」の計4つのトレンドがすべて一致した強力なサイン時に通知します。
3. テーブル(ダッシュボード)の見方
画面右上に表示されるコンパクトなテーブルは、各時間足の現在のトレンド状態をリアルタイムで示しています。
青背景(UP): 直近で高値をブレイクし、上昇トレンドにある状態。
赤背景(DN): 直近で安値をブレイクし、下降トレンドにある状態。
灰背景: 状態が未確定なケース。
表示項目は上位足から順に 1D(日足), 4H, 1H, 15M, 5M となっており、これらが一色に染まるタイミングが環境認識上の強いトレンドを示唆します。
4. 特徴的な機能:MTF同調アラート
このインジケーターの最大の強みは、手動でのマルチタイムフレーム分析を自動化している点です。
3足同調(SYNC): 15分足チャートであれば「15M・1H・4H」が同じ方向を向いた時にチャート上に青(買い)または赤(売り)の小さなラベルが表示されます。
4足同調(4-TF SYNC): さらに上位の足(15分足なら日足まで)が同調すると、オレンジ色のラベルが表示され、より強い根拠となります。
Cerca negli script per "reversal"

ATR-Normalized VWMA DeviationThis indicator measures how far price deviates from the Volume-Weighted Moving Average ( VWMA ), normalized by market volatility ( ATR ). It identifies significant price reversal points by combining price structure and volatility-adjusted deviation behavior.
The core idea is to use VWMA as a dynamic trend anchor, then measure how far price travels away from it relative to recent volatility . This helps highlight when price has stretched too far and may be due for a reversal or pullback.
How it works:
VWMA deviation is calculated as the difference between price and the VWMA.
That deviation is divided by ATR (Average True Range) to normalize for current volatility.
The script tracks the highest and lowest normalized deviations over the chosen lookback period.
It also tracks price structure (highest/lowest highs/lows) over the same period.
A reversal signal is generated when a historical extreme in deviation aligns with a price structure extreme, and a confirmed reversal candle forms.
You get visual signals and color highlights where these conditions occur.
Settings explained:
Lookback period defines how many bars the script uses to find recent extremes.
ATR length controls how volatility is measured.
VWMA length controls how the volume-weighted moving average is calculated.
Signal filters help refine entries based on price vs deviation behavior.
Display options let you customize how signals and levels appear on the chart.
This indicator is especially useful for spotting potential turning points where price has moved far from VWMA relative to volatility, suggesting possible exhaustion or overextension.
Tips for use:
Combine with broader trend context (higher timeframe support/resistance).
Use with risk management rules (position sizing, stops) — signals are guides, not guaranteed entries.
Adjust lookback and ATR settings based on your trading timeframe and asset volatility.

teril 1H EMA50 Harami Reversal Alerts BB Touch teril Harami Reversal Alerts BB Touch (Wick Filter Added + 1H EMA50)
teril Harami Reversal Alerts BB Touch (Wick Filter Added + 1H EMA50)
teril Harami Reversal Alerts BB Touch (Wick Filter Added + 1H EMA50)
teril Harami Reversal Alerts BB Touch (Wick Filter Added + 1H EMA50)

teril Harami Reversal Alerts BB Touch (Wick Filter Added) teril Harami Reversal Alerts BB Touch (Wick Filter Added)
teril Harami Reversal Alerts BB Touch (Wick Filter Added) teril Harami Reversal Alerts BB Touch (Wick Filter Added) teril Harami Reversal Alerts BB Touch (Wick Filter Added)
teril Harami Reversal Alerts BB Touch (Wick Filter Added)

Harami Reversal Alerts BB Touch (Strict First Candle)Harami Reversal Alerts BB Touch (Strict First Candle)
Harami Reversal Alerts BB Touch (Strict First Candle)Harami Reversal Alerts BB Touch (Strict First Candle)Harami Reversal Alerts BB Touch (Strict First Candle)Harami Reversal Alerts BB Touch (Strict First Candle)Harami Reversal Alerts BB Touch (Strict First Candle)

WSMR v3.8 — WhaleSplash → Mean Reversal# WSMR v3.8 — WhaleSplash → Mean Reversal
### Global, Anchored, Non-Repainting Signal Framework for Futures, Crypto & Index Markets
**WSMR v3.8** is a volatility-anchored market-structure framework designed to detect two high-probability turning points:
## 1️⃣ WhaleSplash (WS) — Short Impulse Exhaustion
A “WhaleSplash” is a large downside impulse characterised by:
- bar range ≥ *k × ATR*
- strong % move
- volume expansion vs SMA(20)
- deep Z-Score oversold
- compression away from VWAP
- RSI weakness
When these conditions align, the indicator marks a short exhaustion event and prints a 🐋 icon below the bar. This is a **non-repainting bar-close confirmation**.
---
## 2️⃣ Mean Reversal (MR) — Bullish Reversal Setup
The MR module combines:
- RSI bullish divergence (pivot-based, safe)
- Z-Score reset above threshold
- SMA20 reclaim with positive slope
- Higher-low structure
When confirmed at bar-close, the indicator identifies conditions favourable for a **mean-reversion long**.
MR signals can optionally trigger an “**1st green candle after MR**” confirmation within a user-defined TTL (default 12 bars).
---
# 🎯 Key Features
### ✔ Non-Repainting Confirmed Signals
WS & MR only fire **after** bar close, using cooldown logic to avoid clustering and noise.
### ✔ VWAP-Anchored Z-Score Framework
All signals reference price distance and statistical deviation from VWAP, producing adaptive, volatility-aware setups.
### ✔ Session Filter (Asia-Optimised)
Optional session gating allows signals only between **23:00–09:00 UTC**, ideal for systematic Asia-session breakout & mean-reversion traders.
### ✔ Volatility Monitor (Normal → Extreme)
Dynamic volatility classification using:
- ATR baseline ratio
- wickiness index
- range Z-Score
States: **Normal → Wicky → Spiky → Extreme**
Displayed with colour-coded background in the status panel.
### ✔ Rolling WhaleSplash Frequency (Analytics Panel)
WSMR tracks the frequency of WhaleSplash events over a rolling window (Bars/Days/Weeks/Months) and estimates average WS/day (on minute timeframes).
### ✔ Status Panel (Bottom-Right)
Live display of:
- Mode (Global/Asia)
- Timeframe + TTL status
- WhaleSplash frequency
- Volatility state
- ATR/Range information
---
# 📌 Best Timeframes
Optimised and validated on **5-minute charts**, but compatible with all intraday timeframes.
---
# 🚨 Alerts Included
- WhaleSplash SHORT
- WhaleSplash LONG
- Volatility Warning (Spiky/Extreme)
---
# ⚠️ Notes
WSMR v3.8 is not a buy/sell system. It is a **signal framework** highlighting exhaustion and reversal conditions. Always combine with market structure, session context, and risk management. Past performance does not guarantee future results.
---
# 💬 Credits
Script created by **John Nolan (JohnFrancisNolan)**
Pine Script® v6
© 2024–2025 — Published under the **Mozilla Public License 2.0**

Std Dev Reversal LevelsStd Dev Reversal Levels. Uses STD devs
Std Dev Reversal Levels. Uses STD devs
Std Dev Reversal Levels. Uses STD devs
Std Dev Reversal Levels. Uses STD devs
Std Dev Reversal Levels. Uses STD devs
Std Dev Reversal Levels. Uses STD devs

RSI Regime: Continuation vs Reversal Indicator Description: RSI Regime (Continuation vs. Reversal)
This indicator uses the standard Relative Strength Index (RSI) to analyze market momentum and categorize it into three "regimes." Its primary goal is to help you determine if an overbought (OB) or oversold (OS) signal is likely to be a continuation of the current trend or a reversal point.
It also identifies "Fast Trend Starts," which are exceptionally fast and powerful moves from one extreme to the other.
Core Features & How to Read It
1. The Three RSI Regimes (Background Color) The script calculates a moving average (SMA) of the RSI to determine the dominant medium-term momentum. This is shown as the background color:
Bull Regime (Green Background): The RSI's average is high (e.g., above 55). The market is in a clear uptrend.
Bear Regime (Red Background): The RSI's average is low (e.g., below 45). The market is in a clear downtrend.
Range Regime (Orange Background): The RSI's average is in the middle. The market is consolidating or undecided.
2. Overbought (OB) & Oversold (OS) Signals
When the RSI line crosses into the overbought (e.g., >70) or oversold (e.g., <30) zones, the indicator generates one of two types of signals:
A) Continuation Signals (Small Triangles: ►)
These signals suggest an OB/OS reading is just a "pause" and the main trend will likely continue.
Orange ► (at the top): Appears when RSI becomes overbought while the market is already in a Bull Regime. This suggests the uptrend is strong, and this OB signal may not lead to a big drop.
Teal ► (at the bottom): Appears when RSI becomes oversold while the market is already in a Bear Regime. This suggests the downtrend is strong, and this OS signal may not lead to a big bounce.
(Note: An optional Price EMA filter can be enabled to make these signals more strict.)
B) Reversal Signals (Small Labels: "OS→>50" / "OB→<50")
These labels appear after an OB/OS signal to confirm that a reversal has actually occurred.
"OS→>50 Reversal" (Aqua Label): Appears if the RSI becomes oversold and then recovers back above the 50 midline within a set number of bars. This confirms the oversold dip was a reversal point.
"OB→<50 Reversal" (Orange Label): Appears if the RSI becomes overbought and then falls back below the 50 midline within a set number of bars. This confirms the overbought peak was a reversal point.
3. "Fast Trend Starts" (Large Labels)
This is a unique feature that identifies the fastest percentile of market moves. It measures how many bars it takes for the RSI to go from one extreme to the other and flags when a move is in the top 5% (default) of all historical moves.
"Long Pullbacks (Fast OS→BullRange)" (Large Green Label): This powerful signal appears when the RSI moves from oversold (<30) all the way up to the bull range (>60) exceptionally fast. It identifies a very strong, fast, and decisive bounce that could signal the start of a new uptrend.
"Short Pumps (Fast OB→BearRange)" (Large Red Label): This appears when the RSI moves from overbought (>70) all the way down to the bear range (<40) exceptionally fast. It identifies a very sharp, fast rejection or "pump-and-dump" that could signal the start of a new downtrend.
Key User Inputs
RSI Length (14): The lookback period for the main RSI calculation.
OB (70) / OS (30): The standard overbought and oversold levels.
Bull/Bear Range Threshold (60/40): These are the levels used to confirm the "Fast Trend Starts." They are separate from the OB/OS levels.
RSI Regime SMA Length (21): The lookback period for the moving average that determines the background regime.
Use Price EMA filter (true): If checked, the small "Continuation" triangles will only appear if the price is also above (for bulls) or below (for bears) its own 50-period EMA.
Fastest X% duration (5.0): This sets the percentile for the "Fast Trend Start" labels. 5.0 means it only flags moves that are in the fastest 5% of all recorded moves.

Scalp BTC/ETH — Reversal & Continuation (v1, Pine v6)Scalp BTC/ETH — Reversal & Continuation (1m à 10m)
Cet indicateur détecte des opportunités de micro-scalping sur futures (BTC/ETH) basées sur deux mécaniques courtes validées par structure de prix :
A) Reversal de pression (contre-mouvement contrôlé)
Détection d’une sur-extension brutale suivie d’une absorption sur la bougie suivante.
Objectif : capturer la première respiration après un excès de prix (rejet court).
B) Continuation courte (momentum + reprise)
Détection de 3 bougies directionnelles consécutives suivies d’un pullback léger, puis signal sur la reprise du mouvement initial.
Gestion intégrée (scénario standard TP dynamique)
TP1 → 50% de la position à un gain fixe (% adaptable au timeframe)
Stop déplacé au Break-Even sur le restant
Sortie finale sur bougie inverse significative
(correction ≥ X% du corps précédent) ou timeout (max bars en trade)
Scalp BTC/ETH — Reversal & Continuation (1m to 10m)
This indicator detects short-term futures scalping setups on BTC & ETH using two mechanical price-action models designed for fast execution:
A) Reversal Compression (counter-move entry)
Identifies a sharp impulse (overextension) followed by absorption / failure to extend on the next candle.
Objective: capture the first corrective pullback after exhaustion.
B) Controlled Continuation (momentum follow-through)
Identifies 3 consecutive trend candles, then a shallow pullback, and triggers an entry on the resumption of the main leg.
Built-in trade logic (dynamic TP structure)
TP1 → scale out 50% of the position at a fixed percentage (auto-scaled per timeframe)
Stop moved to Break-Even after TP1
Final exit on either:
• a meaningful opposite candle (≥ X% correction of prior body), or
• a timeout (max bars in trade)
Technical characteristics
Designed for 1m / 3m / 5m / 7m / 10m
No repainting (bar-close confirmed logic)
Works for both LONG & SHORT
Built-in alert events:
ENTRY_LONG / ENTRY_SHORT / TP1 / EXIT_STOP / EXIT_INVERSE / EXIT_TIMEOUT
Suitable for manual execution, semi-automation (alerts) or full bot integration (webhook JSON)
Purpose
Provide a repeatable, rule-based, non-subjective framework to harvest micro-moves with controlled risk, without relying on lagging indicators or long-term prediction.
(A Strategy / backtesting version is planned as a next iteration.)

HA Reversal + Doji 🔥 Heikin Ashi Reversal + Stochastic Filter (Precision Entry System)
This indicator is designed to detect high–quality reversal entries using a Heikin Ashi candle pattern (Doji + 2 no–wick confirmation) combined with a strict Stochastic filter that uses memory of extreme touches to control trade direction.
✅ Entry Logic
🔹 Bullish BUY Signal
A BUY is triggered only when:
A valid reversal pattern is detected:
Doji candle (pivot) 3 bars back
Followed by 2 bullish candles with no lower wicks
Stochastic touched Oversold (≤ 20) at least once before the signal
Pattern + Stoch alignment = BUY
🔹 Bearish SELL Signal
A SELL is triggered only when:
Valid bearish reversal pattern:
Doji candle (pivot) 3 bars back
Followed by 2 bearish candles with no upper wicks
Stochastic touched Overbought (≥ 80) before the signal
Pattern + Stoch alignment = SELL
🧠 Stochastic “Memory” Filter
This is not a basic OB/OS filter — it uses event memory:
If Stochastic touches Oversold, the system becomes ready for BUY
If it touches Overbought, it becomes ready for SELL
Both directions can be armed at once
Once a BUY or SELL actually triggers, memory resets to neutral
Prevents “signal spam” during chop and keeps direction meaningful
🎯 Why This Works
✔ Filters out random countertrend noise
✔ Only trades after momentum exhaustion
✔ Uses strict Heikin Ashi reversal structure
✔ Works great across crypto, forex, indices, metals
✔ Designed for precision entries and swing continuation traps
⚙️ Customizable Options
Doji detection mode (body % / ticks / hybrid)
Wick tolerance
Heikin Ashi source (chart or calculated)
Stochastic source (raw or smoothed)
Option to avoid duplicate same-direction signals
Visual aids: pattern markers, blocked signals, doji debugging
📌 Best Use Cases
Reversal scalping on 5m/15m
Swing entries on 1H/4H
Trend exhaustion confirmation
Smart Money Concepts entry refinement
Entry timing after liquidity sweeps
🚨 Important
This is not a repainting system. Signals are generated at bar close only. Always combine with proper risk management and market context.
Let me know if you want:
✅ A shorter description
✅ An SEO optimized TradingView title
✅ A strategy version with backtesting
✅ Alerts version for automation

CVD Absorption + Confirmation [Orderflow & Volume]This indicator detects bullish and bearish absorption setups by combining Cumulative Volume Delta (CVD) with price action, candlestick, and volume confirmations.
🔹 What is Absorption?
Absorption happens when aggressive buyers/sellers push CVD to new highs or lows, but price fails to follow through.
Bearish absorption: CVD makes a higher high, but price does not.
Bullish absorption: CVD makes a lower low, but price does not.
This often signals that limit orders are absorbing aggressive market orders, creating potential reversal points.
🔹 Confirmation Patterns
Absorption signals are only shown if they are validated by one of the following patterns:
Engulfing candle with low volume → reversal faces little resistance.
Engulfing candle with high volume → strong aggressive participation.
Pin bar with high volume → absorption visible in the wick.
CVD flattening / slope reversal → shift in aggressive order flow.
🔹 Signals
✅ Bullish absorption confirmed → Green label below the bar.
❌ Bearish absorption confirmed → Red label above the bar.
Each label represents a potential reversal setup after orderflow absorption is validated.
🔹 Alerts
Built-in alerts are included for both bullish and bearish confirmations, so you can track setups in real-time without watching the chart 24/7.
📌 How to Use:
Best applied at key levels (supply/demand, VWAP, OR, liquidity zones).
Look for confluence with your trading strategy before taking entries.
Works on all markets and timeframes where volume is reliable.

Volatility Wick Trap — Smart Reversal EngineThe Volatility Wick Trap — Smart Reversal Engine is a precision reversal detection tool designed for traders who rely on smart money footprints, volatility compression, and liquidity wick exhaustion to time entries near market turns.
💡 Core Components:
Volatility Squeeze Detection: Identifies candles where range compresses significantly compared to the 14-period average true range, highlighting potential breakout zones.
Liquidity Wick Exhaustion: Detects candles with dominant upper or lower wicks, signaling failed liquidity grabs or stop hunts.
Contextual EMA Filter: Uses a 21-period EMA to filter signals, improving accuracy by aligning with market structure bias.
🔍 How It Works:
Green diamond lines mark bullish hidden reversal zones.
Red diamond lines mark bearish hidden reversal traps.
These lines only appear when volatility compresses and wick traps are confirmed within the trend context.
✅ Clean. Minimal. Tactical.
Ideal for scalpers, swing traders, and smart money enthusiasts looking to fade emotional price spikes.

WT + Stoch RSI Reversal Combo📊MR.Z RSI : WT + Stochastic RSI Reversal Combo
This custom indicator combines WaveTrend oscillator and Stochastic RSI to detect high-confidence market reversal points, filtering signals so they only appear when both indicators align.
🔍 Core Components:
✅ WaveTrend Oscillator
Based on smoothed deviation from EMA (similar to TCI logic)
Plots:
WT1 (main line)
WT2 (signal line = SMA of WT1)
Uses overbought/oversold thresholds (default: ±53) to filter signals
✅ Stochastic RSI
Momentum oscillator based on RSI's stochastic value
Plots:
%K: smoothed Stoch of RSI
%D: smoothed version of %K
Adjustable oversold/overbought thresholds (default: 20/80)
🔁 Combined Reversal Signal Logic:
🔼 Buy Signal
WT1 crosses above WT2 below WT oversold level (e.g., -53)
%K crosses above %D below Stoch RSI oversold level (e.g., 20)
🔽 Sell Signal
WT1 crosses below WT2 above WT overbought level (e.g., 53)
%K crosses below %D above Stoch RSI overbought level (e.g., 80)
🔔 Signals are only plotted and alerted if both conditions are true.
📌 Features:
Toggle on/off:
WaveTrend lines and histogram
Stochastic RSI
Combined Buy/Sell signals
Horizontal reference lines (±100, OB/OS)
Fully customizable smoothing lengths and thresholds
Signal plots:
✅ Green up-triangle = Combo Buy
✅ Red down-triangle = Combo Sell
Optional: Circle/cross markers for WT-only and Stoch-only signals
🔔 Built-in alerts for Buy/Sell signals
📈 Use Cases:
Reversal Trading: Wait for both indicators to confirm momentum shift
Entry Filter: Use in combination with trend indicators (like EMA)
Scalping or Swing: Works on intraday and higher timeframes

Stochastic Z-Score [AlgoAlpha]🟠 OVERVIEW
This indicator is a custom-built oscillator called the Stochastic Z-Score , which blends a volatility-normalized Z-Score with stochastic principles and smooths it using a Hull Moving Average (HMA). It transforms raw price deviations into a normalized momentum structure, then processes that through a stochastic function to better identify extreme moves. A secondary long-term momentum component is also included using an ALMA smoother. The result is a responsive oscillator that reacts to sharp imbalances while remaining stable in sideways conditions. Colored histograms, dynamic oscillator bands, and reversal labels help users visually assess shifts in momentum and identify potential turning points.
🟠 CONCEPTS
The Z-Score is calculated by comparing price to its mean and dividing by its standard deviation—this normalizes movement and highlights how far current price has stretched from typical values. This Z-Score is then passed through a stochastic function, which further refines the signal into a bounded range for easier interpretation. To reduce noise, a Hull Moving Average is applied. A separate long-term trend filter based on the ALMA of the Z-Score helps determine broader context, filtering out short-term traps. Zones are mapped with thresholds at ±2 and ±2.5 to distinguish regular momentum from extreme exhaustion. The tool is built to adapt across timeframes and assets.
🟠 FEATURES
Z-Score histogram with gradient color to visualize deviation intensity (optional toggle).
Primary oscillator line (smoothed stochastic Z-Score) with adaptive coloring based on momentum direction.
Dynamic bands at ±2 and ±2.5 to represent regular vs extreme momentum zones.
Long-term momentum line (ALMA) with contextual coloring to separate trend phases.
Automatic reversal markers when short-term crosses occur at extremes with supporting long-term momentum.
Built-in alerts for oscillator direction changes, zero-line crosses, overbought/oversold entries, and trend confirmation.
🟠 USAGE
Use this script to track momentum shifts and identify potential reversal areas. When the oscillator is rising and crosses above the previous value—especially from deeply negative zones (below -2)—and the ALMA is also above zero, this suggests bullish reversal conditions. The opposite holds for bearish setups. Reversal labels ("▲" and "▼") appear only when both short- and long-term conditions align. The ±2 and ±2.5 thresholds act as momentum warning zones; values inside are typical trends, while those beyond suggest exhaustion or extremes. Adjust the length input to match the asset’s volatility. Enable the histogram to explore underlying raw Z-Score movements. Alerts can be configured to notify key changes in momentum or zone entries.

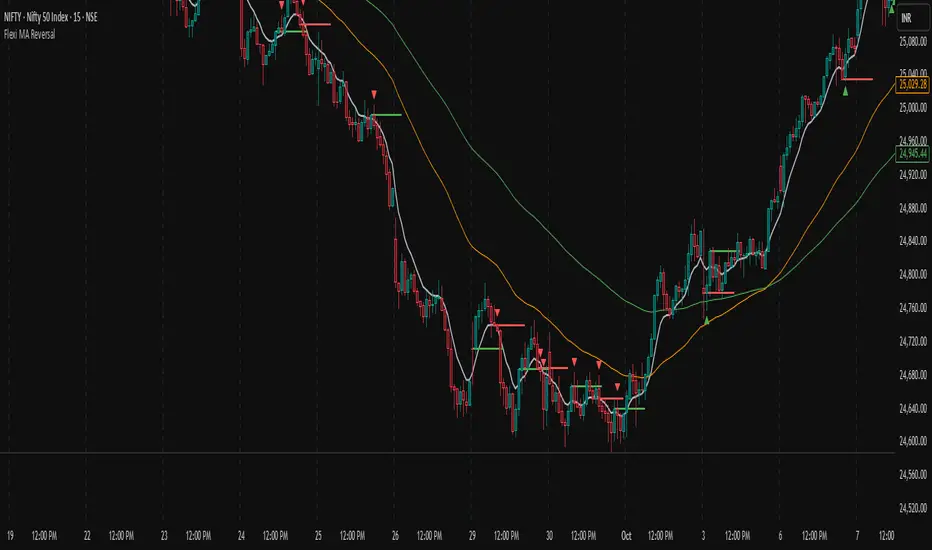
Flexi MA Reversal🔹 FlexiMA Reversal – Customizable MA-Based Reversal Indicator
FlexiMA Reversal is a real-time, moving average-based reversal indicator designed to highlight potential market turning points using signal and alert lines. It provides visual cues for both early alerts and confirmed entry signals on candle close.
🔧 Key Features:
Customizable Moving Average Type: Choose from EMA, SMA, WMA, or VWMA (default is EMA).
Flexible MA Inputs: Configure up to three MAs (commonly used 5, 50, and 200).
Toggle Visibility: Enable or disable each MA line as needed.
Real-Time Alert System:
Thin alert lines appear when a potential reversal is detected.
Thicker signal lines confirm the reversal when price closes beyond the alert level.
Optional Visual Styling:
Choose custom colors for each MA, signal, and alert line.
Alert candles are automatically colored to match the corresponding alert line.
Option to show only signal lines for cleaner charts.
Customizable projection length for both alert and signal lines.
📈 Strategy Logic:
This indicator is designed to detect reversal opportunities based on the relationship between price and a selected short-term moving average.
Bullish Setup:
Price closes below the selected MA (e.g., EMA 5).
A bullish alert line is drawn at the high.
If a subsequent candle closes above the alert line and the MA, a bullish signal line is plotted.
Bearish Setup:
Price closes above the selected MA.
A bearish alert line is drawn at the low.
If a subsequent candle closes below the alert line and the MA, a bearish signal line is plotted.
This approach attempts to capture quick market shifts where short-term momentum reverses direction near key MA levels.
🎯 How to Use:
Although originally developed using the 5 EMA strategy, through testing it was found that using 6, 7, or 8 EMA offers even better signal quality.
To add broader trend context, 50 MA and 200 MA lines are included and can be toggled on/off based on your strategy preference.
🔍 Trend Filtering & Re-Entry Tips:
Due to the nature of shorter moving averages, reversal signals may appear frequently. For better trend alignment:
Use the 50 MA as a trend filter:
❌ Ignore bearish signals when price is above 50 MA
❌ Ignore bullish signals when price is below 50 MA
Alternatively, filtered-out signals can be used for re-entry within the trend:
For example, if you receive a bearish alert and signal above the 50 MA, and the next candle closes back above the bearish alert line, this may be interpreted as a bullish re-entry opportunity into the prevailing uptrend.
🛠️ Styling Tips:
You can disable alert candle coloring in the Style tab of the indicator settings.
Use the "Show Only Signal Lines" checkbox to keep the chart minimalistic while still tracking confirmed entries.
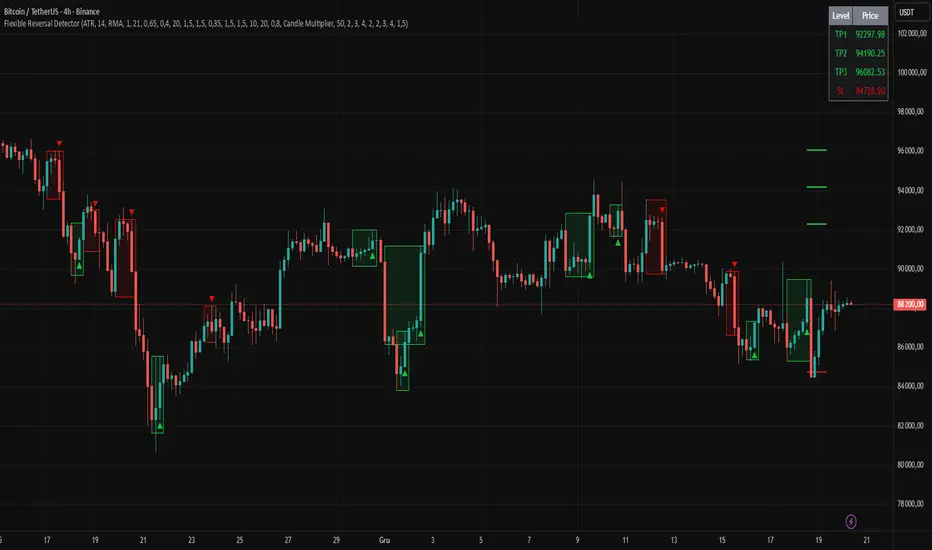
Flexible Reversal DetectorFlexible Reversal Detector
An advanced, fully customizable analytical tool designed to identify local trend reversal zones based on candlestick formations. Users have full control over all logic parameters, making it adaptable to different trading styles and preferences.
Key Features
Adjustable maximum pattern length (number of candles)
Customizable body size ratios for initial, middle, and final candles
Configurable minimum price movement (in %) required before a pattern is considered valid
Colored horizontal lines showing the full length of the pattern – helpful in identifying structure, potential support/resistance zones
Optional volume filter – the volume of the final candle is compared to a volume SMA; multiplier can be adjusted (e.g. 1 = equal to average, 0.8 = 80% of average)
Logic Overview
U Pattern
Each bearish candle is treated as a potential start of a reversal pattern.
Subsequent candles, if small enough and within defined thresholds, form the middle part of the structure.
When a bullish candle with a sufficiently large body appears, it is marked as the final candle of the pattern.
The pattern is considered valid if it was preceded by a defined percentage price drop and – optionally – if the volume condition was met.
∩ Pattern
Each bullish candle may act as the initial candle of a potential reversal pattern in the opposite direction.
Following smaller candles form the middle part, as long as they meet the defined criteria.
The appearance of a strong bearish candle marks the end of the formation.
If this pattern is preceded by a certain price increase (and optionally meets the volume filter), it is highlighted on the chart.
Note: On markets with low volatility or on lower timeframes, it is recommended to reduce the percentage thresholds for signal detection. For more dynamic price action or higher timeframes, consider increasing them accordingly.
Visualization
The final candle of the pattern is marked visually on the chart (depending on direction)
Colored horizontal lines indicate the full span of the pattern – from initial to final candle
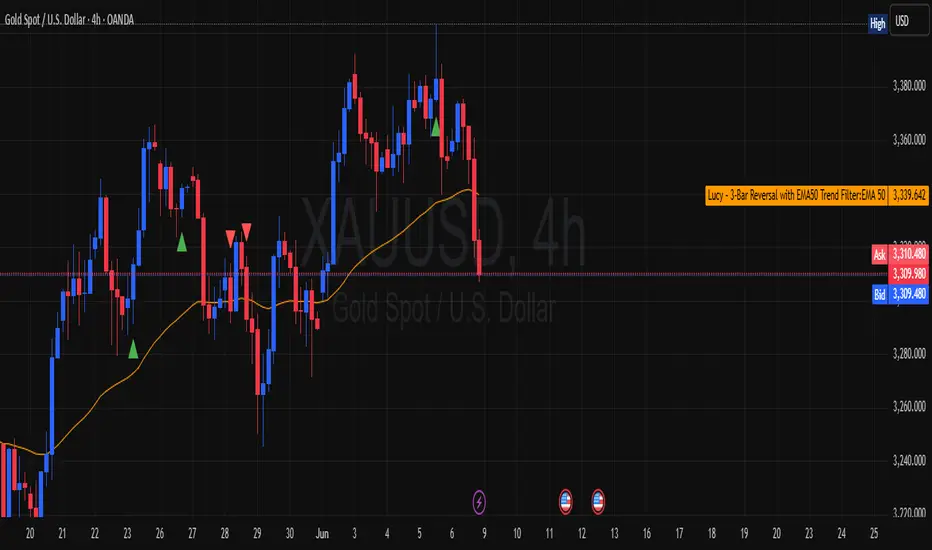
Lucy – 3-Bar Reversal with EMA50 Trend Filter📛 Lucy – 3-Bar Reversal with EMA50 Trend Filter
Purpose:
To detect and highlight bullish and bearish 3-bar reversal patterns on the chart, but only when they align with the dominant trend, defined by the EMA 50.
✅ How It Works
🟢 Bullish 3-Bar Reversal (Buy Setup):
Bar 1 is bearish (close < open)
Bar 2 makes a lower low than Bar 1
Bar 3 is bullish (close > open) and closes above Bar 2’s high
Price must be above EMA 50 (trend filter)
✅ Result: Shows a green triangle below the bar
🔴 Bearish 3-Bar Reversal (Sell Setup):
Bar 1 is bullish (close > open)
Bar 2 makes a higher high than Bar 1
Bar 3 is bearish (close < open) and closes below Bar 2’s low
Price must be below EMA 50
✅ Result: Shows a red triangle above the bar
📊 What It Plots:
🔼 Green triangle below bullish signal bar
🔽 Red triangle above bearish signal bar
🟠 Orange line = EMA50 (trend filter)
🔔 Built-in Alerts:
You’ll get an alert if:
A bullish reversal pattern forms above EMA50
A bearish reversal pattern forms below EMA50
🧠 Use Cases:
Great for trend-following traders who want clean, price-action entries
Works well on intraday (15m/1h) or swing (4h/daily) timeframes
Can be used for manual entries, or converted to strategy for automation
Red & Green Zone ReversalOverview
The “Red & Green Zone Reversal” indicator is designed to visually highlight potential reversal zones on your chart by using a combination of Bollinger Bands and the Relative Strength Index (RSI).
It overlays on the chart and provides background color cues—red for oversold conditions and green for overbought conditions—along with corresponding alert triggers.
Key Components
Overlay: The indicator is set to overlay the chart, meaning its visual cues (colored backgrounds) are drawn directly on the price chart.
Bollinger Bands Calculation
Period: A 20-period simple moving average (SMA) is calculated from the closing prices.
Standard Deviation Multiplier: A multiplier of 2.0 is applied.
Bands Defined:
Basis: The 20-period SMA.
Deviation: Calculated as 2 times the standard deviation over the same period.
Upper Band: Basis plus the deviation.
Lower Band: Basis minus the deviation.
RSI Calculation
Period: The RSI is computed over a 14-period span using the closing prices.
Thresholds:
Oversold Threshold: 30 (used for the red zone condition).
Overbought Threshold: 70 (used for the green zone condition).
Zone Conditions
Red Zone (Oversold):
Criteria: The price is below the lower Bollinger Band and the RSI is below 30.
Purpose: Highlights a situation where the asset may be deeply oversold, signaling a potential reversal to the upside.
Green Zone (Overbought):
Criteria: The price is above the upper Bollinger Band and the RSI is above 70.
Purpose: Indicates that the asset may be overbought, potentially signaling a reversal to the downside.
Visual and Alert Components
Background Coloring:
Red Background: Applied when the red zone condition is met (using a semi-transparent red).
Green Background: Applied when the green zone condition is met (using a semi-transparent green).
Alerts:
Red Alert: An alert condition titled “Deep Oversold Alert” is triggered with the message “Deep Oversold Signal triggered!” when the red zone criteria are satisfied.
Green Alert: Similarly, an alert condition titled “Deep Overbought Alert” is triggered with the message “Deep Overbought Signal triggered!” when the green zone criteria are met.
Important Disclaimers
Not Financial Advice:
This indicator is provided for informational and analytical purposes only. It does not constitute trading advice or a recommendation to buy or sell any asset. Traders should use it as one of several tools in their analysis and should perform their own due diligence.
Risk Management:
Trading inherently involves risk. Past performance is not indicative of future results. Always implement appropriate risk management and use stop losses where necessary.
Summary
In summary, the “Red & Green Zone Reversal” indicator uses Bollinger Bands and RSI to detect extreme market conditions. It visually marks oversold (red) and overbought (green) conditions directly on the chart and offers alert conditions to help traders monitor these potential reversal points.
Enjoy!!

Bollinger Bounce Reversal Strategy – Visual EditionOverview:
The Bollinger Bounce Reversal Strategy – Visual Edition is designed to capture potential reversal moves at price extremes—often termed “bounce points”—by using a combination of technical indicators. The strategy integrates Bollinger Bands, MACD, and volume analysis, and it provides rich on‑chart visual cues to help traders understand its signals and conditions. Additionally, the strategy enforces a maximum of 5 trades per day and uses fixed risk management parameters. This publication is intended for educational purposes and offers a systematic, transparent approach that you can further adjust to fit your market or risk profile.
How It Works:
Bollinger Bands:
A 20‑period simple moving average (SMA) and a user‑defined standard deviation multiplier (default 2.0) are used to calculate the Bollinger Bands.
When the price reaches or crosses these bands (i.e. falls below the lower band or rises above the upper band), it suggests that the price is in an extreme, potentially oversold or overbought, state.
MACD Filter:
The MACD (calculated with standard lengths, e.g. 12, 26, 9) provides momentum information.
For a bullish (long) signal, the MACD line should be above its signal line; for a bearish (short) signal, the MACD line should be below.
Volume Confirmation:
The strategy uses a 20‑period volume moving average to determine if current volume is strong enough to validate a signal.
A signal is confirmed only if the current volume is at or above a specified multiple (by default, 1.0×) of this moving average, ensuring that the move is supported by increased market participation.
Visual Cues:
Bollinger Bands and Fill: The basis (SMA), upper, and lower Bollinger Bands are plotted, and the area between the upper and lower bands is filled with a semi‑transparent color.
Signal Markers: When a long or short signal is generated, corresponding markers (labels) appear on the chart.
Background Coloring: The chart’s background changes color (green for long signals and red for short signals) on the bars where signals occur.
Information Table: An on‑chart table displays key indicator values (MACD, signal line, volume, average volume) and the number of trades executed that day.
Entry Conditions:
Long Entry:
A long trade is triggered when the previous bar’s close is below the lower Bollinger Band and the current bar’s close crosses above it, combined with a bullish MACD condition and strong volume.
Short Entry:
A short trade is triggered when the previous bar’s close is above the upper Bollinger Band and the current bar’s close crosses below it, with a bearish MACD condition and high volume.
Risk Management:
Daily Trade Limit: The strategy restricts trading to no more than 5 trades per day.
Stop-Loss and Take-Profit:
For each position, a stop loss is set at a fixed percentage away from the entry price (typically 2%), and a take profit is set to target a 1:2 risk-reward ratio (typically 4% from the entry price).
Backtesting Setup:
Initial Capital: $10,000
Commission: 0.1% per trade
Slippage: 1 tick per bar
These realistic parameters help ensure that backtesting results reflect the conditions of an average trader.
Disclaimer:
Past performance is not indicative of future results. This strategy is experimental and provided solely for educational purposes. It is essential to backtest extensively and paper trade before any live deployment. All risk management practices are advisory, and you should adjust parameters to suit your own trading style and risk tolerance.
Conclusion:
By combining Bollinger Bands, MACD, and volume analysis, the Bollinger Bounce Reversal Strategy – Visual Edition provides a clear, systematic method to identify potential reversal opportunities at price extremes. The added visual cues help traders quickly interpret signals and assess market conditions, while strict risk management and a daily trade cap help keep trading disciplined. Adjust and refine the settings as needed to better suit your specific market and risk profile.

5-0 Harmonic Pattern [TradingFinder] 0XABCD 50 Harmonic Detector🔵 Introduction
Harmonic patterns are a powerful tool in technical analysis, widely used to detect reversal points and trend changes. Among these, the 5-0 Harmonic Pattern stands out due to its reliance on specific Fibonacci ratios—1.13, 1.618, 2.24, and 0.45 to 0.55—anchored at points 0, X, A, B, C, and D. This pattern provides a structured approach for identifying critical buy and sell points, helping traders achieve optimal entry and exit levels in volatile markets.
This 5-0 Harmonic Pattern indicator automatically detects and marks bullish and bearish formations on the chart, offering precise trading signals based on established harmonic ratios. With its dynamic signals, the 5-0 pattern enables traders to anticipate market movements and capitalize on favorable price trends.
Especially in fast-moving markets, harmonic patterns, particularly the 5-0 Harmonic Pattern, equip traders with an essential framework for identifying reversal opportunities and refining their trading strategies.
Bullish 5-0 Pattern :
Bearish 5-0 Pattern :
🔵 How to Use
The 5-0 Harmonic Pattern indicator is designed to automatically mark the key levels of the harmonic structure: 0, X, A, B, C, and D. By doing so, it detects both bullish and bearish patterns and helps traders recognize optimal entry and exit points.
Formed through specific Fibonacci levels, this pattern signals potential shifts in trend direction, giving traders critical insights for managing entries and exits effectively. The tool proves valuable in high-volatility settings, enabling traders to leverage these signals for refined decision-making.
🟣 Bullish 5-0 Pattern
A bullish 5-0 pattern materializes when Fibonacci levels indicate a potential price reversal to the upside. With points 0, X, A, B, C, and D in alignment, the indicator highlights this upward momentum by displaying a green arrow as a buy signal on the chart. This marking provides a clear entry point, indicating that prices are likely to rise, making it a prime moment for traders to enter long positions.
Additionally, the bullish 5-0 pattern is equipped with tools for traders to set stop-loss and take-profit points based on harmonic lines within the pattern, which represent support and resistance levels. Using these dynamic points, traders can create a more effective risk-reward setup while following the bullish signals in a standalone harmonic strategy.
🟣 Bearish 5-0 Pattern
The bearish 5-0 pattern functions similarly but signals a likely downturn. This pattern emerges when Fibonacci ratios align at points 0, X, A, B, C, and D, predicting a reversal downward. The indicator generates a sell signal, marked by a red arrow, prompting traders to exit long positions or initiate short trades to capitalize on falling prices.
Traders can utilize this bearish pattern for defining exit strategies and setting key levels for stop-loss and take-profit orders. The bearish 5-0 pattern enhances traders’ abilities to gauge critical price levels and manage trade risk effectively, especially in volatile markets. For traders focused on profiting from downward trends, this indicator serves as a powerful tool for timely entries and exits.
🔵 Setting
🟣 Logical Setting
ZigZag Pivot Period : You can adjust the period so that the harmonic patterns are adjusted according to the pivot period you want. This factor is the most important parameter in pattern recognition.
Show Valid Forma t: If this parameter is on "On" mode, only patterns will be displayed that they have exact format and no noise can be seen in them. If "Off" is, the patterns displayed that maybe are noisy and do not exactly correspond to the original pattern.
Show Formation Last Pivot Confirm : if Turned on, you can see this ability of patterns when their last pivot is formed. If this feature is off, it will see the patterns as soon as they are formed. The advantage of this option being clear is less formation of fielded patterns, and it is accompanied by the latest pattern seeing and a sharp reduction in reward to risk.
Period of Formation Last Pivot : Using this parameter you can determine that the last pivot is based on Pivot period.
🟣 Genaral Setting
Show : Enter "On" to display the template and "Off" to not display the template.
Color : Enter the desired color to draw the pattern in this parameter.
LineWidth : You can enter the number 1 or numbers higher than one to adjust the thickness of the drawing lines. This number must be an integer and increases with increasing thickness.
LabelSize : You can adjust the size of the labels by using the "size.auto", "size.tiny", "size.smal", "size.normal", "size.large" or "size.huge" entries.
🟣 Alert Setting
Alert : On / Off
Message Frequency : This string parameter defines the announcement frequency. Choices include: "All" (activates the alert every time the function is called), "Once Per Bar" (activates the alert only on the first call within the bar), and "Once Per Bar Close" (the alert is activated only by a call at the last script execution of the real-time bar upon closing). The default setting is "Once per Bar".
Show Alert Time by Time Zone : The date, hour, and minute you receive in alert messages can be based on any time zone you choose. For example, if you want New York time, you should enter "UTC-4". This input is set to the time zone "UTC" by default.
Conclusion
The 5-0 Harmonic Pattern indicator serves as a robust solution for technical analysts and traders looking to pinpoint market reversal points. By automatically recognizing 5-0 patterns and generating buy and sell signals based on Fibonacci ratios, this tool supports precise trend analysis and entry/exit timing. The indicator’s adjustable alerts, color themes, and pattern toggles allow for comprehensive customization, ensuring alignment with individual trading strategies.
Harmonic patterns, especially the 5-0 Harmonic Pattern, guide traders in identifying high-accuracy entry and exit points, thus aiding in more informed trading decisions. By combining Fibonacci ratio analysis with real-time signal updates, this indicator provides a well-rounded approach for risk management and capitalizing on trading opportunities. Professional traders can harness this tool to enhance technical analysis precision and capitalize on price trends effectively, maximizing profitability in both bullish and bearish markets.

Shark Harmonic Pattern [TradingFinder] Shark Detector Indicator🔵 Introduction
The Shark harmonic pattern, first introduced by Scott Carney in 2011, is a recognized tool in technical analysis. Since its inception, it has been widely adopted by traders as an essential market analysis tool.
Due to its complexity, the Shark pattern can be challenging for novice traders. Therefore, we have developed the Harmonic Pattern Indicator to help analysts and traders easily identify these patterns.
🟣 Understanding the Types of Shark Pattern
In technical analysis, the Shark harmonic pattern forms at the end of trends and is categorized into two types: Bullish and Bearish Shark Patterns.
Bullish Shark Pattern : This pattern appears at the end of a downtrend, indicating a potential reversal to an uptrend. Traders can use this pattern to identify buy entry points. The image below illustrates the core components of the Bullish Shark Pattern.
Bearish Shark Pattern : Conversely, the Bearish Shark Pattern forms at the end of an uptrend, signaling a possible reversal to a downtrend. This pattern prompts traders to shift their positions from buying to selling. The image below showcases the characteristics of the Bearish Shark Pattern.
🔵 How to Use
🟣 Trading with the Bullish Shark Pattern
The Bullish Shark Pattern acts as a reversal pattern, helping traders identify the end of a downtrend and the beginning of an uptrend. It consists of five key points that indicate alternating bullish and bearish movements.
Upon the complete formation of this pattern, traders can look for opportunities to enter buy trades. To manage risk effectively, it is advisable to set a stop-loss below the lowest price point within the pattern.
🟣 Trading with the Bearish Shark Pattern
Similarly, the Bearish Shark Pattern functions as a reversal pattern but in the opposite direction. It helps traders identify the end of an uptrend and the onset of a downtrend.
After the pattern fully forms, traders can seek sell entry opportunities. As with the bullish pattern, placing a stop-loss above the highest price point within the pattern is recommended for risk management.
🔵 Setting
🟣 Logical Setting
ZigZag Pivot Period : You can adjust the period so that the harmonic patterns are adjusted according to the pivot period you want. This factor is the most important parameter in pattern recognition.
Show Valid Format : If this parameter is on "On" mode, only patterns will be displayed that they have exact format and no noise can be seen in them. If "Off" is, the patterns displayed that maybe are noisy and do not exactly correspond to the original pattern.
Show Formation Last Pivot Confirm : if Turned on, you can see this ability of patterns when their last pivot is formed. If this feature is off, it will see the patterns as soon as they are formed. The advantage of this option being clear is less formation of fielded patterns, and it is accompanied by the latest pattern seeing and a sharp reduction in reward to risk.
Period of Formation Last Pivot : Using this parameter you can determine that the last pivot is based on Pivot period.
🟣 Genaral Setting
Show : Enter "On" to display the template and "Off" to not display the template.
Color : Enter the desired color to draw the pattern in this parameter.
LineWidth : You can enter the number 1 or numbers higher than one to adjust the thickness of the drawing lines. This number must be an integer and increases with increasing thickness.
LabelSize : You can adjust the size of the labels by using the "size.auto", "size.tiny", "size.smal", "size.normal", "size.large" or "size.huge" entries.
🟣 Alert Setting
Alert : On / Off
Message Frequency : This string parameter defines the announcement frequency. Choices include: "All" (activates the alert every time the function is called), "Once Per Bar" (activates the alert only on the first call within the bar), and "Once Per Bar Close" (the alert is activated only by a call at the last script execution of the real-time bar upon closing). The default setting is "Once per Bar".
Show Alert Time by Time Zone : The date, hour, and minute you receive in alert messages can be based on any time zone you choose. For example, if you want New York time, you should enter "UTC-4". This input is set to the time zone "UTC" by default.
🔵 Conclusion
The Shark harmonic pattern is a potent analytical tool in technical analysis that aids traders in identifying critical reversal points in financial markets. Whether in a bullish or bearish context, this pattern provides clear trend change signals, allowing traders to enter trades with greater precision and optimize their strategies.
However, as with all analytical methods, it is essential to supplement the Shark pattern with additional analyses and strict risk management to avoid potential losses. Incorporating this pattern into a comprehensive trading strategy can lead to better trade outcomes and more opportunities for success

Bearish 3 Bars Reversal PatternThis TradingView Pine Script indicator identifies and highlights a bearish 3-bar reversal pattern on your chart. The script also calculates the percentage difference between the current low and the previous high, displaying this value on the chart when the pattern is detected.
Features:
Pattern Detection:
The script detects a bearish 3-bar reversal pattern when the high of the previous bar is higher than the high of the bar before it, and the current high is lower than the previous high.
Percentage Difference Calculation:
When the pattern is detected, the script calculates the percentage difference between the current low and the previous high. This percentage is displayed on the chart.
Visual Indicators:
When a bearish 3-bar reversal pattern is detected, a label is created on the chart showing the calculated percentage difference. The label is styled with a downward arrow, red color, and white text for clear visibility.
Alerts:
An alert condition is set up to notify users when the bearish 3-bar reversal pattern is detected. This allows traders to take timely action based on the pattern.

Bullish 3 Bars Reversal PatternThis TradingView Pine Script indicator identifies and highlights a bullish 3-bar reversal pattern on your chart. The script also calculates the percentage difference between the current high and the previous low, displaying this value on the chart when the pattern is detected.
Features:
Pattern Detection:
The script detects a bullish 3-bar reversal pattern when the low of the previous bar is lower than the low of the bar before it, and the current low is higher than the previous low.
Percentage Difference Calculation:
When the pattern is detected, the script calculates the percentage difference between the current high and the previous low. This percentage is displayed on the chart.
Visual Indicators:
When a bullish 3-bar reversal pattern is detected, a label is created on the chart showing the calculated percentage difference. The label is styled with an upward arrow, green color, and white text for clear visibility.
Alerts:
An alert condition is set up to notify users when the bullish 3-bar reversal pattern is detected. This allows traders to take timely action based on the pattern.
