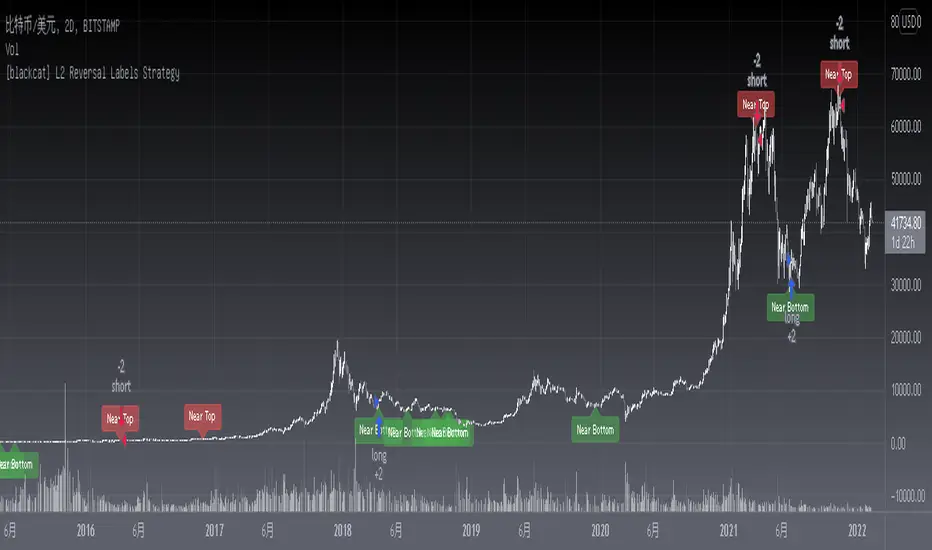
[blackcat] L2 Reversal Labels StrategyLevel: 2
Background
There is a Chinese proverb that says: "The great way leads to simplicity". This indicator is the representative of this meaning. Through the processing of the most common MACD indicator data, it is possible to quickly determine the market price: whether the current price is at a historical high or low, whether a reversal will happen soon, etc. at a glance.
Function
This is the strategy version of the same indicator which performs screening and filtering through the fast and slow line data corresponding to the output of the standard MACD indicator, so as to realize the function of judging the top and bottom of the trend.
Inputs
N/A
Key Signal
Near Top --> Top is reached and reversal may happen soon. (red labels)
Near Bottom --> Bottom is reached and reversal may happen soon. (green labels)
Remarks
The backtest result is picked up and optimized for BTCUSD '2D' time frame, it does not work constantly well for any time frame. You need to combine other indicators for other trading pair and time frame.
You can add alerts for this version.
This is a Level 2 free and open source indicator.
Feedbacks are appreciated.
Cerca negli script per "reversal"
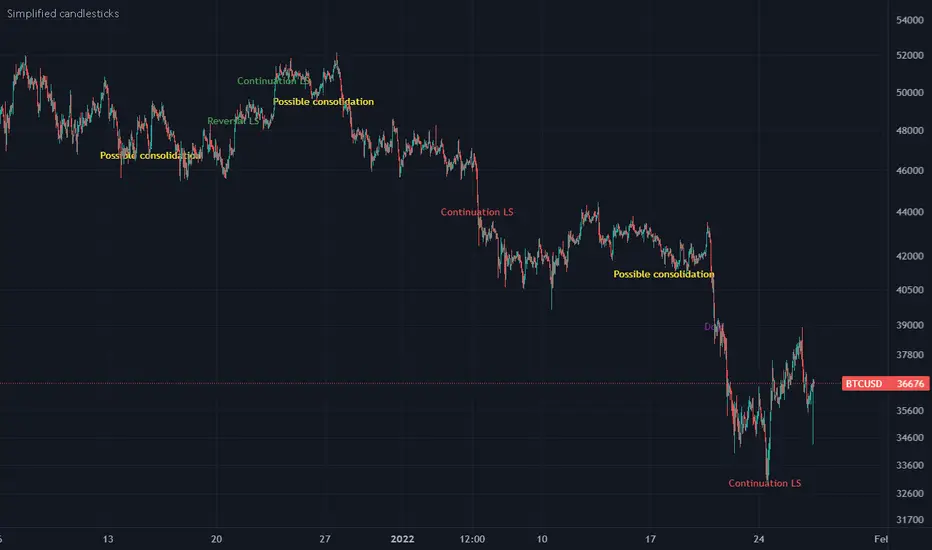
Simplified candlesticksSimplified candlesticks tracks sticks for their body and wick
- For Long bars sticks ( LS ) tracks and marks them on down trend as continuation and reversal if moves appositive direction.
- For largest wicks on ends marks as regular Doji
- For large wicks and medium body marks as possible consolidation
- For only bottom bigger wick as bears weakness if trend down and possible reversal if trend is up.
- For only upper bigger wick as bulls weakness if trend up and possible reversal if trend is down
[blackcat] L2 Reversal LabelsLevel: 2
Background
There is a Chinese proverb that says: "The great way leads to simplicity". This indicator is the representative of this meaning. Through the processing of the most common MACD indicator data, it is possible to quickly determine the market price: whether the current price is at a historical high or low, whether a reversal will happen soon, etc. at a glance.
Function
This indicator performs screening and filtering through the fast and slow line data corresponding to the output of the standard MACD indicator, so as to realize the function of judging the top and bottom of the trend.
Inputs
N/A
Key Signal
Near Top --> Top is reached and reversal may happen soon. (red labels)
Near Bottom --> Bottom is reached and reversal may happen soon. (green labels)
Remarks
This is a Level 2 free and open source indicator.
Feedbacks are appreciated.

Fear Of Missing Out grid of forex tradingAbstract
This script finds potential safe grids placing limit orders without fear of missing out.
This script computes grids according to power of 1.0025 .
You can reference those price levels for your trading.
Introduction
Grid trading is a popular trading method.
Traders plan several price levels as grids and repeat buying at lower grids and selling at higher grids.
Grids can be round number like multiple of 100 pips.
Grids can also be support and resistance according to price history.
Some traders may think they need to adjust grids to trade.
However, there are several problems in choosing grids.
One problem is rate of change is related and therefore exponential. 20 to 30 is different from 30 to 40.
Another interesting point is there are some special impressing reversal price levels.
Several months ago, I had a question why usdjpy bounced near 108.3 .
After using a calculator, I found that 108.3 = 100 * 1.083 ≒ 100 * pow(1.0025,31) .
1.0025 , as known as 0.25% of change, is a potential stop out zone.
Therefore, we can compute grids and one grid is a little more than 1.0025 times than an another one.
After we finished computing grids, we can consider buy and sell near those grids.
Note that different traders may obtain different grid values.
For example, from 1.0 to 2.0 , it can be splited as 270 grids or 277 grids because pow(1.0025,277)<2 .
Those grids cannot always imply potential reversal points but they can be useful for traders looking for 0.25% profit targets with reducing fearing of buying or selling too early.
Computing grids
This script split from 1.0 to 10.0 into three segments.
One is 1.0 to 2.0 .
The second segment is from 2.0 to 5.0 .
The third segment is from 5.0 to 10.0 .
This script does the same thing for 0.1 to 1.0 , 10.0 to 100.0 , and so on.
For 1.0 to 2.0 and 5.0 to 10.0 , this script split a segment as 270 grids.
For 2.0 to 5.0 , this script split a segment as 360 grids.
The last step is display the next grids to the daily low and daily high.
Maybe also display the grids behind grids shown.
Parameters
x1,x2,x3,x4 : display the next x1,x2,x3,x4 grids to daily high and daily low. 1 means the next grid to daily high and daily low. 2 means the next grid to 1.
x_seg : default 2.0 . This script split from 1.0 to 10.0 into three segments. One is 1.0 to x_seg. The second segment is from x_seg to 10.0/x_seg . The third segment is from 10.0/x_seg to 10.0 .
x_grid1 : how many grids in the first segment
x_grid2 : how many grids in the second segment
x_lowprice : add this number for bigger grid distance. Generally, you don't need this number when trading forex but you may need it in stock trading. For stocks with price between 50 to 100, I recommend you use x_lowprice=100.
Conclusion and suggestions
This script can find potential grids for trading.
If price touches grids usually, we can consider buy and sell after price touches grids.
If price reverses before touching grids usually, we may consider buy and sell before price touches grids.
Those grids can remind us don't buy too much unless the price touches the next grid.
For instruments with less volatility, maybe we need more grids.
For traders with more money, they may also consider more grids for more dedicated range trading to collect more profit.
Reference
Sorry, I forgot them.

Continuation and Reversal Patterns
This script helps in identifying the reversal and continuation patterns in the japanese candle sticks this can be applied across all time frames
we can configure the maximum number of weak candles in the zone such that we can configure the strength as per end user but maximum base candles is restricted to 5
as any candles greater than that will make the pattern weak
Note : This is not a strategy rather a useful tool which suggests there might be continuation to the existing trend or there might be reversal , so use them with combination of other indicators and price action for better results

Key ReversalA key reversal is possible reversal in trend when a the candle engulf completely, the body and wick, of the two previous candles.

HOLP/LOHPThe HOLP strategy was developed by trader-author John F. Carter in his book 'Mastering the trade: proven techniques for profiting from intraday and swing trading set ups' (ISBN 0-07-145958-8). The strategy, which gives buy signals, is a reversal strategy. Reversal strategies try to determine the point in time when a trend reverses direction. In his book John F. Carter is actually skeptical of taking a position against the trend, quoting classics like "never catch a falling knife" (buy a steep sell off) and "never step in front of a train" (short sell a strong market). Given his skepticism he decides to base his strategy on the one single factor which he deems relevant: the market price.

Inverse BandsThis was the result of quite some time spent examining how much information could be gleamed by studying the interactions between Keltner Channels, STARC Bands and Bollinger Bands. I was surprised by the results.
First of all, there are four fills that are black. Set the transparency of those to 0 and you'll see this indicator the way that it's meant to be seen. Those fills belong to unused sections of the Bollinger Bands.
There are two clouds which represent STARC Bands and the Keltner Channel. There is some delay when they flip from bullish (green) to bearish (red), but they are indicative of the trend. The space between them is black and the narrower that space is, the greater volatility is. Because of this, we don't need the exterior Bollinger Bands.
The Bollinger Bands remain visible as the yellow interior clouds on the top cloud and the blue interior clouds on the bottom cloud. Often, the thicker the yellow or blue cloud is, the less severe a throwback from a given trend reversal will be. Often the thinner that yellow or blue cloud is, the more severe the trend reversal will be. If price is rising into a thin interior yellow cloud, the following dip will be substantial. If price action dips towards a thicker interior blue cloud, often the pump following that dump will be less enthusiastic.
We preserve the Keltner Channel and STARC bands as our cloud because the way that they interact with the three basis lines yields a lot of information.
The yellow Bollinger basis line tells us about trend strength. The closer the BB basis line is to the top of the top cloud or the bottom of the bottom cloud, the stronger the trend is. When it enters the cloud very close to the bottom of the bottom cloud, you know you're looking at a strong pump, and vice versa when it's close to the top of the top cloud.
The purple Keltner Channel basis line and orange STARC Band basis line can forecast short term trend changes one candlestick in advance by contacting any line in either cloud. The moment either basis line touches or crosses any boundary of the clouds, you know that the next candle will change directions. In an uptrend, a touch or cross means the next candle will have a lower high point. In a downtrend, a cross or touch means the next candle will have a higher high point. This is most useful in scalping.
It'd be pretty easy to slap some crossover alerts on to this and useful considering that they come a candle in advance. Feel free to further explore and develop this.

Pivot Reversal AlertsPivot Reversal Study script, for generating Alerts and visual plotting of Pivot Reversal lines on the charts. Use a Strategy script (like Figs & Dates), for backtesting different settings on various time frames and charts.

Pivot of Pivot Reversal Strategy [QuantNomad]Continue looking for more signifcant pivot points.
This script is based on my "Significant Pivot Reversal Strategy".
In this strategy I use concept of pivot of pivot points.
So for PoP I require that pivot highs point should have 2 lower pivot highs points around them and pivot low 2 higher pivot lows points.
Transparent lines represent usual pivot levels ints.
Not transparent lines represent pivot of pivot levels.
Link to original script:

QuantNomad - Significant Pivot Reversal Strategy AlertsAlerts for "Significant Pivot Reversal Strategy":
As one of the ways to filter out insignificant levels I decided to check that pivot point is not above/below neighbors, but check that it's above/below at least by a certain amount.
I use ATR, so in params, you can set length of ATR and also ATR multiplier. The new level will be calculated only if PP will be above/below neighbors by atr * atr_mult.
It seems this approach might help in some cases.

QuantNomad - Significant Pivot Reversal StrategyI'm working on improving the Pivot Points Reversal Strategy.
As one of the ways to filter out insignificant levels I decided to check that pivot point is not above/below neighbors, but check that it's above/below at least by a certain amount.
I use ATR, so in params, you can set length of ATR and also ATR multiplier. The new level will be calculated only if PP will be above/below neighbors by atr * atr_mult.
It seems this approach might help in some cases.
Here I have PivotPoint + RSI strategy:
Pivot Point Reversal + RSI AlertsThese are alerts for previously published strategy:
This strategy joins the Pivot Reversal strategy with the RSI indicator.
We check RSI level at the pivot point level and only if RSI condition is satisfied we update levels for stop orders.

Inside Reversal Engulfing BarInside bar bullish = yellow
Inside Bar bearish = orange
engulfing bar bullish = green
engulfing bar bearish = red
reversal bar bullish = blue
reversal bar bearish = purple

PivotBoss Extreme Reversal SetupPATTERN SUMMARY
1. The first bar of the pattern is about two times larger than the average size of the candles in the lookback
period.
2. The body of the first bar of the pattern should encompass more than 50 percent of the bar's total range, but
usually not more than 85 percent.
3. The second bar of the pattern opposes the first. If the first bar of the pattern is bullish (C > 0), then the second
bar must be bearish (C < 0). If the first bar is bearish (C < 0), then the second bar must be bullish (C > 0).
PATTERN PSYCHOLOGY
The extreme reversal setup is a clever pattern that capitalizes on the ongoing psychological patterns of
investors, traders, and institutions. Basically, the setup looks for an extreme pattern of selling pressure and then
looks to fade this behavior to capture a bullish move higher (reverse for shorts). In essence, this setup is visually
pointing out oversold and overbought scenarios that forces responsive buyers and sellers to come out of the dark
and put their money to work-price has been over-extended and must be pushed back toward a fair area of value
so two-sided trade can take place.
This setup works because many normal investors, or casual traders, head for the exits once their trade
begins to move sharply against them. When this happens, price becomes extremely overbought or oversold,
creating value for responsive buyers and sellers. Therefore, savvy professionals will see that price is above or
below value and will seize the opportunity. When the scared money is selling, the smart money begins to buy, and
Vice versa.
Look at it this way, when the market sells off sharply in one giant candlestick, traders that were short
during the drop begin to cover their profitable positions by buying. Likewise, the traders that were on the
sidelines during the sell-off now see value in lower prices and begin to buy, thus doubling up on the buying
pressure. This helps to spark a sharp v-bottom reversal that pushes price in the opposite direction back toward
fair value.

Kozlod - Pivot Reversal Strategy Alerts V2Its' new version of previously published Kozlod - Pivot Reversal Strategy Alerts
Indicator now better correspond to original strategy. However, there can be some differences. Problem is that it's pretty tricky to implement in plain PineScript same "stop" logic used in strategy.entry of the original script

Cyberpunk Pattern Engine⚡ Cyberpunk Pattern Engine: Neon Technical Analysis
Upgrade your chart aesthetics while maintaining surgical precision. The Cyberpunk Pattern Engine is a high-performance pattern recognition script designed to identify classic reversal formations with a futuristic, neon-soaked visual style.
🛠️ Key Features
・Automated Pattern Detection: Real-time identification of four major price action structures:
・Double Top (DT) - Neon Pink
・Double Bottom (DB) - Neon Cyan
・Head & Shoulders (H&S) - Neon Green
・Inverse H&S (iH&S) - Neon Gold
・Cyber-Visuals: Uses the linefill engine to create semi-transparent glowing triangles, making chart patterns instantly recognizable without cluttering your price action.
・Dual-Language Support: Toggle labels between English and Japanese with a single click.
・Sensitivity Control: Adjust the "Pivot Period" and "Max Difference %" to filter out market noise and find only the most textbook-perfect setups.
🚀 How to Use
1. Pivot Period: Larger values find long-term trends; smaller values find scalp opportunities.
2. Max Difference: Controls how "equal" the tops/bottoms must be. Decrease for strict perfection, increase for more frequent signals.
3. Confirmation: The engine paints the completed pattern once the price crosses the neckline (confirmation level).
日本語版 (Japanese Description)
⚡ Cyberpunk Pattern Engine: ネオン・テクニカル・エンジン
チャート分析に「美学」と「精度」を。Cyberpunk Pattern Engineは、伝統的なチャートパターンを検出し、近未来的なサイバーパンク・スタイルで可視化する高性能インジケーターです。
🛠️ 主な機能
・自動パターン検出: 主要な4つの反転パターンをリアルタイムで識別します:
・ダブルトップ (DT) - ネオンピンク
・ダブルボトム (DB) - ネオンシアン
・三尊 / Head & Shoulders (H&S) - ネオングリーン
・逆三尊 / Inverse H&S (iH&S) - ネオンゴールド
・サイバー・ビジュアル: linefill機能を駆使し、半透明の光る三角形で描画。チャートの視認性を損なうことなく、瞬時に形状を把握できます。
・2ヶ国語対応: ラベル表示を日本語と英語で切り替え可能。
・感度カスタマイズ: 参照期間(Pivot Period)や許容誤差(Max Diff %)を調整することで、ノイズを排除し、自身のトレードスタイルに最適な形状のみを抽出できます。
🚀 使い方
1. 参照期間 (Pivot Period): 数値を大きくすると長期足レベルの大きな波を、小さくするとスキャルピング向けの小さな波を検出します。
2. 許容誤差: 頂点や肩の高さがどれくらい揃っていればパターンとみなすかを調整します。厳格な判断には数値を下げてください。
3. 確定条件: 価格がネックラインをブレイクし、パターンが完成したタイミングで描画が実行されます。

Institutional Scanner FixHere is a professional Pine Script (Version 5) for TradingView. It is optimized to precisely identify the "Absorption" and "Reversal" signals.
What this script does for you:
Auto-Fibonacci: It automatically calculates the 0.618 Golden Ratio of the last 50 candles.
Volume Delta Check: It calculates the delta (buy volume minus sell volume) per candle.
Signal: It marks a "Buy Absorption" when the price touches the 0.618 level but the delta turns positive (green arrow).
The Volume Multiplier is your scanner's "sensitivity knob." It determines how much more volume compared to the average must flow for a signal to be classified as institutionally relevant. Here is the bank standard for calibration, based on your trading strategy and the asset's liquidity:
The rule-of-thumb values for the multiplier
Strategy Type | Recommended Value | Logic
Conservative (High Conviction) | 2.0 to 2.5 | Only extreme volume spikes are marked. Good for swing trades on a daily basis.
Standard (Day Trading) | 1.5 to 1.8 | The "sweet spot." Marks volume that is approximately 50-80% above average.
Aggressive (Scalping) | 1.2 to 1.3 | Reacts very quickly to small order flow changes but produces more "noise" (false signals).

Sakata Reversal MatrixThis indicator automatically detects key candlestick reversal patterns based on the traditional Japanese "Sakata Five Methods."
Key Features: Identifies patterns such as Hammer, Engulfing, Harami, Piercing/Dark Cloud, and Gaps (Sanku).
Strict Star Detection: "Morning Star" and "Evening Star" signals are filtered using a strict logic where the second candle (the star) must be visually isolated from the surrounding candles.
High-Accuracy Filter: Combines RSI (below 30 or above 70) with Bollinger Bands to ensure signals appear only during overbought or oversold conditions, reducing false signals.
Bilingual Support: Easily toggle between Japanese and English labels in the settings.
このインジケーターは、日本の伝統的な相場分析法である「酒田五法」をベースに、主要な反転ローソク足パターンを自動検知します。
主な機能: ハンマー(首吊り線)、包み足、はらみ足、切り込み線、三空などを表示。
厳格な明星判定: 「明けの明星」「宵の明星」は、2本目のローソク足の実体が前後の足から窓を開けて孤立している場合のみ検知する厳格なロジックを採用しています。
高精度フィルタ: RSI(35以下/65以上)とボリンジャーバンドを組み合わせ、相場が過熱しているポイントでのみサインを出すことで、騙しを軽減しています。
バイリンガル対応: 設定から日本語と英語の表示を切り替え可能です。

EMA Spread Exhaustion DetectorEMA Spread Exhaustion – Reversal Scalper's Tool
Identifies trend exhaustion for high-probability counter-trend entries. Triggers when EMA(4/9/20) stack is fully aligned and spread stretches beyond ±ATR threshold. Ideal confluence for TDI hooks + strong rejection candles on 15s charts. Visual markers, fills, and alerts for quick scalps.

20SMA Reversal - Peak/Trough TrendlinesTitle: 20SMA Reversal with Peak/Trough Trendlines
Description (English): This indicator detects pivot points where the 20-period SMA reverses direction (forming a V-shape or an Arch-shape). Upon detection, it automatically identifies the local peak/trough from a lookback period and connects them with an extended trendline if they show a "Lower High" or "Higher Low" pattern. Useful for identifying trend structural changes and potential breakout levels.
概要(日本語): このインジケーターは、20期間SMAが反転(V字回復や山なり反転)するポイントを検出します。反転確定時に、指定した遡り期間内の高値・安値を自動的に特定し、それらが「高値切り下がり」または「安値切り上がり」の条件を満たす場合に、右側に延長されたトレンドラインを描画します。トレンドの構造変化やブレイクアウトの目安として活用いただけます。


Opening Range candle percent of ATRIt takes the opening range of the first candle - 5, 10, 15 or whatever minute - and finds what percent of the ATR that is. So if the opening candle high is 15 and low is 14, its range is 1. If the ATR (daily or whatever you want) is 2, then the opening candle's range is 50% of the ATR.
The percentage is displayed on right in a blue box.
The indicator is used in reversal strategies, since opening candles that eat up a large amount of the daily ATR have a higher probability of reversing.
Indicator made with ChatGPT.
