Opening Range candle percent of ATRIt takes the opening range of the first candle - 5, 10, 15 or whatever minute - and finds what percent of the ATR that is. So if the opening candle high is 15 and low is 14, its range is 1. If the ATR (daily or whatever you want) is 2, then the opening candle's range is 50% of the ATR.
The percentage is displayed on right in a blue box.
The indicator is used in reversal strategies, since opening candles that eat up a large amount of the daily ATR have a higher probability of reversing.
Indicator made with ChatGPT.
Cerca negli script per "reversal"

Session ATR Progression Tracker📊 Session ATR Progression Tracker - SIYL Regression Trading Tool
Track how much of your instrument's 7-day Average True Range (ATR) has been covered during the current trading session. This indicator is specifically designed for regression traders who follow the "Stay In Your Lane" (SIYL) methodology, helping you identify when the probability of mean reversion significantly increases. If you are interested in more on that check out Rod Casselli and tradersdevgroup.com.
🎯 Key Features:
• Real-time ATR Coverage Percentage - See at a glance what percentage of the 7-day ATR has been covered in the current session
• SIYL-Optimized Thresholds - See at a glance when the instrument has achieved 80% and 100% ATR coverage, the proven thresholds where mean reversion probability increases (customizable)
• Flexible Session Modes:
- Daily: Resets at calendar day change
- Session: Uses exchange-defined trading sessions
- Custom Session: Set your exact session start/end times (perfect for futures traders and international markets)
• Visual Alerts - Color-coded display (gray → orange → red) and optional background highlighting
• Repositionable Display - Choose from 9 screen positions to avoid chart clutter
• Session Markers - Green triangles mark the start of each new session
• Detailed Stats - View current range, ATR value, session high/low, and session status
💡 Why Use This Indicator?
This tool is built around a proven concept: regression trading becomes significantly more effective once a session has achieved at least 80% of its 7-day ATR. At this threshold, the probability of price reverting to mean increases substantially, creating higher-probability trade setups for SIYL practitioners.
Benefits for regression traders:
- Identify optimal entry points when mean reversion probability is highest (≥80% ATR coverage)
- Avoid premature regression entries before adequate range has been established
- Recognize when daily moves have "earned their range" and are ripe for reversal
- Time fade-the-move and counter-trend strategies with statistical backing
- Improve win rates by trading only after proven probability thresholds are met
⚙️ Setup Instructions:
1. Add the indicator to your chart
2. Select your preferred "Reset Mode" (recommend "Custom Session" for futures/international markets)
3. If using Custom Session, enter your session times in 24-hour format (e.g., 0930-1600 for US stocks, 1700-1600 for CME futures)
4. Adjust alert thresholds if desired (default: 80% and 100% - proven SIYL thresholds)
5. Position the display where it's most visible on your chart
📈 Works Across All Markets:
Stocks • Futures • Forex • Indices • Crypto • Commodities
Perfect for regression traders, mean reversion specialists, and SIYL practitioners who want to trade with probability on their side by entering only after the session has "earned its range."
---
Tip: For futures contracts with overnight sessions that span calendar days (like MES, MNQ, MYM), use "Custom Session" mode with your exchange's official session times for accurate tracking.

Tomb Reversal Signal Engulfing + RSI Momentum DetectorTomb is a fast and minimalistic reversal-detection indicator built to capture high-probability turning points in the market.
It combines engulfing candlestick patterns, a strong candle body filter, and RSI momentum analysis to generate precise BUY and SELL signals with minimal noise.
🔍 How it Works
The indicator triggers:
✅ BUY Signal
Bullish engulfing pattern appears
Candle body strength > 50% of total range (real momentum)
RSI below 50 (bearish momentum weakening)
Price decreasing over the last 5 bars (down-trend exhaustion)
✅ SELL Signal
Bearish engulfing pattern
Candle body shows strength
RSI above 50 (bullish momentum weakening)
Price increasing over the last 5 bars (up-trend exhaustion)
⚡ Why Tomb Works
Filters out weak signals using candle structure
Detects momentum shifts early
Works on all markets: Crypto, Forex, Indices, Stocks
Ideal for scalping, day trading, or swing trading
🎯 Purpose
To highlight the exact moments where the market shows exhaustion and is ready to reverse—before most traders see it.
📌 Recommended Use
For best performance:
Combine with trend tools such as EMA 200 or market structure
Look for signals at support/resistance or liquidity zones

Liquidity Sweep & Reversal MapLiquidity Sweep & Reversal Map (LSRM) is a visual tool designed to help traders study how price interacts with key liquidity areas such as daily highs, daily lows, previous-day levels, and potential sweep zones. Its purpose is to map structure, highlight volatility around major reference points, and visualize how price behaves after taking liquidity.
This indicator does not attempt to predict market direction. It simply identifies conditions where price has interacted with a known reference level and marks that interaction for user analysis.
🔍 What This Indicator Shows
1. Key Liquidity Reference Levels
The script automatically draws and updates the following levels:
TH — Today’s High
TL — Today’s Low
PDH — Previous Day High
PDL — Previous Day Low
These levels are widely monitored by many traders and can be helpful when studying liquidity behavior and intraday volatility.
2. Liquidity Sweeps
A liquidity sweep occurs when:
Price briefly moves beyond a major high or low
And then closes back within the prior range
The indicator marks detected sweep interactions with:
BS (Bullish Sweep) when liquidity is taken below a low
SS (Bearish Sweep) when liquidity is taken above a high
A sweep only appears after the bar has closed, helping users analyze completed price structure.
3. Optional Sweep Zones
When enabled, the tool draws a shaded zone between:
The swept wick
The reference level
This can help highlight areas where liquidity was taken.
4. Volume & Candle Filters
The indicator includes optional filters such as:
Relative volume spikes
Strong candle body requirement
These filters are provided only to refine the visual highlight of sweeps; they do not constitute trading signals.
🎛 Customization
Users can configure:
Instrument presets
Sweep buffers
Volume sensitivity
Line visibility and thickness
Label display
Zone visibility
All settings are optional and intended for chart annotation only.
⚠️ Important Notes
This tool is not a trading system, signal generator, or strategy.
It does not provide buy/sell advice or predict future price movement.
All markings are visual aids for chart study and structural analysis only.
Users should rely on their own judgment and independent analysis when making trading decisions.

Slope Rank ReversalThis tool is designed to solve the fundamental problem of "buying low and selling high" by providing objective entry/exit signals based on momentum extremes and inflection points.
The System employs three core components:
Trend Detection (PSAR): The Parabolic SAR is used as a filter to confirm that a trend reversal or transition is currently underway, isolating actionable trade setups.
Dynamic Momentum Ranking: The indicator continuously measures the slope of the price action. This slope is then ranked against historical data to objectively identify when an asset is in an extreme state (overbought or oversold).
Signal Generation (Inflection Points):
Oversold/Buy: A 🟢 Green X is generated only when the slope ranking indicates the market is steeply negative (oversold), and the slope value begins to tick upwards (the inflection point), signaling potential mean reversion.
Overbought/Sell: A 🔴 Red X is generated only when the slope ranking indicates the market is steeply positive (overbought), and the slope value begins to tick downwards, signaling momentum exhaustion.
The core philosophy is simple: Enter only when the market is exhausted and has started to turn.

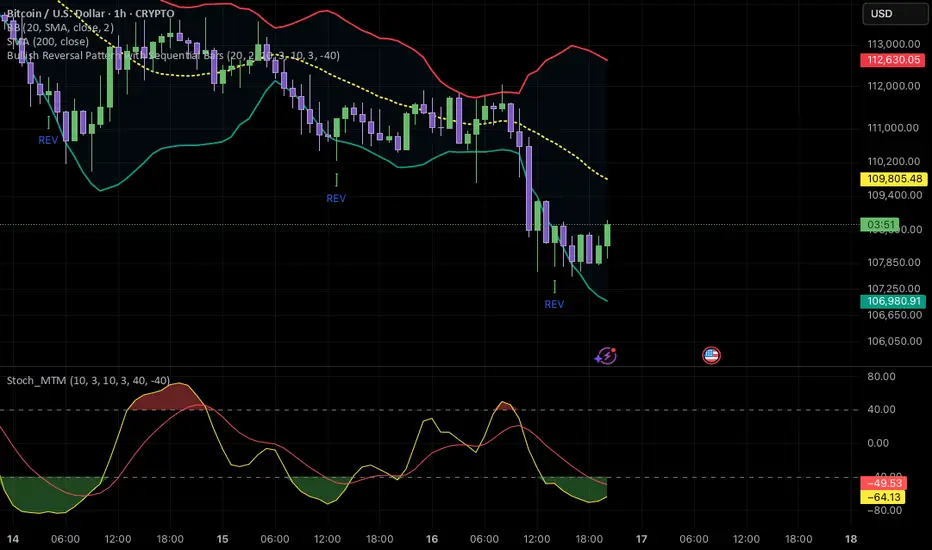
Bullish & Bearish Reversal Pattern with Sequential Bars20 Bollinger Bands and custom Stochasti_MTM Setup
Both long and short reversal signals.

HV Spike Strategy (HVP + OR Breakout + Reversal + TP/SL Modes)Here is a script that I tried to make it simple, although it has several parameters, I will try to explain, here we go:
Logic: Open Range Breakout: otherwise knows as First Candle Rule, usually used for the first candle in the opening of a market session, in my strategy there is an option to use it even for Crypto that operate 24/7, how to do that? Simply by detecting Volatility from the HVP (Historical Volatility Percentile). Then the ORB logic kicks in and the first candle with high volatility gives the ranges for the trades. The proper HVP Activation Threshold has to be selected for each currency pair/index/crypto in order to have maximum profit.
Enter a trade: when the price goes 100% above/below the First Candle Rule Range. That way it is filtering fake breakouts. Also if the price reverses back into the range the strategy takes the opposite trade.
Exit a trade: SL/TP By percentage or ATR, selection in the input menu.
My intention is to avoid using lagging indicators or guessing of Price Action, purely Bull/Bear indication by the first candle.
I hope you find this helpful! Wishing all successful Trades!


Ultra Simple ReversalThis is a simple script that combines Key Features:
✅ No plotting - Only text labels and candle color changes
✅ Reversal candle detection - Changes candle color on high-probability signals
✅ BUY/SELL text labels - Clear directional signals
✅ Four-module confluence - SSL + Squeeze + MTF Pivots + ORB Breakout
✅ Non-repainting - Reliable signals using proper security calls
✅ Pine Script v6 compatible - All syntax errors fixed

Hilly's 0010110 Reversal Scalping Strategy - 5 Min CandlesKey Features and Rationale:
Timeframe: Restricted to 5-minute candles as requested.
Pattern Integration: Includes single (Hammer, Shooting Star, Doji), two (Engulfing, Harami), and three-plus (Morning Star, Evening Star) candlestick patterns, plus reversal patterns based on RSI extremes.
VWAP Cross: Incorporates bullish (price crosses above VWAP) and bearish (price crosses below VWAP) signals, enhanced by trend context.
Volume Analysis: Uses a volume spike threshold to filter noise, with a simple day-start volume comparison for financial environment context.
Financial Environment: Approximates the day's sentiment using early-hour volume compared to current volume, adjusted by trend.
Aggregation: Scores each condition (e.g., 1 for basic patterns, 2 for strong patterns like Engulfing, 3 for three-candle patterns) and decides based on weighted consensus, with trendStrength as a tunable threshold.
Risky Approach: Minimal filtering and a low trendStrength (default 0.5) allow frequent signals, aligning with your $100-to-$200 goal, but expect higher risk.
Suggested Inputs:
EMA Length: 10 (short enough for 5-minute sensitivity).
VWAP Lookback: 1 (uses current session VWAP).
Volume Threshold Multiplier: 1.2 (moderate spike requirement).
RSI Length: 14 (standard, adjustable to 7 for more sensitivity).
Trend Strength Threshold: 0.5 (balance between signals; lower to 0.4 for more trades, raise to 0.6 for fewer).

POC Migration Velocity (POC-MV) [PhenLabs]📊POC Migration Velocity (POC-MV)
Version: PineScript™v6
📌Description
The POC Migration Velocity indicator revolutionizes market structure analysis by tracking the movement, speed, and acceleration of Point of Control (POC) levels in real-time. This tool combines sophisticated volume distribution estimation with velocity calculations to reveal hidden market dynamics that conventional indicators miss.
POC-MV provides traders with unprecedented insight into volume-based price movement patterns, enabling the early identification of continuation and exhaustion signals before they become apparent to the broader market. By measuring how quickly and consistently the POC migrates across price levels, traders gain early warning signals for significant market shifts and can position themselves advantageously.
The indicator employs advanced algorithms to estimate intra-bar volume distribution without requiring lower timeframe data, making it accessible across all chart timeframes while maintaining sophisticated analytical capabilities.
🚀Points of Innovation
Micro-POC calculation using advanced OHLC-based volume distribution estimation
Real-time velocity and acceleration tracking normalized by ATR for cross-market consistency
Persistence scoring system that quantifies directional consistency over multiple periods
Multi-signal detection combining continuation patterns, exhaustion signals, and gap alerts
Dynamic color-coded visualization system with intensity-based feedback
Comprehensive customization options for resolution, periods, and thresholds
🔧Core Components
POC Calculation Engine: Estimates volume distribution within each bar using configurable price bands and sophisticated weighting algorithms
Velocity Measurement System: Tracks the rate of POC movement over customizable lookback periods with ATR normalization
Acceleration Calculator: Measures the rate of change of velocity to identify momentum shifts in POC migration
Persistence Analyzer: Quantifies how consistently POC moves in the same direction using exponential weighting
Signal Detection Framework: Combines trend analysis, velocity thresholds, and persistence requirements for signal generation
Visual Rendering System: Provides dynamic color-coded lines and heat ribbons based on velocity and price-POC relationships
🔥Key Features
Real-time POC calculation with 10-100 configurable price bands for optimal precision
Velocity tracking with customizable lookback periods from 5 to 50 bars
Acceleration measurement for detecting momentum changes in POC movement
Persistence scoring to validate signal strength and filter false signals
Dynamic visual feedback with blue/orange color scheme indicating bullish/bearish conditions
Comprehensive alert system for continuation patterns, exhaustion signals, and POC gaps
Adjustable information table displaying real-time metrics and current signals
Heat ribbon visualization showing price-POC relationship intensity
Multiple threshold settings for customizing signal sensitivity
Export capability for use with separate panel indicators
🎨Visualization
POC Connecting Lines: Color-coded lines showing POC levels with intensity based on velocity magnitude
Heat Ribbon: Dynamic colored ribbon around price showing POC-price basis intensity
Signal Markers: Clear exhaustion top/bottom signals with labeled shapes
Information Table: Real-time display of POC value, velocity, acceleration, basis, persistence, and current signal status
Color Gradients: Blue gradients for bullish conditions, orange gradients for bearish conditions
📖Usage Guidelines
POC Calculation Settings
POC Resolution (Price Bands): Default 20, Range 10-100. Controls the number of price bands used to estimate volume distribution within each bar
Volume Weight Factor: Default 0.7, Range 0.1-1.0. Adjusts the influence of volume in POC calculation
POC Smoothing: Default 3, Range 1-10. EMA smoothing period applied to the calculated POC to reduce noise
Velocity Settings
Velocity Lookback Period: Default 14, Range 5-50. Number of bars used to calculate POC velocity
Acceleration Period: Default 7, Range 3-20. Period for calculating POC acceleration
Velocity Significance Threshold: Default 0.5, Range 0.1-2.0. Minimum normalized velocity for continuation signals
Persistence Settings
Persistence Lookback: Default 5, Range 3-20. Number of bars examined for persistence score calculation
Persistence Threshold: Default 0.7, Range 0.5-1.0. Minimum persistence score required for continuation signals
Visual Settings
Show POC Connecting Lines: Toggle display of colored lines connecting POC levels
Show Heat Ribbon: Toggle display of colored ribbon showing POC-price relationship
Ribbon Transparency: Default 70, Range 0-100. Controls transparency level of heat ribbon
Alert Settings
Enable Continuation Alerts: Toggle alerts for continuation pattern detection
Enable Exhaustion Alerts: Toggle alerts for exhaustion pattern detection
Enable POC Gap Alerts: Toggle alerts for significant POC gaps
Gap Threshold: Default 2.0 ATR, Range 0.5-5.0. Minimum gap size to trigger alerts
✅Best Use Cases
Identifying trend continuation opportunities when POC velocity aligns with price direction
Spotting potential reversal points through exhaustion pattern detection
Confirming breakout validity by monitoring POC gap behavior
Adding volume-based context to traditional technical analysis
Managing position sizing based on POC-price basis strength
⚠️Limitations
POC calculations are estimations based on OHLC data, not true tick-by-tick volume distribution
Effectiveness may vary in low-volume or highly volatile market conditions
Requires complementary analysis tools for complete trading decisions
Signal frequency may be lower in ranging markets compared to trending conditions
Performance optimization needed for very short timeframes below 1-minute
💡What Makes This Unique
Advanced Estimation Algorithm: Sophisticated method for calculating POC without requiring lower timeframe data
Velocity-Based Analysis: Focus on POC movement dynamics rather than static levels
Comprehensive Signal Framework: Integration of continuation, exhaustion, and gap detection in one indicator
Dynamic Visual Feedback: Intensity-based color coding that adapts to market conditions
Persistence Validation: Unique scoring system to filter signals based on directional consistency
🔬How It Works
Volume Distribution Estimation:
Divides each bar into configurable price bands for volume analysis
Applies sophisticated weighting based on OHLC relationships and proximity to close
Identifies the price level with maximum estimated volume as the POC
Velocity and Acceleration Calculation:
Measures POC rate of change over specified lookback periods
Normalizes values using ATR for consistent cross-market performance
Calculates acceleration as the rate of change of velocity
Signal Generation Process:
Combines trend direction analysis using EMA crossovers
Applies velocity and persistence thresholds to filter signals
Generates continuation, exhaustion, and gap alerts based on specific criteria
💡Note:
This indicator provides estimated POC calculations based on available OHLC data and should be used in conjunction with other analysis methods. The velocity-based approach offers unique insights into market structure dynamics but requires proper risk management and complementary analysis for optimal trading decisions.

BTC 5M Scalper: 3EMA Reversal v1.6 Lite by AIOBest Timeframe: 5 minutes!!
Optimal Asset: BTC/USDT (Bitcoin)
Stop Placement: Below the signal candle's low (for long) / Above the signal candle's high (for short)
Risk/Reward: Minimum 1:2 ratio recommended
Description:
This 3EMA Reversal strategy identifies trend continuation signals using:
Fast EMA (20) and Slow EMA (50) crossover
Volume confirmation (above 20-period average)
Engulfing candle pattern
Built-in stop loss and take profit levels
Usage Instructions:
Apply to BTC/USDT 5-minute chart
Enter long when green triangle appears (stop below signal candle)
Enter short when red triangle appears (stop above signal candle)
TP levels are automatically calculated based on your RR setting
Pro Tip: Combine with 1-hour trend analysis for better results. The strategy works best in trending markets with above-average volume.

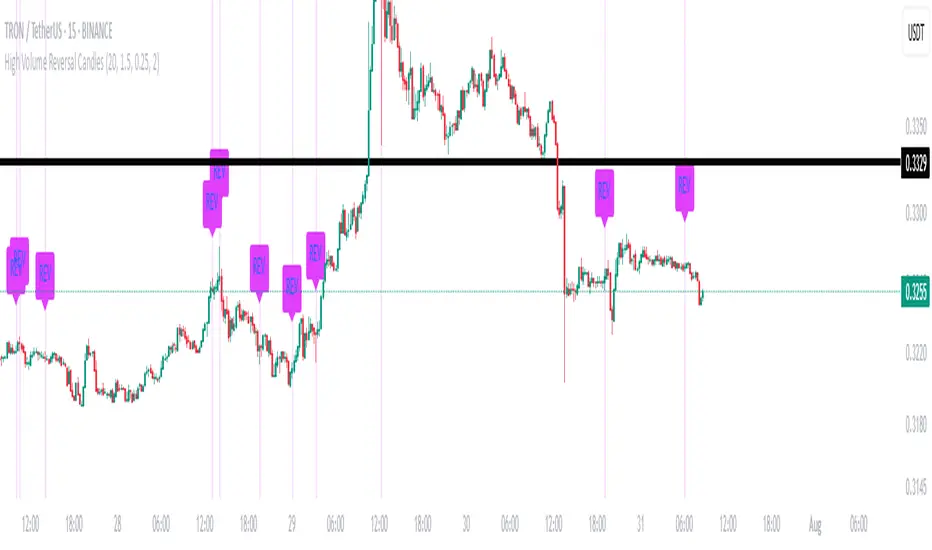
High Volume Reversal CandlesIdentifies candles which display reversal patterns (mainly hammers, inverted hammers, spinning top) on unusually high volume.
This makes the candlestick pattern more likely to fulfil.
Remember to always wait for confirmation; should only be used as an entry locator, not entry trigger.
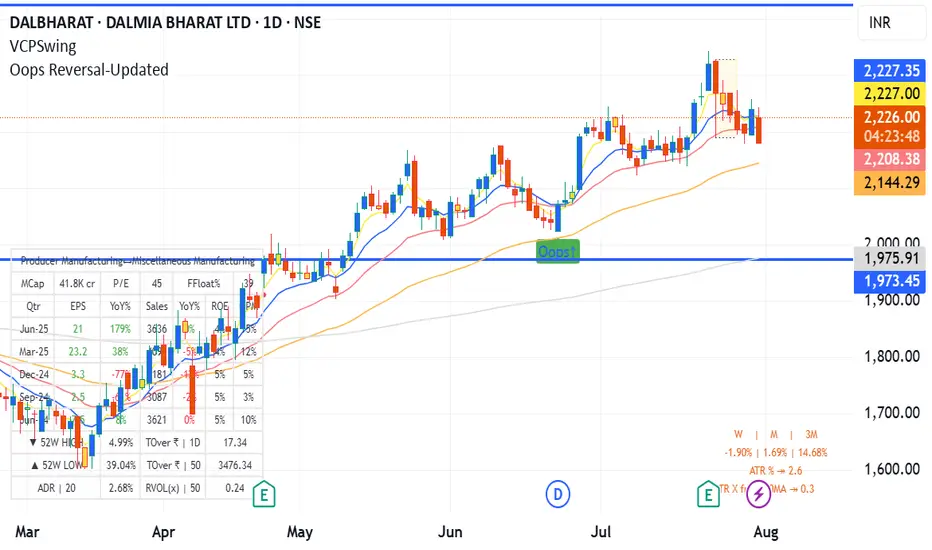
Oops Reversal-Updatedoops reversal - manas arora updated to cover only if it closes above previous day high
MR.Z Stoch RSI %K Reversal Signals🟢 K Strategy Description
The K Strategy is a momentum-based trading technique using the %K line from the Stochastic Oscillator. It is designed to detect potential reversal points in price trends by identifying extreme conditions of overbought and oversold levels.
✅ Core Logic:
The strategy monitors the %K line (a smoothed form of RSI momentum).
A Buy Signal is triggered when:
The %K line dips to or below a defined lower threshold (commonly 30 or less).
This suggests the asset is oversold and may soon reverse upward.
A Sell Signal is triggered when:
The %K line peaks above an upper threshold (commonly 70 or more).
This suggests the asset is overbought and may reverse downward.
⚙️ Adjustable Parameters:
K Length: The sensitivity of the %K calculation (affects how fast it responds).
Buy Level: Set your oversold trigger (e.g., 20–40).
Sell Level: Set your overbought trigger (e.g., 60–100).
Signal Smoothing (optional): Helps reduce noise and avoid false triggers.
📈 Use Case:
This strategy is effective in ranging markets where prices frequently oscillate. It can also be used with other indicators (like EMA, volume filters, or price action confirmation) to increase accuracy in trending conditions.
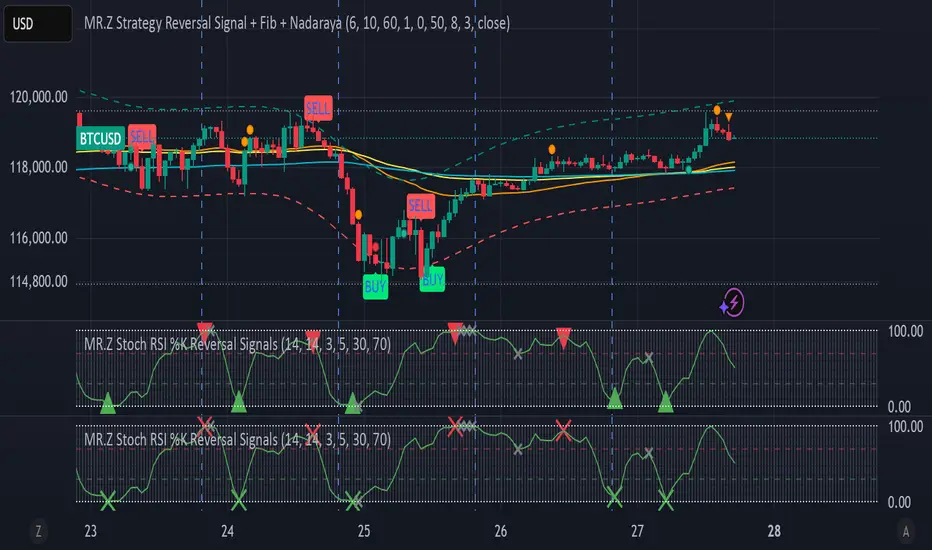
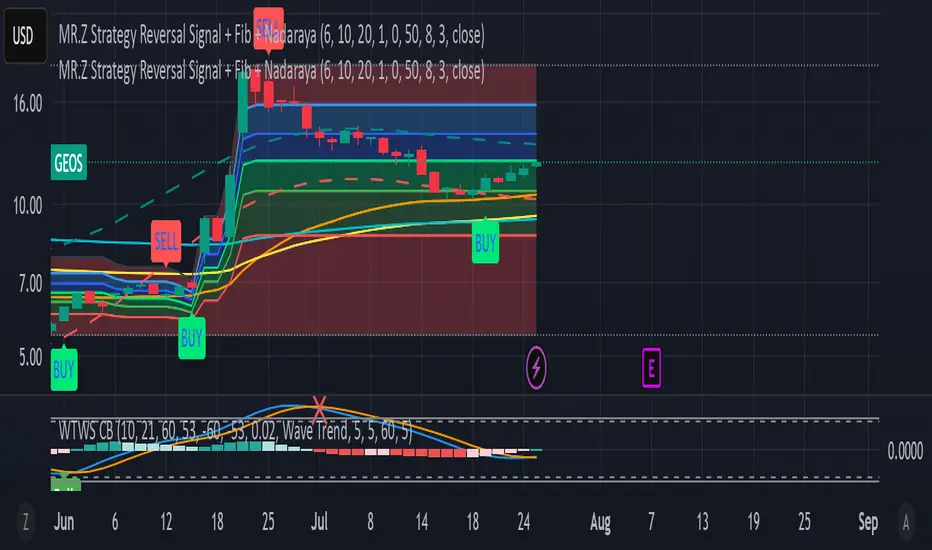
MR.Z Strategy Reversal Signal Nadaraya SMA)Nadaraya-Watson Envelope (NW Envelope):
A smoothed, non-linear dynamic envelope that adapts to price structure. It visually identifies price extremes using kernel regression. The upper and lower bands move with the chart and provide reliable dynamic support and resistance.
EMA Levels:
Includes three key exponential moving averages:
EMA 50 (short-term trend)
EMA 100 (medium-term)
EMA 200 (long-term, institutional level)
Fully Scrollable and Responsive:
All lines and envelopes are plotted using plot() so they move with the chart and respond to zoom and pan actions naturally.
🧠 Ideal Use:
Identify reversal zones, dynamic support/resistance, and trend momentum exhaustion.
Combine WTB and NW Envelope for confluence-based entries.
Use EMA structure for trend confirmation or breakout anticipation.
Let me know if you'd like to add:
Divergence detection
Buy/Sell signals
Alerts or signal filtering options
I’ll be happy to extend the description or the script accordingly!
Quantum Reversal# 🧠 Quantum Reversal
## **Quantitative Mean Reversion Framework**
This algorithmic trading system employs **statistical mean reversion theory** combined with **adaptive volatility modeling** to capitalize on Bitcoin's inherent price oscillations around its statistical mean. The strategy integrates multiple technical indicators through a **multi-layered signal processing architecture**.
---
## ⚡ **Core Technical Architecture**
### 📊 **Statistical Foundation**
- **Bollinger Band Mean Reversion Model**: Utilizes 20-period moving average with 2.2 standard deviation bands for volatility-adjusted entry signals
- **Adaptive Volatility Threshold**: Dynamic standard deviation multiplier accounts for Bitcoin's heteroscedastic volatility patterns
- **Price Action Confluence**: Entry triggered when price breaches lower volatility band, indicating statistical oversold conditions
### 🔬 **Momentum Analysis Layer**
- **RSI Oscillator Integration**: 14-period Relative Strength Index with modified oversold threshold at 45
- **Signal Smoothing Algorithm**: 5-period simple moving average applied to RSI reduces noise and false signals
- **Momentum Divergence Detection**: Captures mean reversion opportunities when momentum indicators show oversold readings
### ⚙️ **Entry Logic Architecture**
```
Entry Condition = (Price ≤ Lower_BB) OR (Smoothed_RSI < 45)
```
- **Dual-Condition Framework**: Either statistical price deviation OR momentum oversold condition triggers entry
- **Boolean Logic Gate**: OR-based entry system increases signal frequency while maintaining statistical validity
- **Position Sizing**: Fixed 10% equity allocation per trade for consistent risk exposure
### 🎯 **Exit Strategy Optimization**
- **Profit-Lock Mechanism**: Positions only closed when showing positive unrealized P&L
- **Trend Continuation Logic**: Allows winning trades to run until momentum exhaustion
- **Dynamic Exit Timing**: No fixed profit targets - exits based on profitability state rather than arbitrary levels
---
## 📈 **Statistical Properties**
### **Risk Management Framework**
- **Long-Only Exposure**: Eliminates short-squeeze risk inherent in cryptocurrency markets
- **Mean Reversion Bias**: Exploits Bitcoin's tendency to revert to statistical mean after extreme moves
- **Position Management**: Single position limit prevents over-leveraging
### **Signal Processing Characteristics**
- **Noise Reduction**: SMA smoothing on RSI eliminates high-frequency oscillations
- **Volatility Adaptation**: Bollinger Bands automatically adjust to changing market volatility
- **Multi-Timeframe Coherence**: Indicators operate on consistent timeframe for signal alignment
---
## 🔧 **Parameter Configuration**
| Technical Parameter | Value | Statistical Significance |
|-------------------|-------|-------------------------|
| Bollinger Period | 20 | Standard statistical lookback for volatility calculation |
| Std Dev Multiplier | 2.2 | Optimized for Bitcoin's volatility distribution (95.4% confidence interval) |
| RSI Period | 14 | Traditional momentum oscillator period |
| RSI Threshold | 45 | Modified oversold level accounting for Bitcoin's momentum characteristics |
| Smoothing Period | 5 | Noise reduction filter for momentum signals |
---
## 📊 **Algorithmic Advantages**
✅ **Statistical Edge**: Exploits documented mean reversion tendency in Bitcoin markets
✅ **Volatility Adaptation**: Dynamic bands adjust to changing market conditions
✅ **Signal Confluence**: Multiple indicator confirmation reduces false positives
✅ **Momentum Integration**: RSI smoothing improves signal quality and timing
✅ **Risk-Controlled Exposure**: Systematic position sizing and long-only bias
---
## 🔬 **Mathematical Foundation**
The strategy leverages **Bollinger Band theory** (developed by John Bollinger) which assumes that prices tend to revert to the mean after extreme deviations. The RSI component adds **momentum confirmation** to the statistical price deviation signal.
**Statistical Basis:**
- Mean reversion follows the principle that extreme price deviations from the moving average are temporary
- The 2.2 standard deviation multiplier captures approximately 97.2% of price movements under normal distribution
- RSI momentum smoothing reduces noise inherent in oscillator calculations
---
## ⚠️ **Risk Considerations**
This algorithm is designed for traders with understanding of **quantitative finance principles** and **cryptocurrency market dynamics**. The strategy assumes mean-reverting behavior which may not persist during trending market phases. Proper risk management and position sizing are essential.
---
## 🎯 **Implementation Notes**
- **Market Regime Awareness**: Most effective in ranging/consolidating markets
- **Volatility Sensitivity**: Performance may vary during extreme volatility events
- **Backtesting Recommended**: Historical performance analysis advised before live implementation
- **Capital Allocation**: 10% per trade sizing assumes diversified portfolio approach
---
**Engineered for quantitative traders seeking systematic mean reversion exposure in Bitcoin markets through statistically-grounded technical analysis.**

BBS – Bond Breadth Signal"When bonds scream, breadth collapses, and fear spikes — BBS listens."
🧠 BBS – Bond Breadth Signal
A reversal timing tool built on macro conviction, not price noise.
The Bond Breadth Signal (BBS) was developed to identify major market inflection points by combining four key market stress indicators:
1) 10-Year Yield ROC – Measures sharp moves in the bond market
2) Z-Score of the 10Y – Captures statistical extremes
3) NSHF (Net Highs–Lows) – Signals internal market strength or weakness
4) TLT ROC + VIX – Confirmations of flight to safety and volatility-driven fear
When all conditions align, BBS marks either a For-Sure Buy or For-Sure Sell — these are rare, high-confidence signals designed to cut through noise and focus on true market dislocations.
🔧 Features:
-Background color and signal arrows on confirmation days
-Signals remain visually active for 3 days for added clarity
-Fully adjustable thresholds and alert toggles
-Plot panel for yield, TLT, NSHF, VIX, and Z-score visuals
This tool isn’t designed to fire every day. It’s meant to wait for those moments when the market truly bends — not just wiggles.
Best used on major indices (SPY, QQQ, IWM) to assess macro turning points.

Market Structure Confluence [AlgoAlpha]OVERVIEW
This script is called "Market Structure Confluence" and it combines classic market structure analysis with a dynamic volatility-based band system to detect shifts in trend and momentum more reliably. It tracks key swing points (higher highs, higher lows, lower highs, lower lows) to define the trend, then overlays a basis and ATR-smoothed volatility bands to catch rejection signals and highlight potential inflection points in the market.
CONCEPTS
Market structure is the foundation of price action trading, focusing on the relationship between successive highs and lows to understand trend conditions. Break of Structure (BOS) and Change of Character (CHoCH) events are important because they signal when a market might be shifting direction. This script enhances traditional structure by integrating volatility bands, which act like dynamic support/resistance zones based on ATR, allowing it to capture momentum surges and rejections beyond just structural shifts.
FEATURES
Swing Detection: It detects and labels Higher Highs (HH), Higher Lows (HL), Lower Highs (LH), and Lower Lows (LL) based on user-defined time horizons, helping traders quickly spot the trend direction.
BOS and CHoCH Lines: When a previous swing point is broken, the script automatically plots a Break of Structure (BOS) line. If the break represents a major trend reversal (a CHoCH), it is marked differently to separate simple breakouts from real trend changes.
Rejection Signals: Special arrows plot when price pierces a band and then pulls back, suggesting a potential trap move or rejection signal in the direction of the new structure.
Alerts: Built-in alerts for structure breaks, CHoCHs, swing points, rejections at bands, and trend flips make it easy to automate setups without manually watching the chart.
USAGE
Set your preferred swing detection size depending on your timeframe and trading style — smaller numbers for intraday, larger numbers for swing trading. Choose whether you want BOS/CHoCH confirmed by candle closes or by wick breaks. Use the volatility band settings to fine-tune how tightly or loosely the bands hug the price, adjusting sensitivity based on market conditions. When a BOS or CHoCH occurs, or when a rejection happens at the bands, the script will highlight it clearly and optionally trigger alerts. Watch for combinations where both structure breaks and volatility band rejections happen together — those are high-quality trade signals. This setup works best when used with basic trend filtering and higher timeframe confirmation.

Sweep Reversal 5M PRO – by [TuNombre]🔹 **Sweep Reversal 5M PRO – by ** 🔹
This indicator is built to detect high-probability *Institutional Sweeps* using Swing Failure Patterns (SFP), fully filtered with Smart Money Concepts (SMC) logic and volume confirmation.
✅ Identifies key liquidity grabs
✅ Confirms with strong impulse candle + increasing volume
✅ Filters out false signals (doji, weak zones, low volume)
✅ Optimized for the 5-minute timeframe (5M)
✅ Compatible with push alerts to your mobile
---
**How to use it:**
1. Wait for a “BUY” or “SELL” signal on the chart
2. Only enter if the next candle confirms with momentum
3. Place a tight stop just beyond the sweep
4. Recommended Take Profit: 1:1 minimum / 2:1 ideal
---
💡 Inspired by institutional trading (SMC, ICT-style setups)
🔒 Developed by – private or team-based use
📲 Activate alerts to get real-time trade opportunities on your phone
---
⚠️ This script does not repaint.
Built for serious traders who want precision, not noise.

DAMA OSC - Directional Adaptive MA OscillatorOverview:
The DAMA OSC (Directional Adaptive MA Oscillator) is a highly customizable and versatile oscillator that analyzes the delta between two moving averages of your choice. It detects trend progression, regressions, rebound signals, MA cross and critical zone crossovers to provide highly contextual trading information.
Designed for trend-following, reversal timing, and volatility filtering, DAMA OSC adapts to market conditions and highlights actionable signals in real-time.
Features:
Support for 11 custom moving average types (EMA, DEMA, TEMA, ALMA, KAMA, etc.)
Customizable fast & slow MA periods and types
Histogram based on percentage delta between fast and slow MA
Trend direction coloring with “Green”, “Blue”, and “Red” zones
Rebound detection using close or shadow logic
Configurable thresholds: Overbought, Oversold, Underbought, Undersold
Optional filters: rebound validation by candle color or flat-zone filter
Full visual overlay: MA lines, crossover markers, rebound icons
Complete alert system with 16 preconfigured conditions
How It Works:
Histogram Logic:
The histogram measures the percentage difference between the fast and slow MA:
hist_value = ((FastMA - SlowMA) / SlowMA) * 100
Trend State Logic (Green / Blue / Red):
Green_Up = Bullish acceleration
Blue_Up (or Red_Up, depending the display settings) = Bullish deceleration
Blue_Down (or Green_Down, depending the display settings) = Bearish deceleration
Red_Down = Bearish acceleration
Rebound Logic:
A rebound is detected when price:
Crosses back over a selected MA (fast or slow)
After being away for X candles (rebound_backstep)
Optional: filtered by histogram zones or candle color
Inputs:
Display Options:
Show/hide MA lines
Show/hide MA crosses
Show/hide price rebounds
Enable/disable blue deceleration zones
DAMA Settings:
Fast/Slow MA type and length
Source input (close by default)
Overbought/Oversold levels
Underbought/Undersold levels
Rebound Settings:
Use Close and/or Shadow
Rebound MA (Fast/Slow)
Candle color validation
Flat zone filter rebounds (between UnderSold and UnderBought)
Available MA type:
SMA (Simple MA)
EMA (Exponential MA)
DEMA (Double EMA)
TEMA (Triple EMA)
WMA (Weighted MA)
HMA (Hull MA)
VWMA (Volume Weighted MA)
Kijun (Ichimoku Baseline)
ALMA (Arnaud Legoux MA)
KAMA (Kaufman Adaptive MA)
HULLMOD (Modified Hull MA, Same as HMA, tweaked for Pine v6 constraints)
Notes:
**DEMA/TEMA** reduce lag compared to EMA, useful for faster reaction in trending markets.
**KAMA/ALMA** are better suited to noisy or volatile environments (e.g., BTC).
**VWMA** reacts strongly to volume spikes.
**HMA/HULLMOD** are great for visual clarity in fast moves.
Alerts Included (Fully Configurable):
Golden Cross:
Fast MA crosses above Slow MA
Death Cross:
Fast MA crosses below Slow MA
Bullish Rebound:
Rebound from below MA in uptrend
Bearish Rebound:
Rebound from above MA in downtrend
Bull Progression:
Transition into Green_Up with positive delta
Bear Progression:
Transition into Red_Down with negative delta
Bull Regression:
Exit from Red_Down into Blue/Green with negative delta
Bear Regression:
Exit from Green_Up into Blue/Red with positive delta
Crossover Overbought:
Histogram crosses above Overbought
Crossunder Overbought:
Histogram crosses below Overbought
Crossover Oversold:
Histogram crosses above Oversold
Crossunder Oversold:
Histogram crosses below Oversold
Crossover Underbought:
Histogram crosses above Underbought
Crossunder Underbought:
Histogram crosses below Underbought
Crossover Undersold:
Histogram crosses above Undersold
Crossunder Undersold:
Histogram crosses below Undersold
Credits:
Created by Eff_Hash. This code is shared with the TradingView community and full free. do not hesitate to share your best settings and usage.

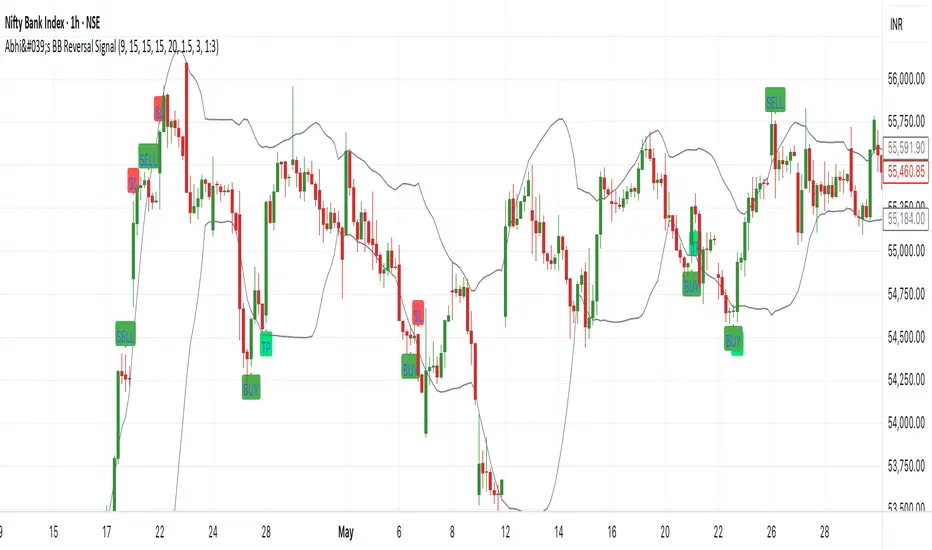
Abhi's Bollinger Band Reversal SignalThis Pine Script indicator is designed to detect reversal trade opportunities using Bollinger Band breakouts. It identifies both buy and sell setups with clearly defined entry, stop-loss (SL), and target (TP) conditions. It also manages trades visually with real-time signal plotting, and limits entries per trading day.
⚙️ How It Works
🔽 Sell Signal Conditions
- The previous candle must close above the upper Bollinger Band, and its entire body must be above the band
- The current candle must fail to break the previous high, and must break below the previous low
- Entry is taken at the previous candle’s low, with SL at its high
- Target is calculated based on a configurable Risk:Reward ratio
🔼 Buy Signal Conditions
- The previous candle must close below the lower Bollinger Band, and its entire body must be below the band
- The current candle must fail to break the previous low, and must break above the previous high
- Entry is at the previous candle’s high, with SL at its low
- Target is calculated using the same Risk:Reward ratio
⏰ Time-Based Exit
- If a trade is still active by a user-defined exit time (e.g. 15:15), the trade is closed
- Labels are plotted to show whether this exit was a profit or loss
🧩 User Inputs
- Start Time for signals
- Exit Time for open trades
- Bollinger Band Settings: Period and Std Dev
- Max Entries Per Day
- Risk:Reward Ratio: Dropdown for 1:1, 1:1.5, ..., 1:3
🎨 Visual Features
✅ BUY and SELL signals are plotted when valid conditions are detected
🟢 TP and 🔴 SL labels show trade outcome
🕒 TIME EXIT labels appear at user-set exit time with green/red coloring based on profitability
📉 Bollinger Bands plotted for visual context
📌 Notes:
- Designed for intraday trading, resets entry counter daily
- Uses bar_index > tradeBarIndex to avoid SL/TP being triggered on the same candle as entry
- Tracks only one trade at a time (tradeActive) — ensures clear, non-overlapping logic