SuperTrend Dual RMAOverview
The SuperTrend Dual RMA is a hybrid volatility-based trend-following system that merges two Relative Moving Averages (RMAs) with an Average True Range (ATR)–anchored SuperTrend framework. The primary purpose of this indicator is to offer a smoother and more reliable depiction of directional bias while maintaining sensitivity to price volatility and market volume.
Traditional SuperTrend implementations typically rely on a single moving average and a fixed volatility envelope. This dual RMA structure introduces an adaptive central tendency line that reacts proportionally to both price and volume, allowing for more nuanced identification of trend reversals and continuation patterns.
**Core Concept**
The indicator is built around two key principles — smoothing and volatility adaptation.
1. **Smoothing:** The use of two separate RMAs with configurable lengths creates a dynamic equilibrium between short-term responsiveness and long-term stability. The first RMA captures near-term directional shifts, while the second provides broader market context. The average of both becomes the foundation of the SuperTrend bands.
2. **Volatility Adaptation:** The ATR multiplier and period define the distance between upper and lower bands relative to recent volatility. This ensures that the SuperTrend line remains flexible across varying market conditions — expanding during high volatility and contracting during calm phases.
**Calculation Steps**
* The indicator first computes two volume-weighted RMAs based on the typical price (`hlc3`) multiplied by trading volume.
* Each RMA is normalized by the smoothed volume to maintain proportional weighting.
* These two RMAs are averaged to produce a “basis line” that reflects the current market consensus price.
* The ATR is calculated over a user-defined period, then multiplied by a volatility factor (ATR multiplier).
* The resulting ATR value defines dynamic upper and lower thresholds around the basis line.
* Trend direction is determined by price closing behavior relative to these thresholds:
* When the closing price exceeds the upper band, the trend is considered bullish.
* When it drops below the lower band, the trend turns bearish.
* If price remains within the bands, the prior trend direction is maintained for consistency.
**Visual Structure**
The SuperTrend Dual RMA provides multiple layers of visual feedback for enhanced interpretation:
* Two distinct RMA lines (short and long) are plotted with complementary colors for contrast and clarity.
* A soft fill between the RMA lines highlights the interaction between short- and medium-term momentum.
* The ATR-based SuperTrend bands are drawn above and below the basis, with adaptive coloring that corresponds to the prevailing trend direction.
* Bar colors automatically adjust to reflect bullish or bearish bias, making it easy to identify trend shifts without relying solely on crossovers.
* Optional triangle markers appear below or above bars to signal potential buy or sell opportunities based on crossover logic.
**Signals and Alerts**
The indicator provides real-time crossover detection:
* **Buy Signal:** Triggered when the closing price moves above the SuperTrend line, confirming potential bullish continuation or reversal.
* **Sell Signal:** Triggered when the closing price drops below the SuperTrend line, indicating possible bearish momentum or reversal.
Both conditions have built-in `alertcondition()` functions, allowing users to set automated alerts for trading or monitoring purposes. This enables integration with TradingView’s alert system for push notifications, emails, or webhook connections.
**Usage Guidelines**
* **Trend Identification:** Use the color-coded trend line and bar color as a visual guide to the current directional bias.
* **Entry and Exit Timing:** Consider entering trades when a new crossover alert appears, preferably in the direction of the overall higher-timeframe trend.
* **Parameter Tuning:** Adjust the RMA lengths and ATR parameters based on asset volatility. Shorter RMA and ATR settings provide faster reactions, suitable for intraday or high-frequency trading, while longer configurations better fit swing or position strategies.
* **Risk Management:** Because the SuperTrend inherently acts as a dynamic stop level, traders can use the opposite band or SuperTrend line as a trailing stop or exit signal.
**Practical Applications**
* Trend confirmation in multi-timeframe strategies.
* Adaptive trailing stop placement using the lower or upper band.
* Visual comparison of volume-weighted price movement against volatility envelopes.
* Integration into algorithmic trading systems as a signal filter or trend bias component.
* Identification of overextended conditions when price significantly diverges from the SuperTrend basis.
**Originality and Advantages**
The SuperTrend Dual RMA differentiates itself from conventional SuperTrend scripts through three innovative design choices:
1. **Dual Volume-Weighted RMAs:** By incorporating two RMAs weighted by trading volume, the indicator accounts for liquidity dynamics, producing smoother and more reliable averages compared to price-only calculations.
2. **Anchored SuperTrend Framework:** The SuperTrend bands are not derived from a fixed source (such as a single close or median price) but from a blended RMA basis, making them more adaptable to varying market behaviors.
3. **Integrated Multi-Layer Visualization:** The inclusion of filled regions between RMAs, dynamic band coloring, and bar tinting enhances readability and analytical depth without overwhelming the chart.
These improvements collectively create a more balanced and data-rich representation of market structure, offering a higher degree of analytical precision. It’s suitable for traders seeking both discretionary and systematic use, as the indicator’s logic is transparent and compatible with alert-based or automated workflows.
**Summary**
The SuperTrend Dual RMA is a refined evolution of the classic SuperTrend, optimized for traders who value smoother directional tracking and more intelligent volatility adaptation. It blends two time-sensitive, volume-aware moving averages with an ATR-derived volatility system to deliver reliable, actionable trend information. Its visual design, adaptive responsiveness, and integrated alert functionality make it a complete solution for identifying and managing trends across multiple asset classes and timeframes.
Cerca negli script per "rma"

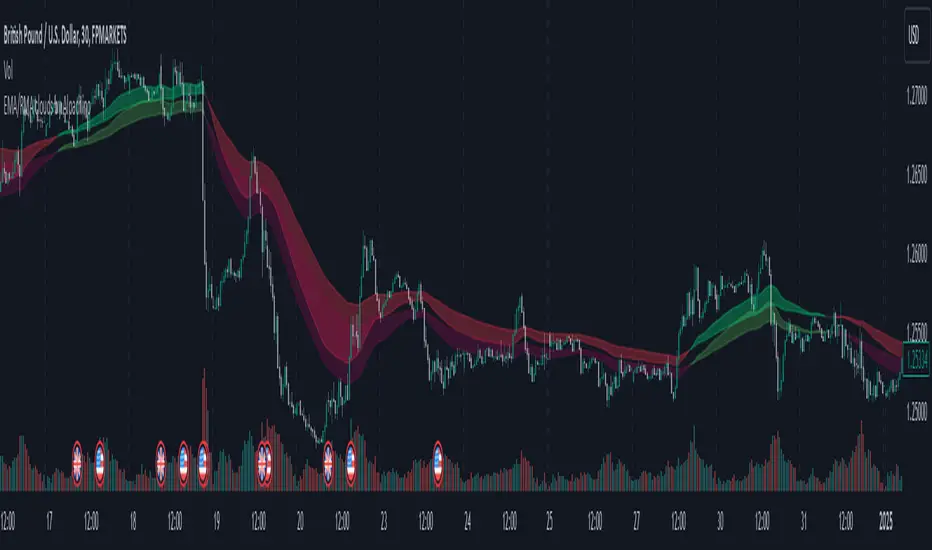
EMA/RMA clouds by AlpachinoRE-UPLOAD
The indicator is designed for faster trend determination and also provides hints about whether the trend is strong, weaker, or if a range is expected.
It consists of an exponential moving average (EMA) and a slower smoothed moving average (RMA). I chose these because EMA is the fastest and is respected by the market, while I discovered through practice that the market often respects RMA, and in some cases, even more than EMA. Their combination is necessary because I want to take advantage of the best qualities of both averages. Displaying averages based solely on the close values creates a simple line that the market might respect. However, this is often not the case. Market makers know that many traders still believe in the theory that closing above/below an EMA signals a valid new trend. They commonly apply this belief to EMA200. Traders think that if the market closes below EMA, it signals a downtrend. That’s not necessarily true. This misconception often traps inexperienced traders.
For this reason, my indicator does not include a separate line.
I use what are called envelopes. In other words, for both EMA and RMA, the calculation uses the high and low of the selected period, which can be chosen as an input in the indicator.
Why did I choose high and low?
To stabilize price fluctuations as much as possible, especially to allow enough space for the price to react to the moving average. This reaction occurs precisely between the high and low.
Modes:
EMA Cloud – This is the most common envelope in terms of averages. It shows the best reactions with a period of 50.
What should you observe: the alignment of the envelope or its slope.
Usage:
Breakouts through the entire envelope tend to be strong, which signals that the trend may change. However, what interests you most is that the first test of the envelope after a breakout is the most successful entry point for trades in the breakout direction.
In an uptrend, the first support will be the high of the envelope, and the second (let’s call it the "ultimate support") will be the low of the envelope.
If, during an uptrend, the market closes below the low, be cautious, as the trend may reverse.
If the envelope is broken, trade the retest of the envelope.
In general, if the price is above the envelope, focus on long trades; if it’s below the envelope, focus on short trades.
Double Cloud – Since we already know that highs and lows are more relevant for price respect, I utilized this in the double cloud. Here, I use calculations for EMA and RMA highs and EMA and RMA lows.
The core idea is that since the price often reacts more to RMA than EMA, I wanted to eliminate attempts by market makers to lure you into incorrect directions. By creating more space for the price to react to the highs or lows, I made the cloud fill the area between EMA and RMA highs. This serves as the last zone where the price can hold. If the price breaks above this high cloud during a return, this doesn’t happen randomly—you should pay attention, as it’s likely signaling a range or a trend change.
The same applies to the low cloud for EMA and RMA.
The advantage of the double cloud is that you can see two clouds that may move sideways. This can resemble two walls—and they really act as such.
Usage:
Let’s say we have a downtrend. The market seems to be experiencing a downtrend exhaustion. Here's the behavior you might observe:
The price returns to the EMA/RMA low; the first reaction may still have some strength, but each subsequent return will move higher and higher into the cloud with increasingly smaller rejections downward. This indicates the absorption of selling pressure by bullish pressure. Eventually, the price may close above the cloud, significantly disrupting the downtrend and potentially signaling a reversal.
A confirmation of the reversal is usually seen with a retest of the cloud and a bounce upward into an uptrend.
The second scenario, which you’ll often see, involves sharp and significant moves through both envelopes. This kind of move is the strongest signal of a trend change. However, do not jump into trades immediately—wait for the first retest, which is usually successful. Additional tests may not work, as the breakout might not signify a trend change but rather a range.
When the clouds are far apart, it signals a weak trend or that the market is in a range. You will see that this is generally true. When the clouds cross or overlap, their initial point of contact signals the start of a stronger trend. The steeper the slope, the stronger the trend.
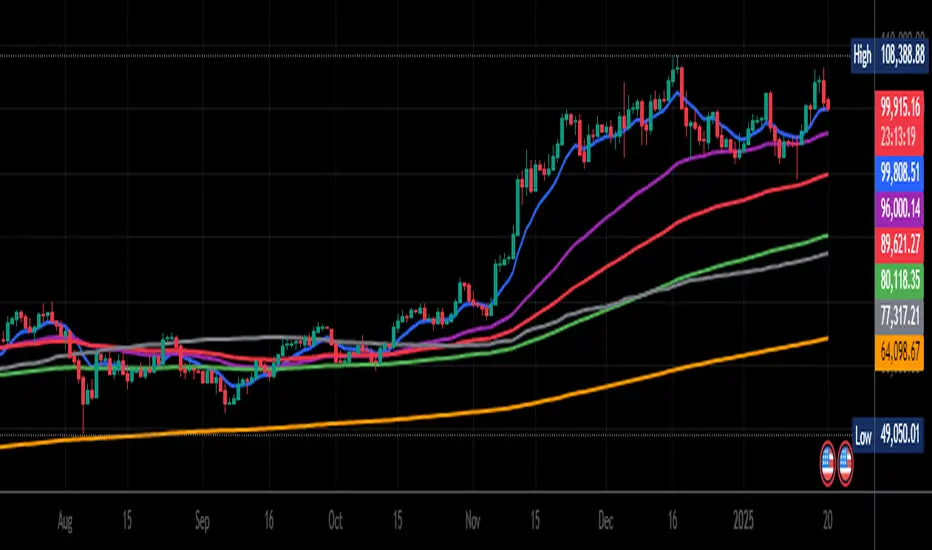
BK Multiple MA, RMA, SMA, HMA, VWAP, Rolling VWAP **Indicator Description**
I’m incredibly proud to introduce my third indicator to the TradingView community: **BK Multiple MA with HMA, VWAP, and Rolling VWAP**! This tool has been a game-changer in my trading strategy, and I’m excited to share it with others who are navigating the markets.
This indicator holds a special place in my heart because it represents the first technical analysis concept introduced to me by my mentor when I began apprenticing under him. His wisdom, guidance, and passion for trading—and for life—left an indelible mark on my journey. I dedicate this work, and every indicator I introduce, to the foundation he helped me build, while giving glory first and foremost to God.
**Moving Averages (MAs)** are one of the most widely used tools in technical analysis, and this indicator takes them to the next level. It allows you to plot **six fully customizable moving averages simultaneously**, with options including:
- **Exponential Moving Average (EMA)**
- **Simple Moving Average (SMA)**
- **Relative Moving Average (RMA)**
- **Hull Moving Average (HMA)**
- **Volume Weighted Average Price (VWAP)**
- **Rolling VWAP**
This flexibility makes the indicator highly versatile, whether you’re a day trader, swing trader, or long-term investor. By customizing periods, colors, and line widths for each MA, you can tailor the indicator to perfectly suit your trading style.
**Key Features**
1. **Six Fully Customizable MAs**:
- Adjust periods, line colors, and widths to match your preferences.
- Select from EMA, SMA, RMA, HMA, VWAP, or Rolling VWAP for each line.
2. **Unique Rolling VWAP Option**:
- Rolling VWAP calculates the volume-weighted average price over a user-defined period, such as 200 candles.
- This feature is ideal for traders seeking volume-weighted levels that don’t reset with each session, making it invaluable for trend-following and swing trading.
3. **HMA for Smoother Trends**:
- The Hull Moving Average (HMA) is designed to reduce lag and provide a responsive, noise-free view of price trends.
- It’s a powerful tool for spotting reversals and confirming directional momentum.
4. **Session VWAP**:
- Traditional VWAP resets with each trading session, making it a reliable benchmark for intraday support and resistance levels.
**How It Works**
- **VWAP**: Reflects the average price weighted by volume for the current trading session, commonly used by institutional traders to identify key price levels.
- **Rolling VWAP**: Extends VWAP functionality by calculating over a user-defined period, allowing for flexible multi-timeframe analysis.
- **HMA**: A fast, smooth moving average that reacts quickly to price changes while filtering out noise.
The combination of these options provides traders with a comprehensive view of market dynamics, enabling better decision-making.
**Final Thoughts**
This indicator is deeply meaningful to me because it represents the first concept my mentor introduced when I began apprenticing under him. His wisdom, guidance, and passion for trading—and for life—left an indelible mark on my journey. I dedicate this work, and every indicator I introduce, to the foundation he helped me build, while giving glory first and foremost to God.
If this indicator helps you succeed, I humbly ask that you honor the blessings in your life by giving back—whether through acts of kindness, philanthropy, or helping others in need.
May the Almighty guide us all toward wisdom and success in our endeavors. All glory belongs to God!
Mehrdad Banakar - Multiple RMA channelsThis indicator demonstrates 6 different steps RMA moving channels. The channels upper and lower lines show the computing RMA of candles high and candles low, respectively. You can fine the best inputs based on your strategies in different stocks and improve your win rate. Please note that, it is better to use it in higher time frames.

Multi Timeframe Moving Average (ema, sma, rma, wma and hma)I use multi timeframe moving averages so that the entries on my trades are in line with the trends of all timeframes. With this script I can plot moving averages for three timeframes in one screen.
Moving averages that have been available include ema, sma, rma, wma and hma.

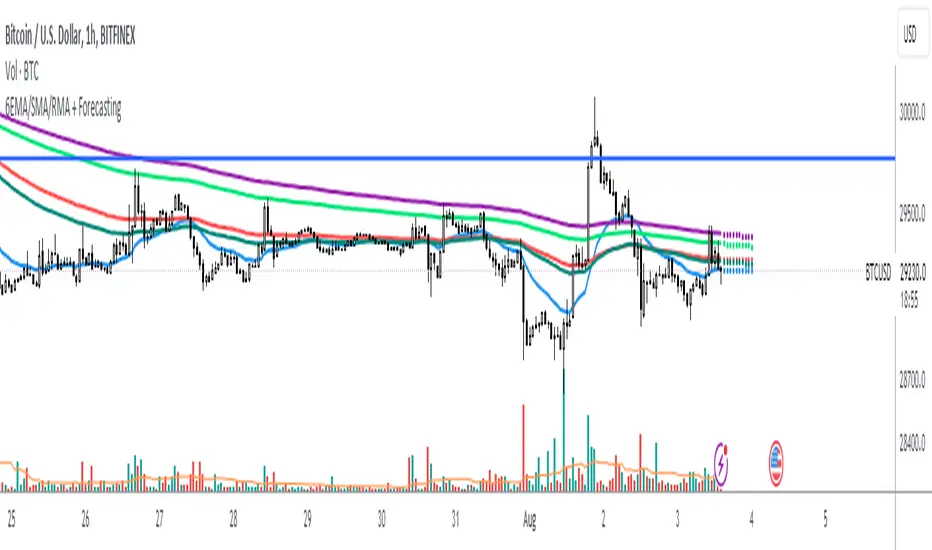
6 EMA SMA RMA + ForecastingDescription:
Hey hi, this Script is a bit simple. Let's start with some definitions.
Moving Average (MA)
In statistics, a moving average is a calculation used to analyze data points by creating a series of averages of different subsets of the full data set. In finance, a moving average (MA) is a stock indicator that is commonly used in technical analysis . The reason for calculating the moving average of a stock is to help smooth out the price data by creating a constantly updated average price . This makes this tool one of the most important for technical analysis .
Forecasting
Forecasting is the process of making predictions based on past and present data and most commonly by analysis of trends . In the same way that the moving average (MA) the forecasting is something highly desirable, in this way we opted to develop an indicator that allows the use of up to 6 moving averages combined with the forecasting.
In addition to having the option of up to 6 moving averages, these can be of different types, being able to choose between up to 3 options (it is proposed to add more options later) which are listed below.
Exponential Moving Average ( EMA )
Simple Moving Average ( SMA )
Running Moving Average (RMA)
In addition to the above, 2 prediction methods were added, which are listed and detailed below.
Repetition. Makes forecast repeating the last candle M times.
Linear Regression ( LR ). Linear Regression does N period LR forecast averaged with length-N Moving Average
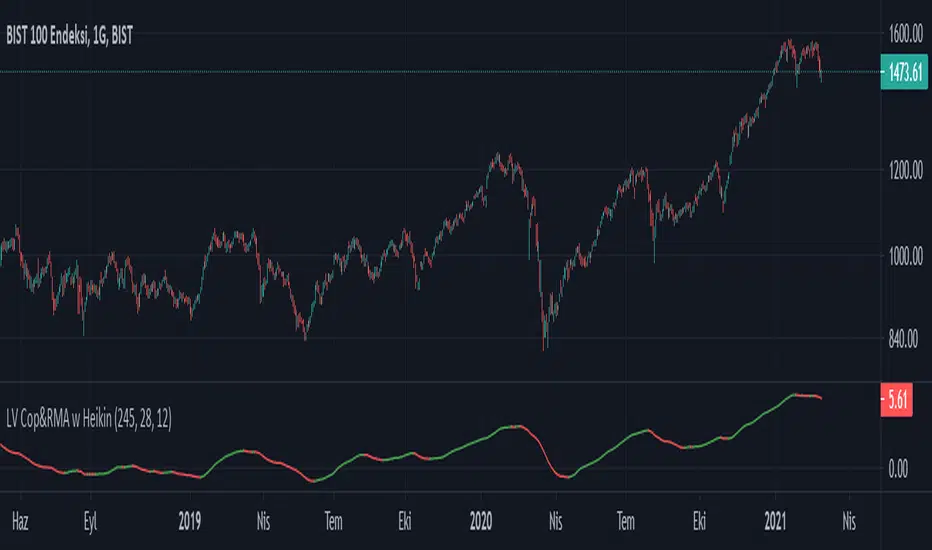
LV Cop&RMA w HeikinA buy signal is generated when the indicator turns upwards from previous indicator level.
A sell signal is generated when the indicator turns downwards from previous indicator level.
The indicator is trend-following, and based on averages, so by its nature it doesn't pick a bottom, but rather shows when a rally has started.
It is designed for daily period use.
Frequent buy/sell signals can occur on low and high levels.
It is designed with the mentality of Coppock curve. Rma is used instead of Wma and Heikin-Ashi closing price is used instead of standard closing price.
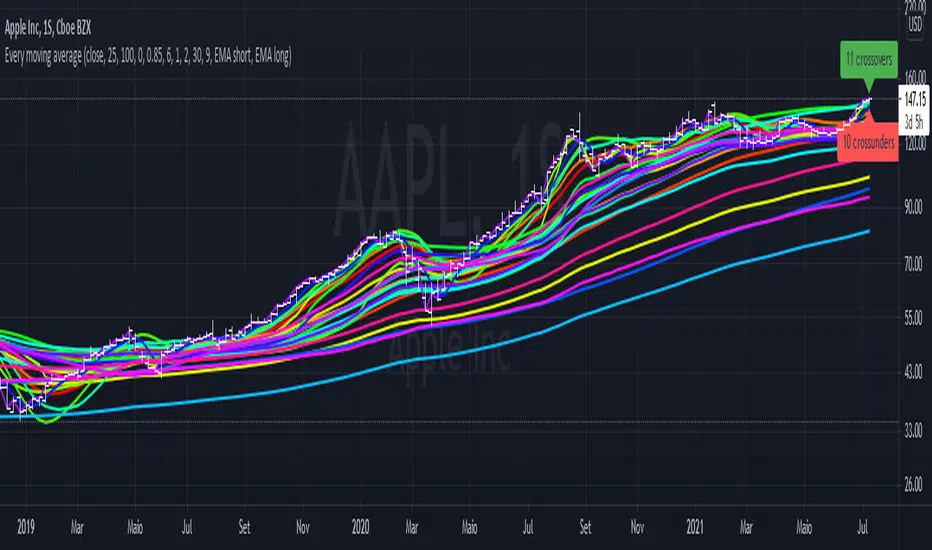
Every single moving average (ALMA, EMA, HMA, KAMA, RMA, SMA...)So you may be looking at the graph and thinking "this is a mess", and I agree.
The purpose of this script is to plot in the same graph every single type of moving average that I could think of, so you can find the ones that are better for your timeframe and for your asset. Once you add it, disable those types that doesn't seem to serve your purpose, until you can select one you like.
The average types are: ALMA, EMA, HMA, KAMA, RMA, SMA, SWMA, VIDYA, VWAP, VWMA, and WMA. Each one is ploted two times (except SWMA and VWAP), one with a short period, and another with a long, both of which you can configure.
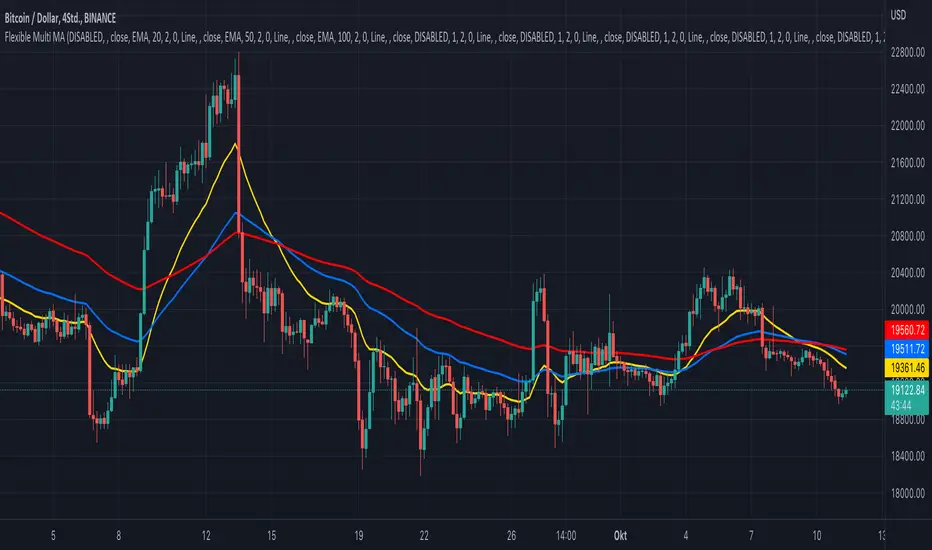
KINSKI Flexible Multi MA (EMA, SMA, RMA, WMA, VWMA, KAMA, HMA)This Multi Moving Average (MA) indicator is more flexible than any other indicator of this type offered so far. You can define up to 10 different Moving Average (MA) lines based on different calculation variants.
The following MA types can be configured.
- EMA: Exponentially Moving Average
- SMA: Small Moving Average
- RMA: Rolling Moving Average
- WMA: Weighted Moving Average
- VWMA: Volume Weighted Moving Average
- KAMA: Kaufman's Adaptive Moving Average
- HMA: Hull Moving Average
Which settings can be made?
- Selection for calculation formula ("Calculation Source"). The default value is "close".
- for each MA line the "Length" and the "Type" can be defined
- furthermore you can make layout adjustments via the "Style" menu
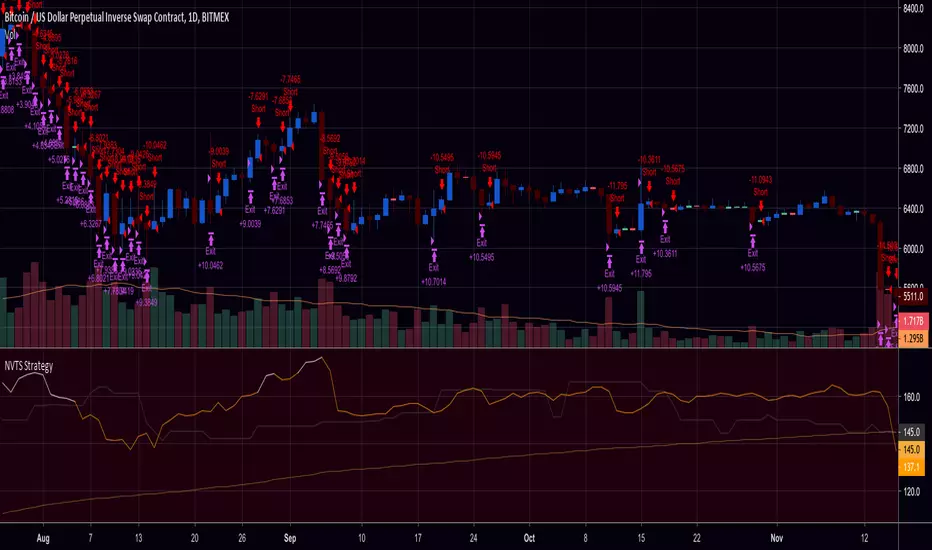
NVT Signal with RMA and Thresholds (Strategy / Backtest)This is the strategy w/ backtester and trailing-stop / stop-loss for kishin's NVT alerts
Tillson Moving Average(rma) singleT3 Moving Average indicator was originally developed by Tim Tillson in 1998/99.
T3 Moving Average is considered as improved and better to traditional moving averages as it is smoother and performs better in trending market conditions.
It offers multiple opportunities when the price is in the state of retracement and therefore allows to minimize your exposed risk and allowing your profits run.
This version provides simple T3 MA
Source options - all standard + HA
T3 based on 6x rma
Only adds 1 T3 MA on chart
Consider a tip in ETH to
0xac290B4A721f5ef75b0971F1102e01E1942A4578
Thank you and have a nice day
CryptoJoncis


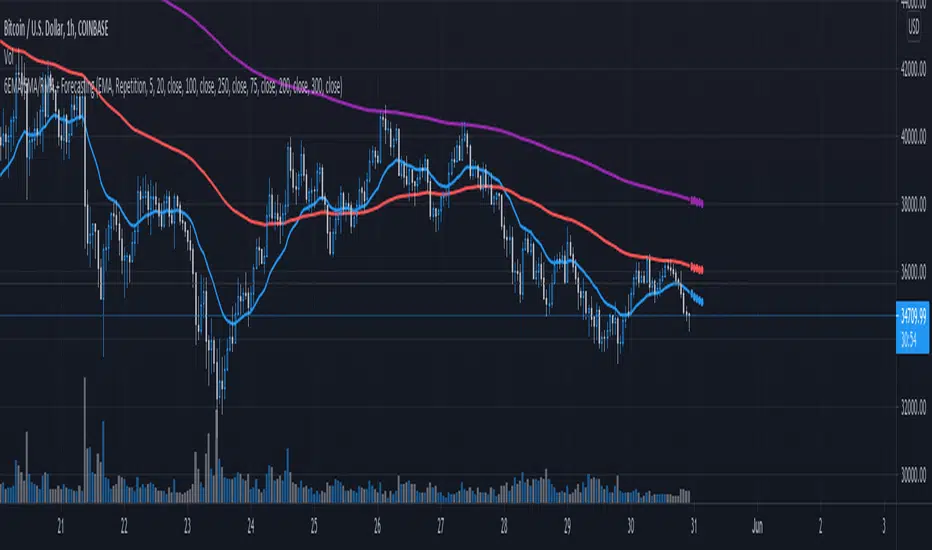
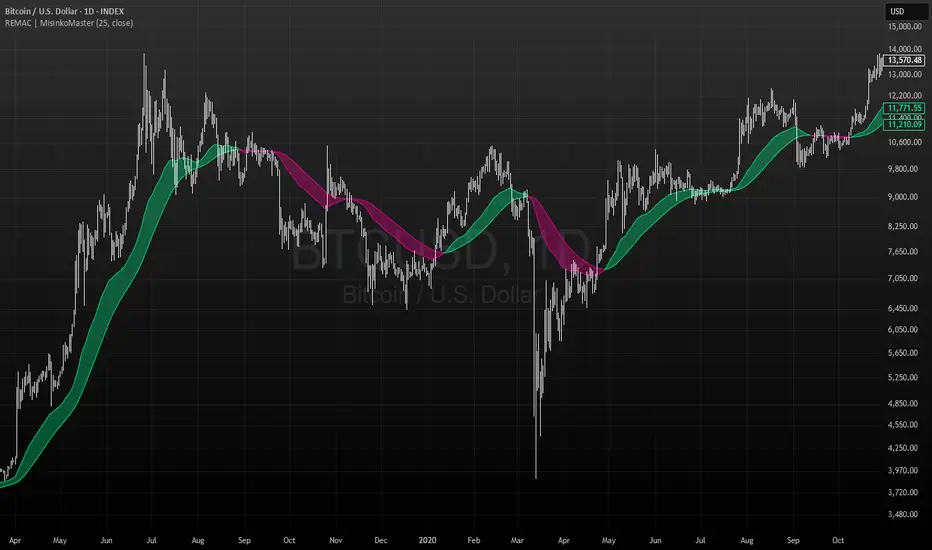
RMA EMA Crossover | MisinkoMasterThe RMA EMA Crossover (REMAC) is a trend-following overlay indicator designed to detect shifts in market momentum using the interaction between a smoothed RMA (Relative Moving Average) and its EMA (Exponential Moving Average) counterpart.
This combination provides fast, adaptive signals while reducing noise, making it suitable for a wide range of markets and timeframes.
🔎 Methodology
RMA Calculation
The Relative Moving Average (RMA) is calculated over the user-defined length.
RMA is a type of smoothed moving average that reacts more gradually than a standard EMA, providing a stable baseline.
EMA of RMA
An Exponential Moving Average (EMA) is then applied to the RMA, creating a dual-layer moving average system.
This combination amplifies trend signals while reducing false crossovers.
Trend Detection (Crossover Logic)
Bullish Signal (Trend Up) → When RMA crosses above EMA.
Bearish Signal (Trend Down) → When EMA crosses above RMA.
This simple crossover system identifies the direction of momentum shifts efficiently.
📈 Visualization
RMA and EMA are plotted directly on the chart.
Colors adapt dynamically to the current trend:
Cyan / Green hues → RMA above EMA (bullish momentum).
Magenta / Red hues → EMA above RMA (bearish momentum).
Filled areas between the two lines highlight zones of trend alignment or divergence, making it easier to spot reversals at a glance.
⚡ Features
Adjustable length parameter for RMA and EMA.
Overlay format allows for direct integration with price charts.
Visual trend scoring via color and fill for rapid assessment.
Works well across all asset classes: crypto, forex, stocks, indices.
✅ Use Cases
Trend Following → Stay on the right side of the market by following momentum shifts.
Reversal Detection → Crossovers highlight early trend changes.
Filter for Trading Systems → Use as a confirmation overlay for other indicators or strategies.
Visual Market Insight → Filled zones provide immediate context for trend strength.
RMA Smoothed RSIRMA Smoothed RSI
Description:
An enhanced RSI built for cleaner intraday and swing reads. It applies RMA smoothing to damp noise.
How It Works
RSI (RMA-Smoothed):
Computes classic RSI from price changes and smooths the result with an additional RMA (user-controlled 3–7, where 5 is the sweet spot). This reduces whipsaw while preserving shifts in momentum.
How to Interpret
50 Midline = Bias Filter: Above 50 favors strength; below 50 favors weakness.
RSI vs RSI-MA Crosses: Cross up can precede thrust or mean-revert toward 50; cross down the opposite.
Inputs
Length: RSI period (default 14).
Source: Price source for RSI (default Close).
Smoothing: RMA smoothing length on RSI (3–7; default 3; 5 sweet spot).
Calculate Divergence: Toggle to compute pivots/divergences and enable alerts.
Moving Average Type: None, SMA, EMA, WMA, VWMA (default EMA).
MA Length: Length of the RSI-based MA (separate from RSI length).
Best For
Traders who want a cleaner RSI read without losing responsiveness.
Scalpers timing momentum shifts around the 50 line and MA crosses.
Swing traders using divergences as early reversal context.
Pro Tips
For fast intraday charts, start with Length 14, Smoothing 3–5, and EMA as the RSI-MA.
Use 50 reclaims/rejections as a simple regime filter.
Combine divergence labels with volume surges, key S/R, or volatility tools (e.g., BBW/TTM squeeze) to time entries.
Divergence alerts fire only if Calculate Divergence is enabled—keep it on if you rely on signals.

RMA vs EMA Comparison ToolIf you're looking for a quick entry point to follow a trend, it's best to look at the EMA.
If you need confirmation of a long-term trend change or are working with oscillators (like the RSI), use the RMA.
What to look for on the chart:
Reaction speed: You'll notice that the EMA (red line) adheres much more closely to the price. It reacts more quickly to sharp reversals or impulses.
Smoothness: The RMA (blue line) appears smoother and "lazier." It changes direction more slowly, which helps filter out false signals (noise), but allows for a slightly later entry into a trade.
Distance: During periods of strong trending, the RMA is usually further from the price than the EMA of the same period.


CapnsSurferThis is a simple RMA Trend that may help you decide for SL or TP. Similar to CapnsBands this uses Donchian Channels.. but remember. Your Trade Your Money
Howto Read Capns Surfer - I will write more later
First of all this is NOT a BUY or SELL indicator. However with this you can define sweet spots for ENTRIES, or TRAILING STOPS and recognize the trend.
Sweetspots

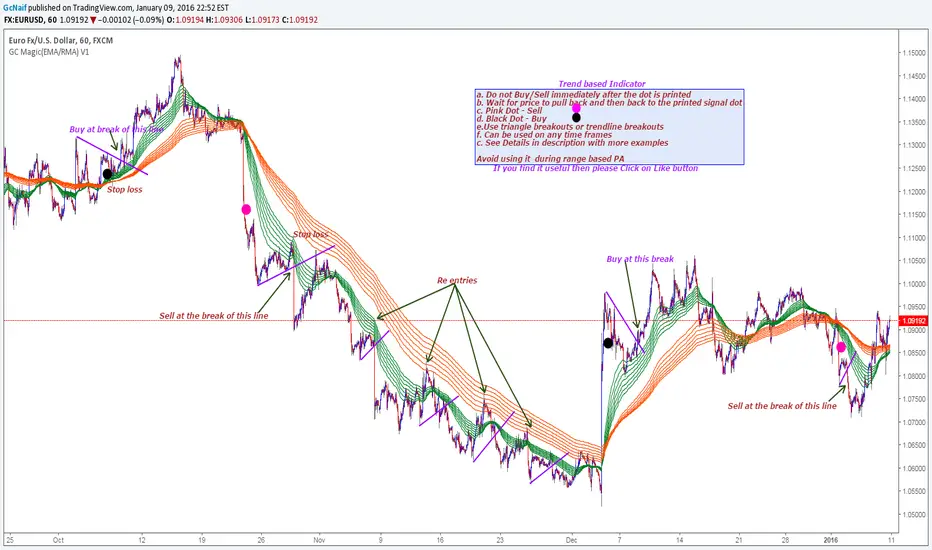
GC Magic(EMA/RMA) V1This is the second script I am posting on TV . This is a Trend based indicator with the option of using it as Exponential Moving Averages or Rsi Moving Averages.The RMA's are giving better signal than the Exponential Moving Averages. The script has the option to select either of them. Works on all time frames. The default options are working good on all time frames.
With the help of Indicator Properties following Options can be changed
a. Type of moving averages for using Guppy method
b. Option to use higher time frame Signal moving average of your choice along with higher time frame
c. Enable or disable to show signal EMA/RMA on chart .
d. Enable or disable to show Guppy EMA/RMA on chart
Indicator Properties:
1. Select to use EMA , Uncheck to use RMA: --> Check to Select EMA based Guppy or Uncheck to use RMA based Guppy
2. Fast EMA/RMA For Cross --> Fast EMA/RMA cross Length
3. Slow EMA/RMA For Cross --> Slow EMA/RMA Length
4. Signal EMA/RMA --> Moving average to use for Signal filters. This moving average will be based on the timeframe u will be selecting below
5. Time interval for Signal EMA/RMA (W, D, ) --> Which time frame moving average you want for the above Signal EMA
6. Do you want to use Signal EMA/RMA for Signals? --> Do you want to use Signal EMA as filter or just the cross of Guppy . Check to use and uncheck for just cross
7. Show Signal EMA on Chart? --> Do you want to display higher timeframe Signal EMA on chart
8. Show Guppy-Slow-Red On Chart? --> Shows/Hides Slow EMA/RMAs
9. Show Guppy-Fast-Green On Chart? --> Shows/Hides Fast EMA/RMAs
Examples:
GbpAud 15m
GbpNzd 1hr
Oil 4hr
AudUSD 1hr
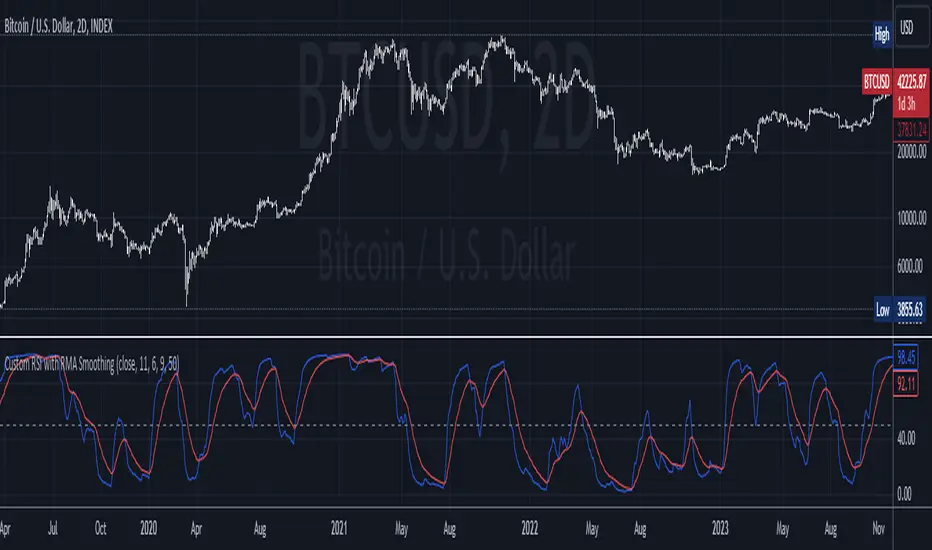
Custom RSI with RMA SmoothingCustom RSI with RMA Smoothing is smoothing the classic Relative Strength Index to enhance the effectiveness of using the RSI for trend-following through noise reduction.
Principle:
1. RSI is smoothed by the Rolling Moving Average (RMA) and averaged Gains & Losses instead of the classic RSI calculation.
2. A RMA is plotted over the RSI where the crossovers can be entry and exit points.
How is RSI smoothed by the RMA:
1. Outside the common price sources a few new options like hhhlc or hlcc can be chosen where the emphasis is more on the high or the close of the chosen period.
2. Calculation of Price Change: After selecting the price source, the indicator calculates the price change by subtracting the previous period's price from the current price.
3. RMA Smoothing of Price Change: The key step in smoothing the RSI is the application of the Running Moving Average (RMA) to the price change. The length of this RMA is set by the user and determines the extent of smoothing. RMA is a type of moving average that gives more weight to recent data points, making it more responsive to new information while still smoothing out short-term fluctuations.
4. Determining Gains and Losses: The smoothed price change is then used to calculate the gains and losses for each period. Gains are considered when the smoothed price change is positive, and losses when it is negative.
5. Averaging Gains and Losses: These gains and losses are further smoothed by calculating their respective RMAs over the user-defined RSI length. This step is crucial as it dampens the impact of short-term price spikes and drops, giving a more stable and reliable measure of price momentum.
6. RSI Calculation: The standard RSI formula (100 - ) is then applied to these smoothed values. This results in the initial RSI value, which is already more stable than a typical RSI due to the previous smoothing steps.
7. Final RMA Smoothing of RSI: In a final layer of refinement, the RSI itself is smoothed using another RMA, over a length specified by the user. This additional smoothing further reduces the impact of short-term volatility and sharp price movements, providing a more coherent and interpretable RSI line.
DEGA RMA | QuantEdgeB🧠 Introducing DEGA RMA (DGR ) by QuantEdgeB
🛠️ Overview
DEGA RMA (DGR) is a precision-engineered trend-following system that merges DEMA, Gaussian kernel smoothing, and ATR-based envelopes into a single, seamless overlay indicator. Its mission: to filter out market noise while accurately capturing directional bias using a layered volatility-sensitive trend core.
DGR excels at identifying valid breakouts, sustained momentum conditions, and trend-defining price behavior without falling into the trap of frequent signal reversals.
🔍 How It Works
1️⃣ Double Exponential Moving Average (DEMA)
The system begins by applying a DEMA to the selected price source. DEMA responds faster than a traditional EMA, making it ideal for capturing transitions in momentum.
2️⃣ Gaussian Filtering
A custom Gaussian kernel is used to smooth the DEMA signal. The Gaussian function applies symmetrical weights, centered around the most recent bar, effectively softening sharp price oscillations while preserving the underlying trend structure.
3️⃣ Recursive Moving Average (RMA) Core
The filtered Gaussian output is then processed through an RMA to generate a stable dynamic baseline. This baseline becomes the foundation for the final trend logic.
4️⃣ ATR-Scaled Breakout Zones
Upper and lower trend envelopes are calculated using a custom ATR filter built on DEMA-smoothed volatility.
• ✅ Long Signal when price closes above the upper envelope
• ❌ Short Signal when price closes below the lower envelope
• ➖ Neutral when inside the band (no signal noise)
✨ Key Features
🔹 Multi-Layer Trend Model
DEMA → Gaussian → RMA creates a signal structure that is both responsive and robust.
🔹 Volatility-Aware Entry System
Adaptive ATR bands adjust in real-time, expanding during high volatility and contracting during calm periods.
🔹 Noise-Reducing Gaussian Kernel
Sigma-adjustable kernel ensures signal smoothness without introducing excessive lag.
🔹 Clean Visual System
Candle coloring and band fills make trend state easy to read and act on at a glance.
⚙️ Custom Settings
• DEMA Source – Input source for trend core (default: close)
• DEMA Length – Length for initial smoothing (default: 30)
• Gaussian Filter Length – Determines smoothing depth (default: 4)
• Gaussian Sigma – Sharpness of Gaussian curve (default: 2.0)
• RMA Length – Core baseline smoothing (default: 12)
• ATR Length – Volatility detection period (default: 40)
• ATR Mult Up/Down – Controls the upper/lower threshold range for signals (default: 1.7)
📌 How to Use
1️⃣ Trend-Following Mode
• Go Long when price closes above the upper ATR band
• Go Short when price closes below the lower ATR band
• Remain neutral otherwise
2️⃣ Breakout Confirmation Tool
DGR’s ATR-based zone logic helps validate price breakouts and filter out false signals that occur inside compressed ranges.
3️⃣ Volatility Monitoring
Watch the ATR envelope width — a narrowing band often precedes expansion and potential directional shifts.
📌 Conclusion
DEGA RMA (DGR) is a thoughtfully constructed trend-following framework that goes beyond basic moving averages. Its Gaussian smoothing, adaptive ATR thresholds, and layered filtering logic provide a versatile solution for traders looking for cleaner signals, less noise, and real-time trend awareness.
Whether you're trading crypto, forex, or equities — DGR adapts to volatility while keeping your chart clean and actionable.
🔹 Summary
• ✅ Advanced Smoothing → DEMA + Gaussian + RMA = ultra-smooth trend core
• ✅ Volatility-Adjusted Zones → ATR envelope scaling removes whipsaws
• ✅ Fully Customizable → Tailor to any asset or timeframe
• ✅ Quant-Inspired Structure → Built for clarity, consistency, and confidence
📌 Disclaimer: Past performance is not indicative of future results. No trading strategy can guarantee success in financial markets.
📌 Strategic Advice: Always backtest, optimize, and align parameters with your trading objectives and risk tolerance before live trading.

Mean Reversion & Momentum Hybrid | D_QUANT 📌 Mean Reversion & Momentum Hybrid | D_QUANT
📖 Description:
This indicator combines mean reversion logic, volatility filtering, and percentile-based momentum to deliver clear, context-aware buy/sell signals designed for trend-following and contrarian setups.
At its core, it merges:
A Bollinger Band % Positioning Model (BB%)
A 75th/25th Percentile Momentum System
A Volatility-Adjusted Trend Filter using RMA + ATR
All tied together with a dynamic gradient-style oscillator that visualizes signal strength and persistence over time — making it easy to track high-conviction setups.
Signals only trigger when all three core components align, filtering out noise and emphasizing high-probability turning points or trend continuations.
⚙️ Methodology Overview:
Bollinger Bands % (BB%):
Price is measured as a percentage between upper and lower Bollinger Bands (based on OHLC4). Entries are only considered when price exceeds custom BB% thresholds — emphasizing market extremes.
Volatility-Based Trend Filter (RMA + ATR):
A smoothed RMA baseline is paired with ATR to define trend bias. This ensures signals only occur when price deviates meaningfully beyond recent volatility.
Percentile Momentum Model (75th/25th Rank):
Price is compared against its rolling 75th and 25th percentile. If price breaks these statistical boundaries (adjusted by ATR), it triggers a directional momentum condition.
Signal Consensus Engine:
All three layers must agree — BB% condition, trend filter, and percentile momentum — before a buy or sell signal is plotted.
Gradient Oscillator Visualization:
Signals appear as a fading oscillator line with a gradient-filled area beneath it. The color intensity represents how “fresh” or “strong” the signal is, fading over time if not reconfirmed, offering both clarity and signal aging at a glance.
🔧 User Inputs:
🧠 Core Settings:
Source: Select the price input (default: close)
Bollinger Bands Length: Period for BB basis and deviation
Bollinger Bands Multiplier: Width of the bands
Minimum BB Width (% of Price): Prevents signals during low-volatility chop
📊 BB% Thresholds:
BB% Long Threshold (L): Minimum %B to consider a long
BB% Short Threshold (S): Maximum %B to consider a short
🔍 Trend Filter Parameters:
RMA Length: Period for the smoothed trend baseline
ATR Length: Lookback for ATR in trend deviation filter
⚡️ Momentum Parameters:
Momentum Length: Period for percentile momentum calculation
Mult_75 / Mult_25: ATR-adjusted thresholds for breakout above/below percentile levels
🎨 Visualization:
Bar Coloring: Highlights candles during active signals
Background Coloring: Optional background shading for signals
Show Oscillator Plot: Toggle the gradient-style oscillator
🧪 Use Case:
This indicator works well across all assets for trend identification. It is particularly effective when used on higher timeframes (e.g. 12H, 1D,2D) to capture mean reversion bounces or confirm breakouts backed by percentile momentum and volatility expansion.
⚠️ Notes:
This is not financial advice. Use in combination with proper risk management and confluence from other tools.

6 EMA/SMA/RMA + Forecasting 10 candles 6EMA/SMA/RMA + Forecasting 10 candles
The script allows the user to choose between different types of moving averages (SMA, EMA, RMA) using the soft_func_choice input.
The user can also choose between two types of forecasting: "Repetition" or "Linear Regression" using the type_of_forecast input.
For the linear regression forecast, the user can specify the number of candles to use in the linear regression calculation using the Linreglen input.
First Moving Average (MA) Calculation:
The script calculates the first MA based on the selected type (SMA, EMA, RMA) and plots it on the chart.
The user can customize the length and source of data for this MA.
If the selected forecast type is "Repetition," the script also calculates additional offset values for different repetitions of the MA.
Forecasting and Offset Calculation:
Depending on the chosen forecast type, the script calculates additional offset values for the MA. These offsets are used to forecast the future values of the MA.
The script calculates offsets for up to five repetitions (offset1, offset2, ..., offset5) for each MA.
If the forecast type is "Linear Regression," the script combines the MA's historical values with linear regression predictions to generate the forecasted values.
Plotting Additional Moving Averages:
The script allows the user to plot up to four additional MAs (Second MA, Third MA, Fourth MA, Fifth MA) with similar customizable settings for length and source of data.
Forecast Repetition:
If the forecast type is "Repetition," the script iterates through historical data and accumulates offset values, effectively simulating a repeated forecasting approach.
This repetition is controlled by a loop that adjusts the offset values based on historical price data.
Overall, this script provides a versatile tool for analyzing and forecasting multiple moving averages using various methods, allowing traders and analysts to experiment with different MA types and forecast strategies on their chosen price series.