Risk Management: Position Size & Risk RewardHere is a Risk Management Indicator that calculates stop loss and position sizing based on the volatility of the stock. Most traders use a basic 1 or 2% Risk Rule, where they will not risk more than 1 or 2% of their capital on any one trade. I went further and applied four levels of risk: 0.25%, 0.50%, 1% and 2%. How you apply these different levels of risk is what makes this indicator extremely useful. Here are some common ways to apply this script:
• If the stock is extremely volatile and has a better than 50% chance of hitting the stop loss, then risk only 0.25% of your capital on that trade.
• If a stock has low volatility and has less than 20% change of hitting the stop loss, then risk 2% of your capital on that trade.
• Risking anywhere between 0.25% and 2% is purely based on your intuition and assessment of the market.
• If you are on a losing streak and you want to cut back on your position sizing, then lowering the Risk % can help you weather the storm.
• If you are on a winning streak and your entries are experiencing a higher level of success, then gradually increase the Risk % to reap bigger profits.
• If you want to trade outside the noise of the market or take on more noise/risk, you can adjust the ATR Factor.
• … and whatever else you can imagine using it to benefit your trading.
The position size is calculated using the Capital and Risk % fields, which is the percentage of your total trading capital (a.k.a net liquidity or Capital at Risk). If you instead want to calculate the position size based on a specific amount of money, then enter the amount in the Custom Risk Amt input box. Any amount greater than 0 in the Custom Risk Amt field will override the values in the Capital and Risk % fields.
The stop loss is calculated by using the ATR. The default setting is the 14 RMA, but you can change the length and smoothing of the true range moving average to your liking. Selecting a different length and smoothing affects the stop loss and position size, so choose these values very carefully.
The ATR Factor is a multiplier of the ATR. The ATR Factor can be used to adjust the stop loss and move it outside of the market noise. For the more volatile stock, increase the factor to lower the stop loss and reduce the chance of getting stopped out. For stocks with less volatility , you can lower the factor to raise the stop loss and increase position size. Adjusting the ATR Factor can also be useful when you want the stop loss to be at or below key levels of support.
The Market Session is the hours the market is open. The Market Session only affects the Opening Range Breakout (ORB) option, so it’s important to change these values if you’re trading the ORB and you’re outside of Eastern Standard Time or you’re trading in a foreign exchange.
The ORB is a bonus to the script. When enabled, the indicator will only appear in the first green candle of the day (09:30:00 or 09:30 AM EST or the start time specified in Market Session). When using the ORB, the stop loss is based on the spread of the first candle at the Open. The spread is the difference between the High and Low of the green candle. On 1-day or higher timeframes, the indicator will be the spread of the last (or current) candle.
The output of the indicator is a label overlaying the chart:
1. ATR (14 RMA x2) – This indicated that the stop loss is determined by the ATR. The x2 is the ATR Factor. If ORB is selected, then the first line will show SPREAD, instead of ATR.
2. Capital – This is your total capital or capital at risk.
3. Risk X% of Capital – The amount you’re risking on a % of the Capital. If a Custom Risk Amt is entered, then Risk Amount will be shown in place of Capital and Risk % of Capital.
4. Entry – The current price.
5. Stop Loss – The stop loss price.
6. -1R – The stop loss price and the amount that will be lost of the stop loss is hit.
7. – These are the target prices, or levels where you will want to take profit.
This script is primarily meant for people who are new to active trading and who are looking for a sound risk management strategy based on market volatility . This script can also be used by the more experienced trader who is using a similar system, but also wants to see it applied as an indicator on TradingView. I’m looking forward to maintaining this script and making it better in future revisions. If you want to include or change anything you believe will be a good change or feature, then please contact me in TradingView.
Cerca negli script per "rma"

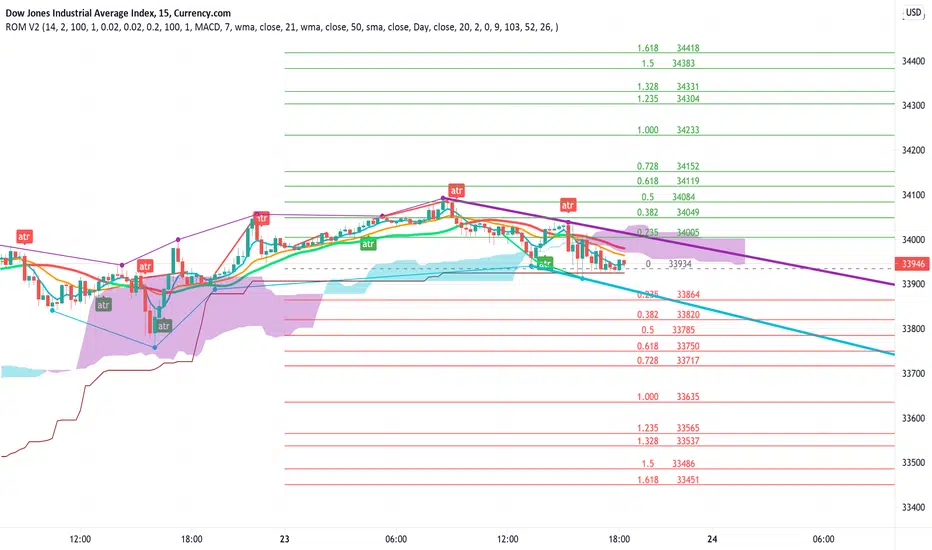
Rain On Me V2As promised, here is Rain On Me Indicator V2! As the name suggests, this indicator will rain money down on you. More seriously, Rain On Me V2 is a complete overhaul of the V1.
For those who are new to this indicator or for those who already knew it, here is a complete description of this indicator.
This indicator contains:
-Fully configurable multi-timeframe buy or sell signals based on ATR with the possibility to set the period, deviation, period of the ATR and choose the source or type of signals: RMA, SMA , EMA, WMA, VWMA, SMMA, KMA, TMA, HullMA, DEMA, TEMA, CTI.
-Colouring of candles on ATR. (green and red).
-Buy or sell signals with VPT (based on st_dev) with the possibility of adjusting the period and the multiplier. (Only works in markets with available volume information flows).
-Trend Parabolic SAR (Up / Down) fully configurable.
-Divergences with the possibility of choosing among the following signals: MACD, OBV, RSI, CCI.
-3 Moving averages with the possibility of choosing their values and their type for each one: SMA, EMA, RMA, WMA, VWMA. (default: WMA 1 = 7, WMA 2 = 21 and SMA 3 = 50).
-Fibonacci on 10 levels with level 0 in the middle. This Fibonacci helps a lot as it can make it easy for you to find an entry / exit point, a trend and even where to place your Take Profit and Stop Loss.
-Fully customizable Bollinger Band.
-Fully customizable Ichimoku cloud.
-Multi-timeframe Trendline that tells you the true trend of the current market based on volume. (Only works in markets with available volume information flows). It can change from green (for an uptrend) or red (downtrend) color.
To place an alert, always choose the "Once per bar" option.
You can place alerts on the following options:
-GO Buy / GO Sell (ATR).
-VPT Buy / Sell.
-PSAR (Up / Down).
-Divergences (Bullish / Bearish).
-Crossing of moving averages 1 and 2.
-Fibonacci key levels (0.382, 0.5 and 0.618) for Crossunder and Crossover in an uptrend or downtrend.
You can choose to show or hide from the chart all the options mentioned above.
Never follow buy or sell signals stupidly. Always watch that all the indicators are going in the same direction, that you are not in a range zone, that there is no resistance etc ...
Always wait for confirmation after a buy or sell alert before entering a position to make sure the label stays on the chart and doesn't disappear.
Please feel free to give your ideas, suggestions or bug reports in the comments area to help me improve it.
A BIG THANKS TO QUANTNOMAD FOR GIVING ME ITS AUTHORIZATION TO USE, MODIFY AND REPUBLIC ITS "Ultimate Pivot Points Alerts" script indicator:
Good trade everyone! And remember, money management is the most important!
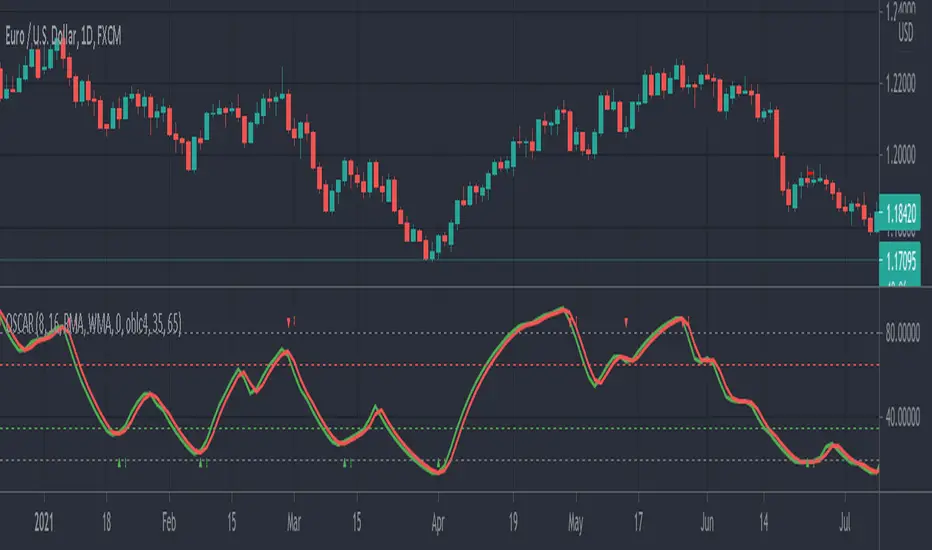
OSCAR Oscillator by GenZai - NNFXOSCAR Oscillator by GenZai
Green line is the Oscar Rough
Red line is the Oscar
By default based on the 8 last candles and smoothed using RMA
Purple line is the Slow Oscar
By default based on the 16 last candles and smoothed using WMA
HOW TO USE
Exit signaling
This indicator can be used as an exit indicator when line cross each other.
Entry signaling
When the green line crosses up, it indicates a long entry
When the red line crosses up, it indicates a short entry
Overbought/Oversold
When the indicator crosses the dashed grey lines it indicates Overbought Oversold
Slow Oscar Add-on
This is an Add-on to the orignal Oscar indicator
Can be hidden if you want the original experience of the Oscar indicator.
Can be used as a confirmation indicator by looking at the direction of the slope to verify is your are trending long or trending short.
Can be used as a baseline to confirm signals given by Oscar
Can be used to tweak your signals and test different settings.
Stock or Forex?
The program was originally written for stocks, but works equally well with the Forex market.
How this indicator is calculated ?
This is the formula we use to calculate the Oscar:
let A = the highest high of the last eight days (including today)
let B = the lowest low of the past eight days (including today)
let C = today's closing price
let X = yesterday's oscillator figure (Oscar)
Today's "rough" oscillator equals (C-B) divided by (A-B) times 100.
Next we "smooth" our rough number (let's call it Y) like this:
Final oscillator number = ((X divided by 3) times 2), plus (Y divided by 3).
SETTINGS:
You can choose between different smoothing options:
RMA: Moving average used in RSI. It is the Adjusted exponential moving averages (also known as Wilder's exponential moving average)
SMA : Simple moving average
EMA : Exponential moving average
WMA : Weighted moving average
超级趋势(Supertrend)指标This is a normal Supertrend indicator which redesign and translate for Chinese.
这是一个通用的超级趋势(Supertrend)指标。
本脚本的目的在于帮助使用中文的人了解该指标,特别是其用法。同时将该指标代码添加完整的中文注释,方便使用中文的人学习Pine语言。
超级趋势指标(SuperTrend)是最常见的基于ATR的指标之一。
本指标的特色
相对于标准的超级趋势指标,在此版本中,你可以从设置中更改ATR计算方法。ATR的默认计算方式是采用RMA(RSI中使用的移动平均线,称之为指数加权移动平均线),本版本中可以使用SMA来替代计算ATR。
默认设置项为勾选状态,即ATR的计算方式为标准的RMA。
指标可调节参数
该指标有两个可设置的参数
1 ATR参数:默认为10;
2 ATR乘数:默认为3。
本指标还有两项可选设置项
1 价格源:价格源默认使用收盘价,但是你还可以选择使用开盘价、最高价、最低价等其他的价格计算方式;
指标用法
超级趋势指标出现在价格之上或价格之下时,就会产生买入和卖出信号。
买入信号: 当超级趋势指标在价格下方绘制时,即图表中的绿色信号线开始出现时,则产生买入信号;同时超级趋势指标的买入信号线可以作为买入的止损点;
卖出信号: 当超级趋势指标在价格上方绘制时,即图表中的红色信号线开始出现时,则产生卖出信号;同时超级趋势指标的卖出信号线可以作为卖出的止损点。
本指标支持配置买卖点的预警。
指标优势
1 适用于不同的时间周期和不同的交易品种;
2 对趋势有很好的识别效应;
3 可以提供明确的止损价位参考。
指标局限性
与其他趋势指标类似,超级趋势指标的作用在于帮助你抓住大趋势,但是在震荡行情,特别是长期的震荡行情中会失真,此时若按照超级趋势指标交易,则会产生亏损。

多重平均线(Multi Moving Average)This is a Multi Moving Average indicator which redesign and translate for Chinese.
这是一个多重平均线(Multi Moving Average)指标。
本脚本的目的在于帮助使用中文的人了解该指标,特别是其用法。同时将该指标代码添加完整的中文注释,方便使用中文的人学习Pine语言。
平均线是最常用的技术分析方法之一。
本指标的特色
相对于官方提供的平均线,本版本平均线指标有两点特色:
1 可以在图表上一次显示多条(最多6条)移动平均线;
2 支持包括SMA、EMA、WMA、HMA、VWMA、RMA等多种平均线,可以根据自己的需求选择相应的平均线。
*注释
SMA:简单移动平均线
EMA:指数加权移动平均线
WMA:加权移动平均线
HMA:船体移动平均线
VWMA:成交量加权移动平均线
RMA:RSI指标中使用的移动平均线,也叫指数加权移动平均线
指标可调节参数
该指标有六个可设置的参数
1 MA1:默认为5;
2 MA2:默认为13;
3 MA3:默认为20;
4 MA4:默认为40;
5 MA5:默认为80;
6 MA6:默认为160。
本指标还有两项可选设置项
1 价格源:价格源默认使用收盘价,但是你还可以选择使用开盘价、最高价、最低价等其他的价格计算方式;
2 选择使用的MA类型;

MACD ProMoving average convergence divergence pro.
Original MACD with new features, Including...
1. Three different modes.
Basic, Logarithmic, Percent (calculates difference of oscillator MAs in percent)
2. Additional moving averages for oscillator, signal and even histogram.
EMA, WMA (linearly weighted), LMA (logarithmically weighted), SMA
Volume Weighted RMA (I've been suggested to make a MACD with the VWEMA that I published recently but that was too fast, this almost 2 times slower because of using RMA instead of EMA)
VWRMA(s) (an alternative for VWRMA which uses candle formation to simulate the volume, can be useful when volume is not provided for the symbol or it is not proper)
And DEMA (Double Exponential MA)
3. Signal Displacement.
If you want to add some delay to signal, could help for extra confirmation of center crosses and removal of some falss ones.
4. Histogram Smoother.
For those who like the smooth curves. Can deliver a cleaner histogram even in volatile markets.
5. Bar color for more fun.

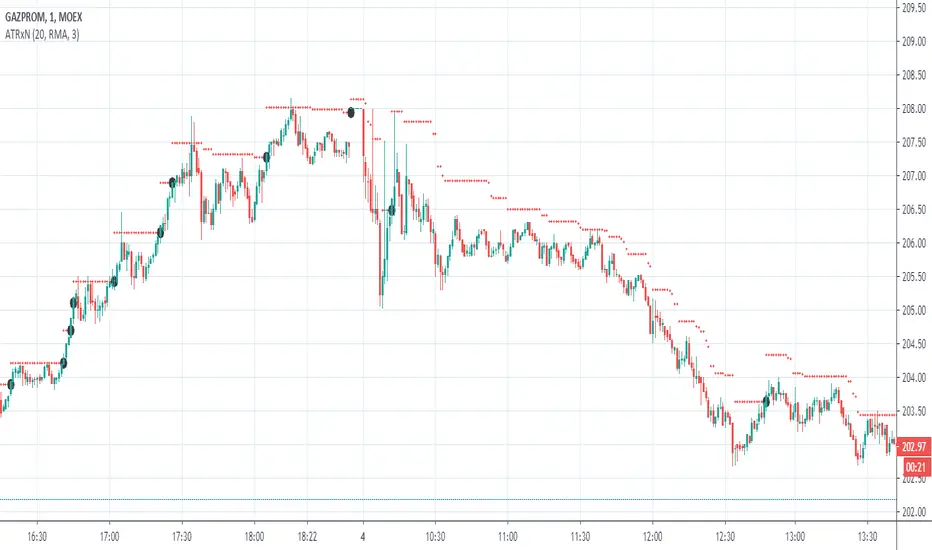
ATRxNIndacator shows price range calculated as previous closing price +/- ATR * multiplier
Setup options: multiplier, average type (RMA, EMA,SMA,WMA), Source and number of point to average
Индикатор показывает диапазон цен рассчитанный как цена предыдущего закрытия +/- ATR * множитель
Настраивается : Множитель, тип усреднения (RMA, EMA,SMA,WMA), Источник и Длина усреднения
Trend Following MAs 3DHello All,
This is Moving Averages Trend Following 3D indicator. The idea is based on direction of MAs and relation between 20 moving averages (5 to 100 period).
Option to show different type of MAs: EMA, SMA, RMA, WMA, VWMA.
As I haved tested it looks succesful at calculating trend direction and trend strength.
For a better look I tried to make it 3D, it looks good I think, waiting comments ;)
Some screenshots:
By using RMA type:
When it gets tiny it means there is no trend:
An example for down trend:
ENJOY!

[LunaOwl] 超級趨勢2 (SuperTrend2)It is very similar to the previous version. I changed the function from study to a strategy, and added the Average true range to RMA again.
I don't know the academic suitability, but using this strategy to trade the Altcoins market may have a good effect.
refer to Binance for 0.1% of fees, starting from Q4 2017.
跟以前的版本變化不大,我將腳本函數從"study"更改為"strategy",然後將平均真實範圍再次用遞迴平均線均化數值。
不知道學術上的適不適合這麼做...但是,直到目前交易小幣現貨市場,效果還算不錯,用用看。
交易手續費參考幣安小幣,0.1%,從2017年第四季開始測。
Updated:
--1. use RMA to reduce ATR noise.
--2. for the highly volatile Altcions market, strategy should focus on reducing noise.
--3. the Street commonly used alpha filtering for Random Walk.
--4. compared to other MAs, the performance is not outstanding, but the advantage is stability.
--5. I choose the 4H time frame to test the Altcoins (ex: ETH).
稍做更新:
--1.平均真實區間利用了遞迴均線減少雜訊
--2.針對高波動率的小幣市場,中期順勢策略應該以減少雜訊為重點
--3.研究國外交易策略後,它們常用平滑因子過濾隨機走勢
--4.績效上和其它平均法比較並沒有突出,但優點是參數變動穩定性
--5.我選擇四小時線回測小幣市場,並且選擇經歷過牛熊市的以太坊
The purpose of publishing Chinese Scripts is to make Pine close to more Chinese user.
發布中文腳本的目的,是希望可以讓 Pine 親近更多中文圈的使用者。

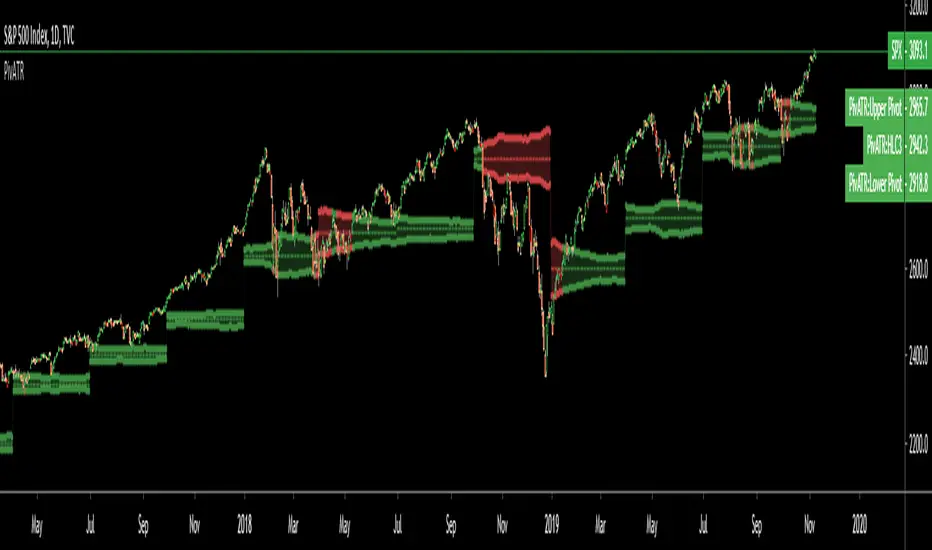
Adaptive Pivot (HLC3)SUMMARY:
Standard Pivot (HLC3) with ATR leeway added to make it adaptive to market volatility.
DESCRIPTION:
Adaptive Pivot is an indicator utilizing the simplicity of HLC3 Pivots as a turning point (and sometimes a trend indicator) while addressing it's fixed and inflexible nature.
Because the indicator is just a single line in the chart, the price may go near it but never touch it. Or it can go pass through it and never retest it again. In an attempt to lessen these from occurring, we can combine pivots with average true range (ATR). This is the specific formula I applied in this indicator:
>Upper Pivot = HLC3 + ATR
>Lower Pivot = HLC3 - ATR
This creates a kind of a range or cloud around the Pivot, making it possibly a more accurate indicator for market turning points.
ADJUSTABLE PARAMETERS:
The usual ATR parameters are included in this indicator:
>ATR_Length = input(14, title="ATR Length", minval=1)
>ATR_Smoothing = input(title="ATR Smoothing", defval="RMA", options="RMA", "SMA", "EMA", "WMA")
Added to the usual ones is this:
>ATR_Multiplier = input(1, title="ATR Multiplier", minval=0.1)
which modifies the extent of the ATR (similar to Chandelier Exit) as it is added/subtracted from the pivot values.
Pivot’s timeframe is also adjustable:
>Pivot_Timeframe = input("3M", title='Pivot Resolution')
Note: I did not lock the type to input.resolution to allow for more possible timeframes.
OTHER PARAMETERS
Indicator color will change to green when the open is above the HLC3 Pivot and change to red when the reverse is true.
Tuka balance with rsi(Prototype)'Tuka' is Japanese called currency.
I made this indicator to see the strength of the currency.
※Use google translation※
■ Difference with other indicators.
・ We used RMA to find currency pairs with volatility. And by using the average foot I saw a gentle wave.
・Made it possible to select 2 standard currency from "EUR, USD, JPY, GBP, AUD" and 4 currencies as options "NZD, CHN, CAD, CHF".
・Added RSI to find weak currencies that are oversold.
・The meaning of kanji is
EUR:欧
USD:米
JPY:日
GBP:英
AUD:豪
NZD:新
CHN:中
CAD:加
CHF:瑞
■他のインジケーターとの違い。
・ボラティリティのある通貨ペアを見つけるのにRMAを使ってみた。且つ平均足を使う事でなだらかな波を見るようにした。
・基準通貨を5つ”EUR、USD、JPY、GBP、AUD”、オプションで4通貨”NZD、CHN、CAD、CHF”から2つを選択出来るようにした。
・RSIを追加することで、売られすぎの弱い通貨を見つけられるようにしました。
EUR:欧
USD:米
JPY:日
GBP:英
AUD:豪
NZD:新
CHN:中
CAD:加
CHF:瑞

Delta Volume, by AlexIncOften before the marked falls, the volume is decreasing, so I make indicator which shows volume change. It is made of RMA of Volume.
Часто перед тем, как рынок падает, в нем значительно уменьшаются объемы. Для отслеживания этих закономерностей я создал этот индикатор - по сути он обрабатывает RMA от объема. Если он на локальном минимуме, вероятен пролив.


SB_Compliment_RSI StrategyThe strategy modifies the original rsi strategy with the addition of compliment si (i.e. 100-rsi).
Strategy Idea: Previous rsi high and low value is recorded when the rsi crosses overBought(70) and OverSold(30) values.
Now when the rsi crosses above the overSold range, the rsi is matched with the compliment of previous high rsi value. If the compliment i.e.(100-prev_rsi_high) is less than or equal to rsi then long position is taken.
For short position, when the rsi crosses below the overBought range, the rsi is matched with the compliment of previous low rsi value. If compliment i.e.(100-prev_rsi_low) is greater than or equal to rsi.
Below s the code for the indicator present in the chart.
//@version=3
study(title="SB_Compliment_Relative Strength Index", shorttitle="RSI")
src = close, len = input(14, minval=1, title="Length")
up = rma(max(change(src), 0), len)
down = rma(-min(change(src), 0), len)
rsi = down == 0 ? 100 : up == 0 ? 0 : 100 - (100 / (1 + up / down))
plot(rsi, color=purple)
plot(100-rsi, color=orange)
band1 = hline(70)
band0 = hline(30)
fill(band1, band0, color=purple, transp=90)
The code also has switch code also which means it will enter the overBrought or overSold block one after the other.
Future modifications: Currently the value of rsi tracked is the one in which it crosses the overSold or OverBought range and not the highest/lowest value when the value is above/below OverBought/OverSold range.
Comment the perfect combination of indicators for it and will try to incorporate those indicators into it in the next version.
Message if you think of any modifications/ enhancements/ any opportunities. :)
Donations/Tips... :) -
BTC: 1BjswGcRR6c23pka7qh5t5k56j46cuyyy2
ETH: 0x64fed71c9d6c931639c7ba4671aeb6b05e6b3781
LTC: LKT2ykQ8QSzzfTDB6Tnsf12xwYPjgq95h4

How to automate this strategy for free using a chrome extension.Hey everyone,
Recently we developed a chrome extension for automating TradingView strategies using the alerts they provide. Initially we were charging a monthly fee for the extension, but we have now decided to make it FREE for everyone. So to display the power of automating strategies via TradingView, we figured we would also provide a profitable strategy along with the custom alert script and commands for the alerts so you can easily cut and paste to begin trading for profit while you sleep.
Step 1:
You are going to need to download the Chrome Extension called AutoView. You can get the extension for free by following this link: bit.ly ( I had to shorten the link as it contains Google and TV automatically converts it to a symbol)
Step 2: Go to your chrome extension page, and under the new extension you'll see a "settings" button. In the setting you will have to connect and give permission to the exchange 1broker allowing the extension to place your orders automatically when triggered by an alert.
Step 3: Setup the strategy and custom script for the alerts in TradingView. The attached script is the strategy, you can play with the settings yourself to try and get better numbers/performance if you please.
This following script is for the custom alerts:
//@version=2
study("4All-Alert", shorttitle="Alerts")
src = close
len = input(4, minval=1, title="Length")
up = rma(max(change(src), 0), len)
down = rma(-min(change(src), 0), len)
rsi = down == 0 ? 100 : up == 0 ? 0 : 100 - (100 / (1 + up / down))
rsin = input(5)
sn = 100 - rsin
ln = 0 + rsin
short = crossover(rsi, sn) ? 1 : 0
long = crossunder(rsi, ln) ? 1 : 0
plot(long, "Long", color=green)
plot(short, "Short", color=red)
Now that you have the extension installed, the custom strategy and alert scripts in place, you simply need to create the alerts.
To get the alerts to communicate with the extension properly, there is a specific syntax that you will need to put in the message of the alert. You can find more details about the syntax here : gist.github.com
For this specific strategy, I use the Alerts script, long/short greater than 0.9 on close.
In the message for a long place this as your message:
Long
c=order b=short
c=position b=short l=200 t=market
b=long q=0.01 l=200 t=market tp=13 sl=25
and for the short...
Short
c=order b=long
c=position b=long l=200 t=market
b=short q=0.01 l=200 t=market tp=13 sl=25
If you'll notice in my above messages, compared to the strategy my tp and sl (take profit and stop loss) vary by a few pips. This is to cover the market opens and spread on 1broker. You can change the tp and sl in the strategy to the above and see that the overall profit will not vary much at all.
I hope this all makes sense and it is enough to not only make some people money, but to show the power of coming up with your own strategy and automating it using TradingView alerts and the free Chrome Extension AutoView.
ps. I highly recommend upgrading your TradingView account so you have access to back testing and multiple alerts.
There is really no reason you won't cover the cost and then some on a monthly basis using the tools provided.
Best of luck and happy trading.
Note: The extension currently allows for automation on 2 exchanges; 1broker and Okcoin. If you do not have accounts there, we'd appreciate you signing up using our referral links.
www.okcoin.com
1broker.com

Dual Bollinger BandsDual Bollinger Bands
Dual Bollinger Bands is an advanced volatility-based indicator that plots two independent Bollinger Band sets on the same chart, allowing traders to analyze price behavior from multiple perspectives simultaneously.
Unlike standard Bollinger Bands, this indicator lets you configure each band set separately, making it especially useful for identifying asymmetric volatility, price compression/expansion zones, and dynamic support and resistance levels.
Key Features
Two fully independent Bollinger Bands
Each band has its own length, standard deviation multiplier, and moving average type.
Different price sources
BB1 can be calculated using High prices, while BB2 can use Low prices (or any source you choose), enabling a directional volatility envelope.
Custom Moving Average types
Choose between SMA, EMA, SMMA (RMA), WMA, or VWMA for each Bollinger basis.
Offset capability
Optional forward/backward offset allows visual projection or historical alignment analysis.
Clear visual separation
Each Bollinger set uses distinct colors and shaded areas for easy interpretation.
Overlay on price chart
Designed to work directly on the main chart for contextual market analysis.
How to Use
Volatility Analysis
Observe expansions and contractions between the two Bollinger sets to identify volatility regimes.
Dynamic Support & Resistance
Upper and lower bands can act as adaptive levels where price may react or revert.
Trend Context
When price consistently respects one side of a band set, it may indicate directional strength.
Mean Reversion & Breakout Zones
Convergence between bands may suggest compression, while rapid divergence can signal breakout conditions.
Best Use Cases
Intraday and swing trading
Volatility-based strategies
Trend-following or mean-reversion systems
Crypto, Forex, Indices, and Equities
Notes
This indicator does not generate signals by itself. It is designed to be used as a contextual volatility and structure tool, ideally combined with price action, market structure, or higher-level trading frameworks.

stelaraX - Moving AveragestelaraX – Moving Average
stelaraX – Moving Average is a flexible moving average indicator that allows switching between multiple MA calculation types while keeping a clean and minimal chart appearance. The indicator is designed for trend identification, dynamic support and resistance, and general market bias analysis.
For advanced AI-based chart analysis and automated trend evaluation, visit stelarax.com
Core logic
The indicator calculates a single moving average based on the selected type:
* Simple Moving Average (SMA)
* Exponential Moving Average (EMA)
* Weighted Moving Average (WMA)
* Volume Weighted Moving Average (VWMA)
* Running Moving Average (RMA)
The moving average is calculated using a user-defined period and price source, allowing full control over responsiveness and sensitivity.
Visualization
The script plots one moving average line directly on the chart:
* adjustable moving average type
* configurable period length
* selectable price source
* customizable line color
* fixed line width for clear visibility
The minimal design ensures an uncluttered chart and seamless combination with other indicators.
Use case
This indicator is intended for:
* trend identification and confirmation
* dynamic support and resistance analysis
* moving average based trading strategies
* multi-timeframe trend alignment
* clean chart setups with minimal visual noise
For a fully automated AI-driven chart analysis solution, additional tools and insights are available at stelarax.com
Disclaimer
This indicator is provided for educational and technical analysis purposes only and does not constitute financial advice or trading recommendations. All trading decisions and risk management remain the responsibility of the user.

stelaraX - Moving Average MultistelaraX – Multi MA
stelaraX – Multi MA is a flexible moving average indicator that allows the use of up to four independently configurable moving averages on a single chart. Each moving average can be customized by type, length, source, color, and line width, making the indicator suitable for a wide range of trading styles and timeframes.
The indicator is designed to provide a clear overview of trend direction, dynamic support and resistance, and moving average interactions.
Core logic
The script supports multiple moving average calculation methods:
* Simple Moving Average (SMA)
* Exponential Moving Average (EMA)
* Weighted Moving Average (WMA)
* Hull Moving Average (HMA)
* Volume Weighted Moving Average (VWMA)
* Running Moving Average (RMA)
Each of the four moving averages can be enabled or disabled individually and calculated from any price source.
Crossover signals
The indicator can generate crossover signals between any two selected moving averages:
* bullish crossover when the fast MA crosses above the slow MA
* bearish crossover when the fast MA crosses below the slow MA
Crossover signals are displayed directly on the chart using directional markers and can be enabled or disabled as needed.
MA cloud
An optional moving average cloud can be displayed between two selected moving averages:
* bullish cloud when the faster MA is above the slower MA
* bearish cloud when the faster MA is below the slower MA
Cloud colors and transparency are fully customizable.
Visualization
The indicator plots up to four moving average lines directly on the chart.
Additional visual features include:
* optional MA crossover markers
* optional moving average cloud
* optional bar coloring based on price position relative to selected moving averages
Bar colors reflect basic trend conditions when price is above or below selected averages.
Alerts
Alert conditions are available for:
* bullish and bearish moving average crossovers
* price crossing above or below selected moving averages
* price crossing above or below the long-term moving average
Alerts trigger only on confirmed crossover conditions.
Use case
This indicator is intended for:
* trend identification and confirmation
* moving average crossover strategies
* dynamic support and resistance analysis
* multi-timeframe trend alignment
* general market structure visualization
Disclaimer
This indicator is provided for educational and technical analysis purposes only and does not constitute financial advice or trading recommendations. All trading decisions and risk management remain the responsibility of the user.

Moving Average Momentum Bands📊 MA Momentum Bands - Crossover Detection with Predictive Signals
Overview
Advanced moving average system with intelligent crossover detection and early warning predictive signals. Designed to catch trend changes with precise timing while filtering out choppy market noise.
Key Features
📈 4 Customizable Moving Averages
Choose from EMA, SMA, SMMA (RMA), WMA, or VWMA
Adjustable periods and colors
Visual fill zones between MA pairs
✓ Confirmed Crossover Signals
Fires on actual MA crossover with confirmation filters
Slope Filter: Requires slow MA to be trending (filters choppy markets)
Acceleration Filter: Detects momentum shifts and deceleration (catches reversals)
Highly configurable thresholds for different trading styles
⚠ Predictive Signals (Optional)
Early warning system fires 1-8 bars BEFORE actual crossover
Velocity-based calculation estimates when crossover will occur
Smart debouncing prevents signal spam (fires once per setup)
Auto-resets after crossover or when prediction fails
🔍 Debug Table
Real-time metrics: MA slope, acceleration, velocity, distance
"Bars Until Cross" prediction countdown
Perfect for fine-tuning settings
How It Works
Confirmed Signals (✓ triangles):
Fast MA crosses Slow MA
Slow MA must be trending (slope > threshold) OR decelerating
Filters ensure quality signals in trending markets
Predictive Signals (⚠ triangles):
Calculates MA velocities (rate of change)
Estimates bars until crossover based on approach speed
Fires early warning when crossover imminent
Only fires once per setup (no spam)
Best Use Cases
Swing Trading: Catch trend changes early with predictive signals
Trend Following: Use confirmed signals for high-probability entries
Multi-Timeframe: Combine with higher TF analysis for confirmation
Filter for Other Strategies: Add MA crossover confirmation to your existing system
Recommended Settings
Conservative (Fewer, Higher Quality Signals):
Slope Threshold: 0.002-0.005
Acceleration Filter: ON
Predict Bars Ahead: 5-8
Balanced (Default):
Slope Threshold: 0.001-0.002
Acceleration Filter: ON
Predict Bars Ahead: 3-5
Aggressive (More Signals, Earlier Entries):
Slope Threshold: 0.0001
Acceleration Filter: OFF
Predict Bars Ahead: 1-3
Quick Start
Add to chart - confirmed signals work immediately
Adjust slope/acceleration filters to match your timeframe
Enable predictive signals for early entries
Use debug table to fine-tune settings
Set up alerts for hands-free trading
Alerts Included
Bullish/Bearish MA Cross (confirmed)
Predictive Bullish/Bearish Cross (early warning)
Perfect for traders who want to catch trend changes early while avoiding false signals in choppy markets!

Momentum - MOM🎯 Overview
This is an advanced Momentum - MOM indicator that measures absolute price change over time, combined with dynamic moving average filtering. Unlike basic MOM implementations, this version features gradient momentum zones, multiple color themes, and a clear signal dashboard for precise price momentum identification.
🧩 Core Components
1. ⚙️ Technical Foundation
📊 Primary Calculation: Uses TradingView's built-in ta.mom() function which calculates absolute price difference between current price and price N periods ago
📈 Dual Analysis Components:
MOM Line: Absolute price change oscillator (unbounded range based on price)
MA Filter: Customizable moving average acting as momentum baseline
Momentum Zones: Gradient fills for strong positive and negative momentum extremes
⚡ Absolute Change Measurement: Unique ability to quantify the actual price movement in points/currency units
2. 🎛️ Configuration Parameters
📏 MOM Length: Default 14 periods (standard momentum setting)
🔄 MA Filter Settings:
Length: Customizable (default 365 periods)
Type: 6 options available (EMA, SMA, RMA, WMA, VWMA, HMA)
🎨 Color Themes: 5 visual schemes consistent with your indicator suite:
Classic, Modern, Robust, Accented, Monochrome
📊 Signal Interpretation:
🟢 BULLISH: MOM > MA Filter (price momentum above baseline)
🔴 BEARISH: MOM < MA Filter (price momentum below baseline)
🚀 STRONG BULLISH: (extreme positive momentum)
📉 STRONG BEARISH: (extreme negative momentum)
3. 🎨 Visual Elements
🚨 Gradient Zones:
Strong Bullish zone : Green gradient intensifying toward higher values
Strong Bearish zone : Red gradient intensifying toward lower values
📋 Dashboard Display: Top-right status indicator showing "⬆️ Bullish" or "⬇️ Bearish"
📊 Dynamic Coloring: MOM line changes color based on position relative to MA
⚡ Midline Reference: Subtle 50-level reference line for scale orientation
⚡ Trading Applications
📈 Primary Uses:
🎯 Absolute Momentum Measurement:
MOM > MA = Bullish price momentum
MOM < MA = Bearish price momentum
MOM = 0 = No net price change over period
💪 Momentum Strength in Price Terms:
Shows actual points/currency gained or lost
Useful for position sizing and risk management
More intuitive than percentages for some traders
🚨 Extreme Momentum Signals:
Extreme Bullish: (major price appreciation)
Extreme Bearish: (major price depreciation)
📊 Zone Analysis:
🟢 Strong Bullish Zone :
Green gradient fills
Indicates substantial price gains over the period
Often signals strong trend continuation or potential exhaustion
🔴 Strong Bearish Zone :
Red gradient fills
Indicates substantial price losses over the period
Often signals strong downtrend or potential reversal
🟡 Equilibrium: Yellow MA line acts as momentum baseline filter
🎨 Customization Options
👁️ Display Features:
📊 Dual Components: Always shows both MOM line and MA filter
🎨 Gradient Visualization: Automatic fill for extreme momentum conditions
📋 Status Dashboard: Clear bullish/bearish momentum indication
📈 Customizable MA: Choose from 6 different moving average types
📏 Wide Dynamic Range: ±15,000 levels accommodate various asset price ranges
🎨 Visual Themes: (Consistent suite)
🎨 Classic: Green/Red (traditional momentum colors)
🚀 Modern: Cyan/Purple (contemporary)
💪 Robust: Amber/Deep Purple (high contrast)
🌈 Accented: Purple/Magenta (vibrant)
⚫⚪ Monochrome: Light Gray/Dark Gray (minimalist)
🔔 Alert System
🟢 LONG Alert: Triggers when MOM crosses above MA
🔴 SHORT Alert: Triggers when MOM crosses below MA
📧 Format: Includes ticker symbol for tracking
⚡ Key Advantages
✅ Strengths:
🎯 Price-Based Analysis: Measures actual price movement in understandable units
💪 Absolute Value Interpretation: Shows exact points gained/lost over period
👁️ Clear Trend Momentum: MA filter separates noise from meaningful momentum
🔄 Flexible Across Assets: Works equally well with stocks, crypto, forex, etc.
📊 Professional Dashboard: Immediate momentum status recognition
📊 Optimal Settings:
⚡ Short-term Trading: MOM Length 10-14, MA Length 20-50
📊 Medium-term Trading: MOM Length 14-20, MA Length 50-100
📈 Long-term Trading: MOM Length 20-30, MA Length 100-365
🏆 Unique Features:
🎯 Absolute Price Measurement: Shows exact price change, not percentages
📊 Extreme Thresholds: ±15,000 levels for major momentum identification
🎨 Consistent Design: Matches your indicator family aesthetics
📋 Momentum Dashboard: Quick visual confirmation of price momentum
🔧 Direct Price Analysis: No conversion needed - shows actual market movement
🔄 Trading Strategies
1. Price Momentum Strategy:
Go LONG when MOM crosses above MA with positive values
Go SHORT when MOM crosses below MA with negative values
Strong signals when MA crossover aligns with extreme zones
2. Momentum Divergence:
Price makes higher high, MOM makes lower high → Bearish divergence (momentum weakening)
Price makes lower low, MOM makes higher low → Bullish divergence (selling pressure decreasing)
3. Trend Strength Assessment:
Large positive MOM values = Strong uptrend momentum
Large negative MOM values = Strong downtrend momentum
MOM near zero = Consolidation or trend change
📈 Performance Tips
Asset-Specific Thresholds: Adjust ±15,000 levels based on typical price ranges
Zero Line Significance: MOM crossing zero often precedes trend changes
Extreme Readings: Very high/low MOM values may indicate exhaustion moves
Multiple Timeframes: Compare MOM values across timeframes for confirmation
Combine with Volume: Add volume analysis to confirm momentum moves
This enhanced Momentum indicator provides professional-grade price-based momentum analysis with intuitive visualization, allowing traders to measure exact price movements, identify momentum trends in absolute terms, and filter signals through the customizable moving average for precise momentum-based trading decisions! 📊📈

Rate of Change - ROC🎯 Overview
This is an advanced Rate of Change - ROC indicator that measures percentage price movement over time, combined with dynamic moving average filtering. Unlike basic ROC implementations, this version features gradient momentum zones, multiple color themes, and a clear signal dashboard for precise momentum velocity identification.
🧩 Core Components
1. ⚙️ Technical Foundation
📊 Primary Calculation: Uses TradingView's built-in ta.roc() function which calculates percentage change between current price and price N periods ago
📈 Dual Analysis Components:
ROC Line: Percentage change oscillator
MA Filter: Customizable moving average acting as momentum trend line
Momentum Zones: Gradient fills for strong positive and strong negative momentum
⚡ Velocity Measurement: Unique ability to quantify the speed of price movement as a percentage
2. 🎛️ Configuration Parameters
📏 ROC Length: Default 35 periods (optimized for momentum detection)
🔄 MA Filter Settings:
Length: Customizable (default 365 periods)
Type: 6 options available (EMA, SMA, RMA, WMA, VWMA, HMA)
🎨 Color Themes: 5 visual schemes consistent with your indicator suite:
Classic, Modern, Robust, Accented, Monochrome
📊 Signal Interpretation:
🟢 BULLISH: ROC > MA Filter (momentum accelerating upward)
🔴 BEARISH: ROC < MA Filter (momentum accelerating downward)
🚀 STRONG BULLISH: ROC > 40% (extreme positive momentum)
📉 STRONG BEARISH: ROC < -20% (extreme negative momentum)
3. 🎨 Visual Elements
🚨 Gradient Zones:
Strong Bullish zone : Green gradient intensifying toward higher percentages
Strong Bearish zone : Red gradient intensifying toward lower percentages
📋 Dashboard Display: Top-right status indicator showing "⬆️ Bullish" or "⬇️ Bearish"
📊 Dynamic Coloring: ROC line changes color based on position relative to MA
⚡ Zero Line Reference: Natural equilibrium at 0% change
⚡ Trading Applications
📈 Primary Uses:
🎯 Momentum Velocity Measurement:
ROC > MA = Accelerating bullish momentum
ROC < MA = Accelerating bearish momentum
💪 Momentum Strength Quantification:
Higher positive percentages = Stronger uptrend acceleration
Lower negative percentages = Stronger downtrend acceleration
Measures rate of change rather than just direction
🚨 Extreme Momentum Signals:
Strong Bullish: (rapid price appreciation)
Strong Bearish: (rapid price depreciation)
📊 Zone Analysis:
🟢 Strong Bullish Zone :
Green gradient fills
Indicates rapid price acceleration upward
Often precedes consolidation or pullback
🔴 Strong Bearish Zone :
Red gradient fills
Indicates rapid price acceleration downward
Often precedes bounce or reversal
🟡 Equilibrium: Yellow MA line acts as momentum trend filter
🎨 Customization Options
👁️ Display Features:
📊 Dual Components: Always shows both ROC line and MA filter
🎨 Gradient Visualization: Automatic fill for extreme momentum conditions
📋 Status Dashboard: Clear bullish/bearish momentum acceleration indication
📈 Customizable MA: Choose from 6 different moving average types
📏 Adjustable Thresholds: 40% and -20% levels optimized for ROC analysis
🎨 Visual Themes: (Consistent suite)
🎨 Classic: Green/Red (traditional momentum colors)
🚀 Modern: Cyan/Purple (contemporary)
💪 Robust: Amber/Deep Purple (high contrast)
🌈 Accented: Purple/Magenta (vibrant)
⚫⚪ Monochrome: Light Gray/Dark Gray (minimalist)
🔔 Alert System
🟢 LONG Alert: Triggers when ROC crosses above MA
🔴 SHORT Alert: Triggers when ROC crosses below MA
📧 Format: Includes ticker symbol for tracking
⚡ Key Advantages
✅ Strengths:
🎯 Velocity-Based Analysis: Measures speed of price movement, not just direction
💪 Percentage-Based: Provides intuitive understanding of momentum strength
👁️ Trend Acceleration Identification: MA filter shows when momentum is accelerating/decelerating
🔄 Flexible Timeframes: 35-period default optimized for momentum detection
📊 Professional Dashboard: Immediate momentum acceleration status
📊 Optimal Settings:
⚡ Short-term Momentum: ROC Length 10-20, MA Length 20-50
📊 Medium-term Momentum: ROC Length 20-35, MA Length 50-100
📈 Long-term Momentum: ROC Length 35-50, MA Length 100-365
🏆 Unique Features:
🎯 Percentage-Based Measurement: Shows exact rate of price change
📊 Asymmetric Thresholds: 40% bullish / -20% bearish (reflects typical market asymmetry)
🎨 Consistent Design: Matches your indicator family aesthetics
📋 Momentum Dashboard: Quick visual confirmation of acceleration/deceleration
🔧 Speed Analysis: Focuses on velocity rather than just position
🔄 Trading Strategies
1. Momentum Acceleration Strategy:
Go LONG when ROC crosses above MA with ROC > 0%
Go SHORT when ROC crosses below MA with ROC < 0%
Strong signals when crossing occurs in extreme zones
2. Velocity Divergence:
Price makes higher high, ROC makes lower high → Momentum divergence (trend weakening)
Price makes lower low, ROC makes higher low → Momentum divergence (downtrend losing steam)
3. Trend Acceleration Detection:
Rising ROC above MA = Uptrend accelerating
Falling ROC below MA = Downtrend accelerating
Flat ROC near MA = Trend consolidation
📈 Performance Tips
Context Matters: High ROC during strong trends is normal, during ranges may signal exhaustion
Zero Line Cross: ROC crossing 0% often signals trend change
Extreme Readings: ROC > 40% often precedes consolidation, ROC < -20% often precedes bounce
Timeframe Alignment: Use consistent periods across charts for comparable readings
Confirmation: Combine with price structure and volume for highest probability trades
This enhanced ROC indicator provides professional-grade momentum velocity analysis with intuitive visualization, allowing traders to quantify the speed of price movements, identify acceleration/deceleration phases, and filter signals through the customizable moving average for precise momentum-based trading decisions! 📊⚡

Money Flow Index - MFI🎯 Overview
This is an advanced Money Flow Index - MFI indicator that combines volume-weighted momentum analysis with dynamic moving average filtering. Unlike basic MFI implementations, this version features gradient overbought/oversold zones, multiple color themes, and a clear signal dashboard for precise money flow identification.
🧩 Core Components
1. ⚙️ Technical Foundation
📊 Primary Calculation: Uses TradingView's built-in ta.mfi() function which incorporates both price and volume data
📈 Dual Analysis Components:
MFI Line: Volume-weighted momentum oscillator
MA Filter: Customizable moving average acting as dynamic signal line
Threshold Zones: Gradient fills for overbought and oversold conditions
⚡ Volume Integration: Unique ability to combine price action with trading volume for more reliable signals
2. 🎛️ Configuration Parameters
📏 MFI Length: Default 14 periods (standard setting)
🔄 MA Filter Settings:
Length: Customizable (default 365 periods)
Type: 6 options available (EMA, SMA, RMA, WMA, VWMA, HMA)
🎨 Color Themes: 5 visual schemes consistent with your indicator suite:
Classic, Modern, Robust, Accented, Monochrome
📊 Signal Interpretation:
🟢 BULLISH: MFI > MA Filter (money flow above trend)
🔴 BEARISH: MFI < MA Filter (money flow below trend)
⚠️ OVERBOUGHT: MFI > 80 (potential reversal zone)
⚠️ OVERSOLD: MFI < 20 (potential reversal zone)
3. 🎨 Visual Elements
🚨 Gradient Zones:
Overbought zone : Red gradient intensifying toward 100
Oversold zone : Green gradient intensifying toward 0
📋 Dashboard Display: Top-right status indicator showing "⬆️ Bullish" or "⬇️ Bearish"
📊 Dynamic Coloring: MFI line changes color based on position relative to MA
⚡ Trading Applications
📈 Primary Uses:
🎯 Money Flow Direction:
MFI > MA = Bullish money flow regime
MFI < MA = Bearish money flow regime
💪 Trend Strength with Volume Confirmation:
MFI considers both price movement AND volume
Higher volume moves have more significance
Validates price trends with volume support
🚨 Extreme Zone Signals:
Overbought: MFI > 80 (potential sell opportunity)
Oversold: MFI < 20 (potential buy opportunity)
📊 Zone Analysis:
🔴 Overbought Zone :
Red gradient fills
Indicates excessive buying pressure
Watch for bearish reversals
🟢 Oversold Zone :
Green gradient fills
Indicates excessive selling pressure
Watch for bullish reversals
🟡 Equilibrium: Yellow MA line acts as volume-weighted trend filter
🎨 Customization Options
👁️ Display Features:
📊 Dual Components: Always shows both MFI line and MA filter
🎨 Gradient Visualization: Automatic fill for overbought/oversold conditions
📋 Status Dashboard: Clear bullish/bearish money flow indication
📈 Customizable MA: Choose from 6 different moving average types
🎨 Visual Themes: (Consistent suite)
🎨 Classic: Green/Red (traditional volume-weighted colors)
🚀 Modern: Cyan/Purple (contemporary)
💪 Robust: Amber/Deep Purple (high contrast)
🌈 Accented: Purple/Magenta (vibrant)
⚫⚪ Monochrome: Light Gray/Dark Gray (minimalist)
🔔 Alert System
🟢 LONG Alert: Triggers when MFI crosses above MA
🔴 SHORT Alert: Triggers when MFI crosses below MA
📧 Format: Includes ticker symbol for tracking
⚡ Key Advantages
✅ Strengths:
🎯 Volume-Weighted Accuracy: Combines price and volume for more reliable signals
💪 Overbought/Oversold Filter: Built-in 80/20 thresholds with gradient visualization
👁️ Clear Trend Identification: MA filter separates noise from meaningful money flow
🔄 Flexible Configuration: Multiple MA types for different trading styles
📊 Professional Dashboard: Immediate money flow status recognition
📊 Optimal Settings:
⚡ Short-term Trading: MFI Length 10-14, MA Length 20-50
📊 Medium-term Trading: MFI Length 14-20, MA Length 50-100
📈 Long-term Trading: MFI Length 20-30, MA Length 100-365
🏆 Unique Features:
🎯 Volume Integration: The only oscillator in your suite that includes volume data
📊 Gradient Thresholds: Visual intensity shows proximity to extremes
🎨 Consistent Design: Matches your indicator family aesthetics
📋 Money Flow Dashboard: Quick visual confirmation of volume trends
🔧 Dual Analysis: Combines oscillator with dynamic trend filter
🔄 Trading Strategies
1. Basic Money Flow Strategy:
Go LONG when MFI crosses above MA from oversold
Go SHORT when MFI crosses below MA from overbought
Exit when opposite extreme is reached
2. Divergence Detection:
Price makes higher high, MFI makes lower high → Bearish divergence (selling pressure weakening)
Price makes lower low, MFI makes higher low → Bullish divergence (buying pressure increasing)
3. Volume Confirmation:
Strong trend + rising MFI = High conviction move
Weak trend + declining MFI = Potential reversal
📈 Performance Tips
Volume Matters: MFI is most effective in markets with consistent volume
Extreme Zones: levels often act as support/resistance for the indicator
Divergence Signals: More reliable than simple overbought/oversold readings
Trend Alignment: MFI above MA in uptrend, below MA in downtrend
Confirmation: Combine with price action at key support/resistance levels
This enhanced MFI indicator provides professional-grade volume-weighted analysis with intuitive visualization, allowing traders to identify money flow trends, spot potential reversals at extremes, and filter signals through the customizable moving average for higher accuracy trading decisions! 📊💰

Chande Momentum Oscillator - CMO🎯 Overview
This is a sophisticated Chande Momentum Oscillator indicator that combines traditional momentum analysis with dynamic moving average filtering. Unlike basic CMO implementations, this version features gradient visualization, multiple color themes, and a clear signal dashboard for precise momentum identification.
🧩 Core Components
1. ⚙️ Technical Foundation
📊 Primary Calculation: Uses TradingView's built-in ta.cmo() function with customizable source and period length
📈 Dual Analysis Components:
CMO Line: Pure momentum oscillator ranging from -100 to +100
MA Filter: Customizable moving average that acts as dynamic signal line
Gradient Zones: Visual fill between CMO and MA showing momentum intensity
⚡ Dynamic Comparison: Creates clear bullish/bearish signals based on CMO vs MA position
2. 🎛️ Configuration Parameters
📏 CMO Length: Default 14 periods (standard momentum setting)
🔄 MA Filter Settings:
Length: Customizable (default 365 periods)
Type: 6 options available (EMA, SMA, RMA, WMA, VWMA, HMA)
🎨 Color Themes: 5 visual schemes consistent with your indicator suite:
Classic, Modern, Robust, Accented, Monochrome
📊 Signal Interpretation:
🟢 BULLISH: CMO > MA Filter (momentum above trend)
🔴 BEARISH: CMO < MA Filter (momentum below trend)
3. 🎨 Visual Elements
🚨 Gradient Zones:
Upper zone (CMO > MA): Green gradient showing bullish momentum intensity
Lower zone (CMO < MA): Red gradient showing bearish momentum intensity
📋 Dashboard Display: Top-right status indicator showing "⬆️ Bullish" or "⬇️ Bearish"
📊 Dynamic Coloring: CMO line changes color based on position relative to MA
⚡ Trading Applications
📈 Primary Uses:
🎯 Momentum Direction Identification:
CMO > MA = Bullish momentum regime
CMO < MA = Bearish momentum regime
💪 Momentum Strength Assessment:
CMO > +50 = Strong bullish momentum
CMO < -50 = Strong bearish momentum
Between -50 and +50 = Moderate momentum
🚨 Crossover Signals:
Bull Signal: CMO crosses above MA
Bear Signal: CMO crosses below MA
📊 Zone Analysis:
🟢 Bullish Zones:
Light to dark green gradient as CMO rises
Strongest color at highest CMO values
🔴 Bearish Zones:
Light to dark red gradient as CMO falls
Strongest color at lowest CMO values
🟡 Equilibrium: Yellow MA line acts as dynamic pivot
🎨 Customization Options
👁️ Display Features:
📊 Dual Components: Always shows both CMO line and MA filter
🎨 Gradient Visualization: Automatic fill between lines showing momentum intensity
📋 Status Dashboard: Clear bullish/bearish indication
📈 Customizable MA: Choose from 6 different moving average types
🎨 Visual Themes: (Consistent suite)
🎨 Classic: Green/Red (traditional momentum colors)
🚀 Modern: Cyan/Purple (contemporary)
💪 Robust: Amber/Deep Purple (high contrast)
🌈 Accented: Purple/Magenta (vibrant)
⚫⚪ Monochrome: Light Gray/Dark Gray (minimalist)
🔔 Alert System
🟢 LONG Alert: Triggers when CMO crosses above MA
🔴 SHORT Alert: Triggers when CMO crosses below MA
📧 Format: Includes ticker symbol for tracking
⚡ Key Advantages
✅ Strengths:
🎯 Clear Momentum Signals: Direct comparison between CMO and MA provides unambiguous entries/exits
💪 Trend Filter: MA acts as dynamic support/resistance for momentum
👁️ Visual Clarity: Gradient zones show momentum intensity at a glance
🔄 Flexible Configuration: Multiple MA types for different trading styles
📊 Professional Dashboard: Immediate status recognition
📊 Optimal Settings:
⚡ Short-term Trading: CMO Length 9-14, MA Length 20-50
📊 Medium-term Trading: CMO Length 14-20, MA Length 50-100
📈 Long-term Trading: CMO Length 20-30, MA Length 100-365
🏆 Unique Features:
🎯 Gradient Visualization: Color intensity reflects momentum strength
📊 MA Filter Flexibility: 6 different moving average types
🎨 Consistent Design: Matches your indicator family aesthetics
📋 Status Dashboard: Quick visual confirmation of regime
🔧 Dual Analysis: Combines momentum oscillator with trend filter
🔄 Trading Strategies
1. Basic Momentum Strategy:
Go LONG when CMO crosses above MA
Go SHORT when CMO crosses below MA
Use extreme readings (>+80 or <-80) for overbought/oversold conditions
2. Momentum Strength Strategy:
Strong bullish: CMO > MA AND CMO > +50
Strong bearish: CMO < MA AND CMO < -50
Weak signals: Between -50 and +50
3. Divergence Detection:
Price makes higher high, CMO makes lower high → Bearish divergence
Price makes lower low, CMO makes higher low → Bullish divergence
📈 Performance Tips
Combine with Trend: Use in trending markets (avoid ranging periods)
Confirmation: Wait for candle close after MA crossover
Extreme Readings: +80/-80 often precede reversals
MA Selection: EMA for responsiveness, SMA for smoothness
Multiple Timeframes: Check higher timeframe CMO alignment
This enhanced CMO indicator provides professional-grade momentum analysis with intuitive visualization, allowing traders to quickly identify momentum regimes and strength while filtering out market noise through the customizable moving average filter! 📊🎯
