Crypto_in_details_MAlibCrypto_in_details_MaLib — Advanced Moving Average Library for Pine Script
Overview:
Crypto_in_details_MaLib is a comprehensive, performance-optimized Moving Average (MA) library designed specifically for Pine Script v6 users seeking advanced technical analysis tools. Developed by Crypto_in_details, this library consolidates the most popular and sophisticated MA calculation methods — including classical, weighted, exponential, and Hull variants — into one seamless package.
Key Features:
Implements a wide range of Moving Averages: SMA, EMA, WMA, RMA, VWMA, HMA, TEMA, EHMA, THMA.
Designed for precision and flexibility — suitable for diverse trading strategies and indicator development.
Fully typed functions compatible with Pine Script v6 standards.
Simplifies your scripting workflow by providing ready-to-use MA functions via clean and easy-to-import methods.
Well-documented and maintained by an experienced Pine Script developer.
Why Use Crypto_in_details_MaLib?
Gain access to advanced MA calculations that enhance trend analysis, smoothing, and signal accuracy.
Save time on coding complex moving averages from scratch.
Easily extend or combine with your own strategies or indicators for improved performance.
Rely on a tested and community-driven solution backed by a prolific Pine Script author.
Ideal for:
Traders and developers building custom indicators or strategies requiring versatile MA techniques.
Anyone looking to improve their Pine Script efficiency and code maintainability.
Pine Script enthusiasts wanting a professional-grade MA toolkit.
Cerca negli script per "rma"

Moving Average Candles**Moving Average Candles — MA-Based Smoothed Candlestick Overlay**
This script replaces traditional price candles with smoothed versions calculated using various types of moving averages. Instead of plotting raw price data, each OHLC component (Open, High, Low, Close) is independently smoothed using your selected moving average method.
---
### 📌 Features:
- Choose from 13 MA types: `SMA`, `EMA`, `RMA`, `WMA`, `VWMA`, `HMA`, `T3`, `DEMA`, `TEMA`, `KAMA`, `ZLEMA`, `McGinley`, `EPMA`
- Fully configurable moving average length (1–1000)
- Color-coded candles based on smoothed Open vs Close
- Works directly on price charts as an overlay
---
### 🎯 Use Cases:
- Visualize smoothed market structure more clearly
- Reduce noise in price action for better trend analysis
- Combine with other indicators or strategies for confluence
---
> ⚠️ **Note:** Since all OHLC values are based on moving averages, these candles do **not** represent actual market trades. Use them for trend and structure analysis, not trade entries based on precise levels.
---
*Created to support traders seeking a cleaner visual representation of price dynamics.*

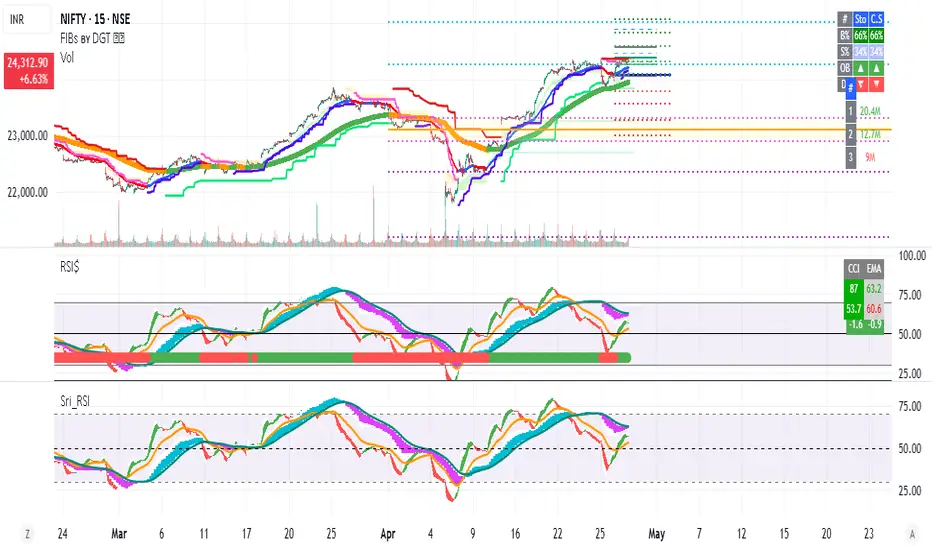
Stochastic XThe "Stochastic X" script is a customizable momentum oscillator designed to help traders identify potential overbought and oversold conditions, as well as trend reversals, by analyzing the relationship between a security's closing price and its price range over a specified period. This indicator is particularly useful for traders looking to fine-tune their entry and exit points based on momentum shifts.
🔧 Indicator Settings and Customization
The script offers several user-configurable settings to tailor the indicator to specific trading strategies:
In addition to the source type, %K Period, %D Period, and Signal line periods you can now change moving average calculation for the stochastic and signal lines.
This script allows selection among various moving average methods (e.g., SMA, EMA, WMA, T3) for smoothing the %K and signal lines. Different methods can affect the responsiveness of the indicator.
🎨 Interpreting Background Colors
The script enhances visual analysis by changing the background color of the indicator panel based on the %K line's value:
Green Background: Indicates that the %K line is above 50, suggesting bullish momentum.
Red Background: Signifies that the %K line is below 50, pointing to bearish momentum.
Light Green Overlay: Appears when the %K line exceeds 80, highlighting overbought conditions.
Light Red Overlay: Shows up when the %K line falls below 20, indicating oversold conditions.
These visual cues assist traders in quickly assessing market momentum and potential reversal.
📈 Trading Strategies Using Stochastic X
Traders can utilize the Stochastic X indicator in various ways:
Overbought/Oversold Conditions:
A %K value above 80 may suggest that the asset is overbought, potentially signaling a price correction.
A %K value below 20 could indicate that the asset is oversold, possibly leading to a price rebound.
Signal Line Crossovers:
When the %K line crosses above the signal line, it may be interpreted as a bullish signal.
Conversely, a %K line crossing below the signal line might be seen as a bearish signal.
Divergence Analysis:
If the price makes a new high while the %K line does not, this bearish divergence could precede a price decline.
If the price hits a new low but the %K line forms a higher low, this bullish divergence might signal an upcoming price increase.
Trend Confirmation:
Sustained %K values above 50 can confirm an uptrend.
Persistent %K values below 50 may validate a downtrend.
In this chart, observe how the background colors change in response to the %K line's value, providing immediate visual feedback on market conditions. The crossovers between the %K and signal lines offer potential entry and exit points, while the overbought and oversold overlays help identify possible reversal zones.
⚙️ Adjusting Settings for Optimal Use
The Stochastic X indicator's flexibility allows traders to adjust settings to match their trading style and the specific asset's behavior:
Short-Term Trading: Use shorter periods (e.g., 5 for %K) and more responsive moving averages (e.g., WMA, VWMA, EMA, DEMA, TEMA, HMA) to capture quick market movements.
Long-Term Trading: Opt for longer periods (e.g., 14 for %K) and smoother moving averages (e.g., SMA, RMA, T3) to filter out noise and focus on broader trends.
Volatile Markets: Consider using the T3 moving average for its smoothing capabilities, helping to reduce false signals in choppy markets.
By experimenting with different settings, traders can fine-tune the indicator to better suit their analysis and improve decision-making.

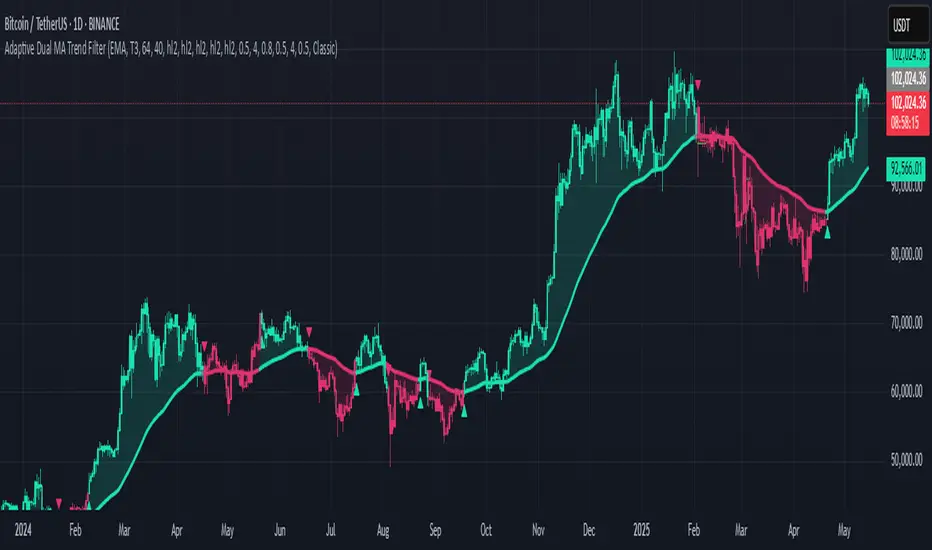
Adaptive Dual MA Trend FilterAdaptive Dual MA Trend Filter is a versatile Pine Script™ indicator that delivers clear, reliable trend signals using customizable moving averages:
Dual‑Stage Filtering – Apply any traditional MA (SMA, EMA, VWMA, HMA, RMA, TEMA, DEMA, FRAMA, TRIMA) or advanced smoothing (ALMA, T3) as your “main” and “filter” MAs. The filter MA is double‑smoothed for noise suppression, then converted into a robust “double‑filtered” baseline.
Flexible Inputs – Select lengths, sources (close, high, low, hl2), offsets, sigma, and volume factors to tailor the responsiveness and smoothness to your favorite timeframe or asset class.
Intuitive Signals – The script detects confirmed bullish (green) and bearish (red) trend shifts as:
Circle marker on the MA line
Triangle arrows below/above bars
Full candles and MA line colored by current trend
Clean Overlay – Works directly on your price chart, with optional semi‑transparent fills for extra visual clarity.
Theme Support – Choose from Vibrant, Pastel, Neon, Classic, Monochrome, Solarized, or Material palettes for seamless chart styling.
Ideal for swing traders and intraday scalpers alike, Multi‑Source Double‑Filter Trend offers both “set‑and‑forget” simplicity and deep customization for power users.
Usage
Add to chart → Inputs → tweak MA types/lengths
Watch for color changes and markers
Combine with volume or momentum filters for entry confirmation
Enjoy clearer trend identification and smoother trade signals!
Disclaimer
This script is for educational and informational purposes only. Not financial advice. Use at your own risk.
RCI Strategy [PineIndicators]RCI Strategy
This strategy leverages the Rank Correlation Index (RCI) — a statistical oscillator that measures the relationship between time and price rank — combined with a configurable moving average filter. It offers clean, rule-based entries and exits, and visually enhanced trade tracking via labeled markers and boxes on the chart.
The RCI Strategy is well-suited for momentum traders looking to capture directional shifts with confirmation through RCI smoothing.
Core Logic
1. Rank Correlation Index (RCI)
Measures how closely price changes correlate with time rankings.
Values range between -100 and +100.
Thresholds at ±80 help identify potential reversals or extremes.
2. RCI Smoothing via Moving Average
A moving average (MA) is applied to the RCI to smooth out fluctuations.
Supported MA types:
SMA
EMA
SMMA (RMA)
WMA
VWMA
Users can disable the smoothing by selecting "None".
Trade Entry Logic
Long Entry: RCI crosses above the selected moving average.
Short Entry: RCI crosses below the moving average.
Entries are restricted by trade direction settings:
Long Only
Short Only
Long & Short
Visual Features
RCI Panel Display
Plots RCI line and its moving average in a separate pane.
Horizontal guide lines at 0, +80, and -80 help visualize signal zones.
Trade Labels on Chart
Buy Label: Plotted when a long entry is executed.
Close Label: Plotted when any position is closed.
Triangle markers for visual emphasis on direction change.
Trade Visualization Boxes
A colored box is drawn between entry and exit prices.
Green = profitable trade; Red = losing trade.
Two horizontal lines connect entry and exit prices for reference.
Customization Parameters
RCI Source: Select input price for the RCI (default: close).
RCI Length: Set sensitivity of the oscillator.
MA Type and Length: Choose and configure the smoothing filter.
Trade Direction Mode: Define whether to allow Long, Short, or both.
Use Cases
Swing traders who want to trade directional reversals with statistical backing.
Traders seeking a clean and visual strategy based on rank momentum.
Environments where both trend and range dynamics occur.
Conclusion
The RCI Strategy is a non-repainting, rule-based trading model that combines rank correlation momentum with smoothed trend logic. Its clean visual markers, labeled trades, and flexible MA filters make it a valuable tool for discretionary and systematic traders alike.

Bollinger Bands x3 with Fill + HMA + Dynamic Width Colors📄 Description for TradingView Publication:
This is an enhanced and flexible version of the classic Bollinger Bands indicator, designed for traders who want deeper insight into market volatility and price structure.
🔹 Key Features:
✅ Triple Bollinger Bands
Displays 3 standard deviation bands: ±1σ, ±2σ, and ±3σ
Customize each deviation level independently
✅ Dynamic Band Width Coloring
Band lines change color when the distance between upper and lower bands narrows
Helps identify volatility contractions and potential squeeze setups
✅ Dynamic Fill Coloring
Fill between bands also changes color when the bands narrow
Visually highlights transitions from high to low volatility conditions
✅ Multiple Moving Average Options
Choose from:
Simple Moving Average (SMA)
Exponential Moving Average (EMA)
Smoothed Moving Average (SMMA / RMA)
Weighted Moving Average (WMA)
Volume-Weighted Moving Average (VWMA)
Hull Moving Average (HMA) for a smoother, more responsive central tendency
✅ Customization Options
Show/hide each band individually
Adjust standard deviation multipliers
Toggle fills between bands
Customize fill colors for normal and narrowing conditions
Offset option to shift all plots forward or backward
💡 Use Case Tips:
When all bands begin narrowing, it could signal an upcoming volatility expansion or breakout.
Use the ±3σ bands to gauge extreme price behavior, and ±1σ for short-term mean reversion.
Combine with price action, momentum, or volume for breakout confirmation.
🧰 Recommended For:
Volatility traders
Mean reversion strategies
Breakout traders
Trend confirmation and structure analysis

ATR Volatility giua64ATR Volatility giua64 – Smart Signal + VIX Filter
📘 Script Explanation (in English)
Title: ATR Volatility giua64 – Smart Signal + VIX Filter
This script analyzes market volatility using the Average True Range (ATR) and compares it to its moving average to determine whether volatility is HIGH, MEDIUM, or LOW.
It includes:
✅ Custom or preset configurations for different asset classes (Forex, Indices, Gold, etc.).
✅ An optional external volatility index input (like the VIX) to refine directional bias.
✅ A directional signal (LONG, SHORT, FLAT) based on ATR strength, direction, and external volatility conditions.
✅ A clean visual table showing key values such as ATR, ATR average, ATR %, VIX level, current range, extended range, and final signal.
This tool is ideal for traders looking to:
Monitor the intensity of price movements
Filter trading strategies based on volatility conditions
Identify momentum acceleration or exhaustion
⚙️ Settings Guide
Here’s a breakdown of the user inputs:
🔹 ATR Settings
Setting Description
ATR Length Number of periods for ATR calculation (default: 14)
ATR Smoothing Type of moving average used (RMA, SMA, EMA, WMA)
ATR Average Length Period for the ATR moving average baseline
🔹 Asset Class Preset
Choose between:
Manual – Define your own point multiplier and thresholds
Forex (Pips) – Auto-set for FX markets (high precision)
Indices (0.1 Points) – For index instruments like DAX or S&P
Gold (USD) – Preset suitable for XAU/USD
If Manual is selected, configure:
Setting Description
Points Multiplier Multiplies raw price ranges into useful units (e.g., 10 for Gold)
Low Volatility Threshold Threshold to define "LOW" volatility
High Volatility Threshold Threshold to define "HIGH" volatility
🔹 Extended Range and VIX
Setting Description
Timeframe for Extended High/Low Used to compare larger price ranges (e.g., Daily or Weekly)
External Volatility Index (VIX) Symbol for a volatility index like "VIX" or "EUVI"
Low VIX Threshold Below this level, VIX is considered "low" (default: 20)
High VIX Threshold Above this level, VIX is considered "high" (default: 30)
🔹 Table Display
Setting Description
Table Position Where the visual table appears on the chart (e.g., bottom_center, top_left)
Show ATR Line on Chart Whether to display the ATR line directly on the chart
✅ Signal Logic Summary
The script determines the final signal based on:
ATR being above or below its average
ATR rising or falling
ATR percentage being significant (>2%)
VIX being high or low
Conditions Signal
ATR rising + high volatility + low VIX LONG
ATR falling + high volatility + high VIX SHORT
ATR flat or low volatility or low %ATR FLAT

IU Mean Reversion SystemDESCRIPTION
The IU Mean Reversion System is a dynamic mean reversion-based trading framework designed to identify optimal reversal zones using a smoothed mean and a volatility-adjusted band. This system captures price extremes by combining exponential and running moving averages with the Average True Range (ATR), effectively identifying overextended price action that is likely to revert back to its mean. It provides precise long and short entries with corresponding exit conditions, making it ideal for range-bound markets or phases of low volatility.
USER INPUTS :
Mean Length – Controls the smoothness of the mean; default is 9.
ATR Length – Defines the lookback period for ATR-based band calculation; default is 100.
Multiplier – Determines how wide the upper and lower bands are from the mean; default is 3.
LONG CONDITION :
A long entry is triggered when the closing price crosses above the lower band, indicating a potential upward mean reversion.
A position is taken only if there is no active long position already.
SHORT CONDITION :
A short entry is triggered when the closing price crosses below the upper band, signaling a potential downward mean reversion.
A position is taken only if there is no active short position already.
LONG EXIT :
A long position exits when the high price crosses above the mean, implying that price has reverted back to its average and may no longer offer favorable long risk-reward.
SHORT EXIT :
A short position exits when the low price crosses below the mean, indicating the mean reversion has occurred and the downside opportunity has likely played out.
WHY IT IS UNIQUE:
Uses a double smoothing approach (EMA + RMA) to define a stable mean, reducing noise and false signals.
Adapts dynamically to volatility using ATR-based bands, allowing it to handle different market conditions effectively.
Implements a state-aware entry system using persistent variables, avoiding redundant entries and improving clarity.
The logic is clear, concise, and modular, making it easy to modify or integrate with other systems.
HOW USER CAN BENEFIT FROM IT :
Traders can easily identify reversion opportunities in sideways or mean-reverting environments.
Entry and exit points are visually labeled on the chart, aiding in clarity and trade review.
Helps maintain discipline and consistency by using a rule-based framework instead of subjective judgment.
Can be combined with other trend filters, momentum indicators, or higher time frame context for enhanced results.

Volume MAs Supertrend | Lyro RS📊 Volume MAs Supertrend | Lyro RS is an advanced trading tool that combines volume-adjusted moving averages with a dynamic Supertrend system. This indicator provides a robust framework for identifying market trends and entry/exit points.
✨ Key Features :
📈 Volume-Weighted Moving Averages (VWMA): Integrates price and volume data to provide a more accurate moving average, allowing for better trend analysis.
🔧 Multiple MA Types: Choose from SMA, EMA, WMA, VWMA, DEMA, TEMA, RMA, HMA, ALMA to suit your preferred trading strategy.
📊 Dual-Multiplier Supertrend System: Uses ATR to dynamically calculate upper and lower bands for long and short trends, with distinct multipliers for each.
🎨 Customizable Color Schemes: Choose from Classic, Mystic, Accented, and Royal color palettes or customize your own colors for bullish and bearish trends.
🔍 Visual Enhancements: Color-coded Supertrend lines, candlesticks, and bars for quick trend identification.
⏰ Alert System: Alerts for long and short signals based on trend changes.
🔧 How It Works :
The Supertrend line is calculated using ATR over a user-defined period, with separate multipliers for long and short positions.
📈 A bullish trend is signaled when the price crosses above the upper band, and a bearish trend is signaled when the price crosses below the lower band.
🎨 The Supertrend line changes color to reflect trend direction, with candlesticks and bars matching the trend's color for visual clarity.
⚙️ Customization Options :
🛠️ Moving Average Settings: Select your preferred moving average type (SMA, EMA, VWMA, etc.) and adjust the length for smoother or more responsive trend signals.
📐 Supertrend Parameters: Define the ATR period and adjust multipliers to fine-tune sensitivity for long and short signals.
🎨 Color Configuration: Choose from predefined color palettes or create your own custom scheme for trend signals.
📈 Use Cases :
✅ Confirm market trends before entering trades.
🚪 Identify potential entry/exit points as trend directions shift.
👀 Visually analyze market conditions with color-coded candlesticks and bars.
⚠️ Disclaimer :
This indicator should not be used as a standalone tool for making trading decisions. Always combine with other forms of analysis and risk management practices.

Heikinisi Candle (With MA + Smoothing + Buy/Sell with Cooldown)This custom Heikinisi Candle (With MA + Smoothing + Buy/Sell with Cooldown) indicator combines the advantages of Heikin-Ashi candles with the flexibility of multiple moving averages and smoothing options. The built-in buy/sell signals with cooldown functionality help traders avoid overtrading while capturing trend reversals and momentum shifts. Whether you're a day trader, swing trader, or long-term investor, this indicator offers powerful tools for analyzing price action and making informed trading decisions.
Note: Disable the regular candle to get better visualization.
Key Features:
Custom Heikin-Ashi Candles:
The core feature of this script is the Heikin-Ashi candles, which are known for smoothing price action and helping traders identify market trends more clearly.
Unlike traditional Heikin-Ashi, this version adjusts the Heikin-Ashi close based on specific price action patterns, including rejection signals and engulfing patterns.
The custom Heikin-Ashi open also incorporates momentum, adjusting dynamically based on recent price changes.
Price Action Measurements:
The indicator measures key price action components, including:
Body: The absolute difference between the open and close.
Candle Range: The total range from high to low.
Upper Wick: The distance from the highest price to the maximum of open or close.
Lower Wick: The distance from the lowest price to the minimum of open or close.
These measurements help detect bullish and bearish conditions, as well as price rejection signals.
Buy/Sell Signal Logic:
Buy Signal: Triggered when the Heikin-Ashi close is above the chosen moving average (MA1), with a cooldown period to avoid too frequent signals.
Sell Signal: Triggered when the Heikin-Ashi close falls below the MA1 after a buy signal has already been issued.
The cooldown period ensures that buy and sell signals are spaced apart by a specific number of bars, preventing excessive signal generation during periods of price consolidation.
Multiple Moving Averages (MA):
This script supports up to three customizable moving averages (MA1, MA2, MA3), each of which can be set to different types and lengths, including:
Simple Moving Average (SMA)
Exponential Moving Average (EMA)
Weighted Moving Average (WMA)
Volume Weighted Moving Average (VWMA)
Volume Weighted Moving Price (VWMP)
Least Squares Moving Average (LSMA)
Hull Moving Average (HMA)
Double Exponential Moving Average (DEMA)
Triple Exponential Moving Average (TEMA)
Users can adjust the length and type of each MA for tailored analysis.
Smoothing Options for MAs:
Users can smooth the output of MAs using various types of smoothing algorithms (SMA, EMA, LSMA, WMA, Gaussian) and a customizable length. This helps to reduce noise in the moving average lines and provides clearer signals.
Gaussian Filter (Advanced Smoothing):
A Gaussian Filter is available as a smoothing option for MAs. This filter reduces noise and makes the moving averages smoother, which can be particularly helpful in volatile or choppy markets.
Alerts and Visualization:
The script allows users to plot buy and sell signals on the chart with distinctive markers. A Buy Signal is shown below the bar with a lime green marker and text "Buy," while a Sell Signal is shown above the bar with a red marker and text "Sell."
Traders can also set up alerts based on the buy/sell signals to get notified in real time.
Indicator Configuration:
Heikin-Ashi Candle Configuration:
Automatically adjusts Heikin-Ashi candles based on rejection signals, engulfing patterns, and momentum. It uses custom formulas for the Heikin-Ashi open and close, making it more sensitive to price action than standard Heikin-Ashi candles.
Moving Averages (MA) Configuration:
You can select from multiple moving average types and lengths (MA1, MA2, MA3) for trend-following analysis.
Choose between SMA, EMA, WMA, VWMA, VWMP, LSMA, HMA, DEMA, and TEMA.
Smoothing Options:
Enable or disable smoothing for the moving averages.
Select from different smoothing types, including SMA, EMA, RMA, WMA, LSMA, and Gaussian.
Cooldown Period:
Control the number of bars that must pass before a new buy/sell signal is triggered. This cooldown period helps prevent excessive trading signals in quick succession.
How to Use:
Analyze Price Action with Heikin-Ashi Candles:
The custom Heikin-Ashi candles are ideal for spotting market trends, reversals, and price rejection. Use the candle patterns to gauge the market sentiment.
Use MAs for Trend Confirmation:
The moving averages (MA1, MA2, MA3) can help identify the prevailing trend. A price above a rising MA indicates an uptrend, while a price below a falling MA suggests a downtrend.
Trigger Buy and Sell Signals:
When the Heikin-Ashi close crosses above MA1, a buy signal is triggered.
When the Heikin-Ashi close crosses below MA1 after a buy signal, a sell signal is triggered.
The cooldown period ensures that signals are spaced out, preventing overtrading.
Use Smoothing for Clearer Signals:
If you are trading in a volatile market, you can use the smoothing options to make the MAs smoother and reduce noise.

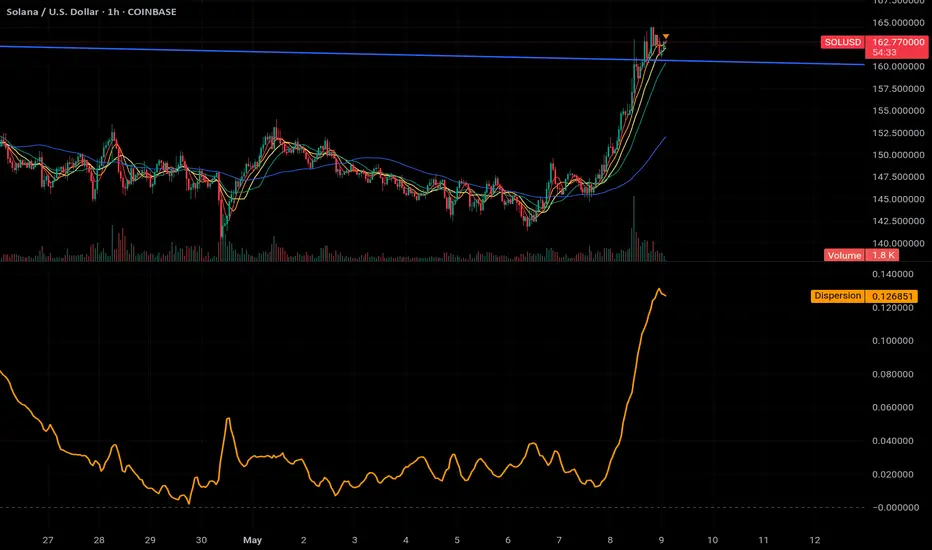
MA Dispersion+MA Dispersion+ — read the “breathing space” between your moving-averages
Get instant feedback on trend strength, volatility expansion and mean-reversion — across any timeframe.
MA Dispersion+ turns the humble moving-average stack into a single, easy-to-read oscillator that tells you at a glance whether price is coiling or fanning out.
🧩 What it does
Plugs into your favourite MA setup
• Pick the classic 5 / 20 / 50 / 200 lengths or disable any combination with one click.
• Choose the MA engine you trust — SMA, EMA, RMA, VWMA or WMA.
• Works on any timeframe thanks to TradingView’s security() engine.
Measures “spread”
For every bar it calculates the absolute distance of each selected MA from their average.
The tighter the stack, the lower the value; the wider the fan, the higher the value.
Adds professional-grade controls
• Weighting — let short-term MAs dominate (Inverse Length), keep everything equal, or dial in your own custom weights.
• Normalisation — convert the raw distance into a percentage of price, ATR multiples, or scale by the MAs’ own mean so you can compare symbols of any price or volatility.
🔍 How traders use it
Trend confirmation – rising dispersion while price breaks out = momentum is genuine.
Volatility squeeze – dispersion parking near zero warns that a big move is loading.
Multi-TF outlook – drop one pane per timeframe (e.g. 5 m, 1 h, 1 D) and see which layer of the market is driving.
Mean-reversion plays – spikes that fade quickly often coincide with exhaustion and snap-backs.
⚙️ Quick-start
Add MA Dispersion+ to your chart.
Set the pane’s timeframe in the first input.
Tick the MA lengths you actually use.
(Optional) Pick a weighting scheme and a normaliser.
Repeat the indicator for as many timeframes as you like — each instance keeps its own settings.
✨ Why you’ll love it
Zero clutter – one orange line tells you what four separate MAs whisper.
Configurable yet bullet-proof – all lengths are hard-coded constants, so Pine never complains.
Context aware – normalisation lets you compare BTC’s $60 000 chaos with EURUSD’s four--decimals calm.
Lightweight – no labels, no drawings, no background processing — perfect for mobile and multi-pane layouts.
Give MA Dispersion+ a try and let your charts breathe — you’ll never look at moving-average ribbons the same way again.
Happy trading!
Relative Strength Index with Percentile📈 Relative Strength Index with Percentile Rank (RSI + Percentile)
This advanced RSI indicator adds a powerful percentile ranking system to the classic Relative Strength Index, providing deeper insight into current RSI values relative to recent history.
🔍 Key Features:
Standard RSI Calculation: Identifies overbought/oversold levels using a customizable period.
RSI Percentile (0–100%): Calculates where the current RSI value stands within a user-defined lookback period.
Dynamic Background Coloring:
🟩 Green when RSI percentile is above 80% (strong relative strength)
🟥 Red when RSI percentile is below 20% (strong relative weakness)
Optional Divergence Detection: Spot classic bullish and bearish divergences between price and RSI.
Smoothing Options: Apply various moving averages (SMA, EMA, RMA, etc.) to the RSI, with optional Bollinger Bands.
Flexible Settings: Full control over lookback periods, smoothing type, and band sensitivity.
🧠 Why Use RSI Percentile?
Traditional RSI values can become less informative during trending markets. By ranking the RSI as a percentile, you gain contextual insight into whether the current strength is unusually high or low compared to recent history, rather than just a fixed 70/30 threshold.

Multitimeframe Order Block Finder (Zeiierman)█ Overview
The Multitimeframe Order Block Finder (Zeiierman) is a powerful tool designed to identify potential institutional zones of interest — Order Blocks — across any timeframe, regardless of what chart you're viewing.
Order Blocks are critical supply and demand zones formed by the last opposing candle before an impulsive move. These areas often act as magnets for price and serve as smart-money footprints — ideal for anticipating reversals, retests, or breakouts.
This indicator not only detects such zones in real-time, but also visualizes their mitigation, bull/bear volume pressure, and a smoothed directional trendline based on Order Block behavior.
█ How It Works
The script fetches OHLCV data from your chosen timeframe using request.security() and processes it using strict pattern logic and volume-derived strength conditions. It detects Order Blocks only when the structure aligns with dominant pressure and visually extends valid zones forward for as long as they remain unmitigated.
⚪ Bull/Bear Volume Power Visualization
Each OB includes proportional bars representing estimated buy/sell effort:
Buy Power: % of volume attributed to buyers
Sell Power: % of volume attributed to sellers
This adds a visual, intuitive layer of intent — showing who controlled the price before the OB formed.
⚪ Order Block Trendline (Butterworth Filtered)
A smoothed trendline is derived from the average OB value over time using a two-pole Butterworth low-pass filter. This helps you understand the broader directional pressure:
Trendline up → favor bullish OBs
Trendline down → favor bearish OBs
█ How to Use
⚪ Trade From Order Blocks Like Institutions
Use this tool to find institutional footprints and reaction zones:
Enter at unmitigated OBs
⚪ Volume Power
Volume Pressure Bars inside each OB help you:
Confirm strong buyer/seller dominance
Detect possible traps or exhaustion
Understand how each zone formed
⚪ Find Trend & Pullbacks
The trendline not only helps traders detect the current trend direction, but the built-in trend coloring also highlights potential pullback areas within these trends.
█ Settings
Timeframe – Selects which timeframe to scan for Order Blocks.
Lookback Period – Defines how many bars back are used to detect bullish or bearish momentum shifts.
Sensitivity – When enabled, the indicator uses smoothed price (RMA) with rising/falling logic instead of raw candle closes. This allows more flexible detection of trend shifts and results in more Order Blocks being identified.
Minimum Percent Move – Filters out weak moves. Higher = only strong price shifts.
Mitigated on Mid – OB is removed when price touches its midpoint.
Show OB Table – Displays a panel listing all active (unmitigated) Order Blocks.
Extend Boxes – Controls how far OB boxes stretch into the future.
Show OB Trend – Toggles the trendline derived from Order Block strength.
Passband Ripple (dB) – Controls trendline reactivity. Higher = more sensitive.
Cutoff Frequency – Controls smoothness of trendline (0–0.5). Lower = smoother.
-----------------
Disclaimer
The content provided in my scripts, indicators, ideas, algorithms, and systems is for educational and informational purposes only. It does not constitute financial advice, investment recommendations, or a solicitation to buy or sell any financial instruments. I will not accept liability for any loss or damage, including without limitation any loss of profit, which may arise directly or indirectly from the use of or reliance on such information.
All investments involve risk, and the past performance of a security, industry, sector, market, financial product, trading strategy, backtest, or individual's trading does not guarantee future results or returns. Investors are fully responsible for any investment decisions they make. Such decisions should be based solely on an evaluation of their financial circumstances, investment objectives, risk tolerance, and liquidity needs.

6 Moving Averages Difference TableIndicator Summary: 6 Moving Averages Difference Table (6MADIFF)
This TradingView indicator calculates and plots up to six distinct moving averages (MAs) directly on the price chart. Users have extensive control over each MA, allowing selection of:
Type: SMA, EMA, WMA, VWMA, HMA, RMA
Length: Any positive integer
Color: User-defined
Visibility: Can be toggled on/off
A core feature is the on-chart data table, designed to provide a quick overview of the relationships between the MAs and the price. This table displays:
$-MA Column: The absolute difference between the user-selected Input Source (e.g., Close, Open, HLC3) and the current value of each MA.
MA$ Column: The actual calculated price value of each MA for the current bar.
MA vs. MA Matrix: A grid showing the absolute difference between every possible pair of the calculated MAs (e.g., MA1 vs. MA2, MA1 vs. MA3, MA2 vs. MA5, etc.).
Customization Options:
Input Source: Select the price source (Open, High, Low, Close, HL2, HLC3, OHLC4) used for all MA calculations and the price difference column.
Table Settings: Control the table's visibility, position on the chart, text size, decimal precision for displayed values, and the text used for the column headers ("$-MA" and "MA$").
Purpose:
This indicator is useful for traders who utilize multiple moving averages in their analysis. The table provides an immediate, quantitative snapshot of:
How far the current price is from each MA.
The exact value of each MA.
The spread or convergence between different MAs.
This helps in quickly assessing trend strength, potential support/resistance levels based on MA clusters, and the relative positioning of short-term versus long-term averages.

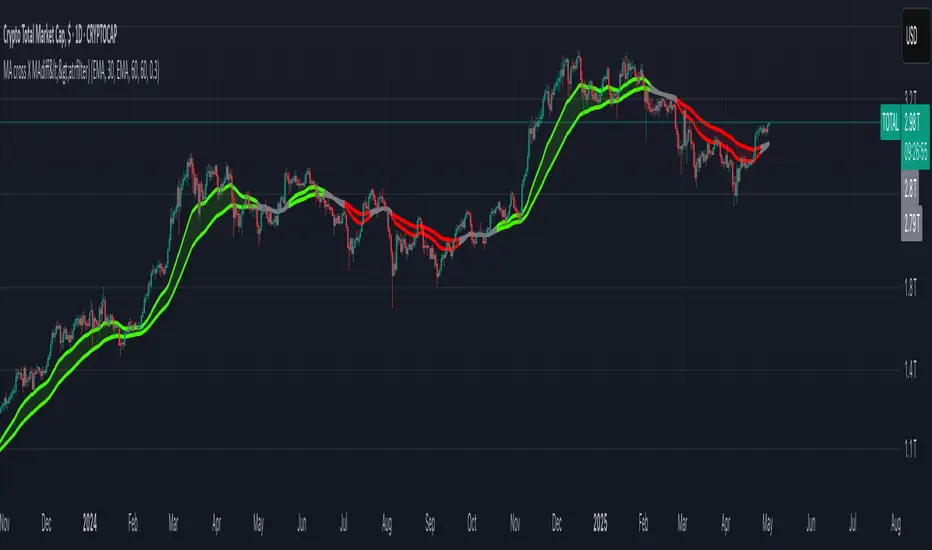
MA cross X MAdiff<>atrfilter)📈 MA cross X MAdiff<>ATR filter
Smarter Trend Confirmation Using Adaptive Volatility Thresholds
🔍 What It Does
This indicator upgrades classic moving average crossovers by adding volatility awareness via ATR filtering. Instead of reacting to every small crossover, it waits for the distance between two moving averages to exceed a volatility-adjusted threshold, making signals more meaningful and less noisy.
⚙️ Core Logic
Calculates the difference between a Fast MA and a Slow MA.
Uses Average True Range (ATR) as a dynamic volatility filter.
Confirms trend only when MA difference exceeds:
diff > ATR × multiplier → Bullish
diff < -ATR × multiplier → Bearish
Otherwise: Neutral (gray zone)
The gray zone avoids false signals by detecting indecision or choppy markets.
🧠 Customizable Inputs
Choose any MA type independently for Fast and Slow:
SMA, EMA, WMA, VWMA, RMA, DEMA, TEMA, LSMA, Kijun
Control sensitivity via:
ATR Length
ATR Multiplier
✅ Why It Works
Reduces fake outs in ranging markets.
Adapts to volatility automatically.
Fully customizable for any asset or style.
Ideal for trend traders, momentum entries, or as a confluence layer.
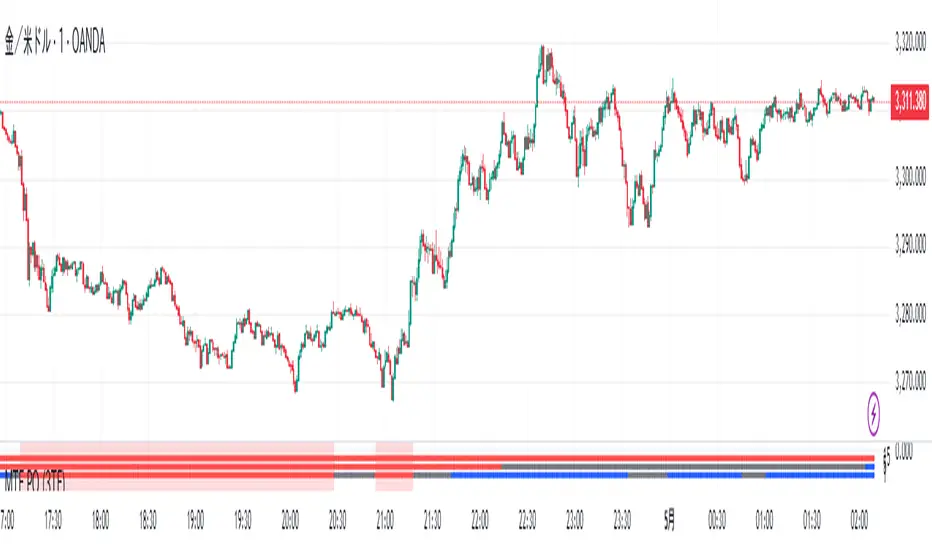
MTF PO (3TF)Title: SmartMA Multi-Timeframe Signal Strategy
Description (English):
This indicator provides buy/sell signals based on a multi-timeframe adaptive moving average. It allows traders to align short-term entries with higher time-frame trends. The script integrates a trend-following logic that reacts to price crossovers and adaptive MA slope, helping traders reduce noise and improve entry precision.
概要(日本語)
このインジケーターは、複数時間足の適応型移動平均線(SmartMA)を用いて売買シグナルを生成します。下位足でのエントリーが、上位足のトレンドと一致するよう設計されており、ノイズの除去とトレード精度の向上に貢献します。価格のクロスとMAの傾きを用いたトレンドフォロー型ロジックを搭載しています。
特徴
上位時間足の移動平均(SmartMA)と価格のクロスを検出
傾きフィルターによるトレンド整合性チェック
上位足に合わせて下位足のシグナルを制限
チャート上にシンプルなBuy/Sellラベルを表示
EMA, SMA, RMAなどのカスタム選択が可能
使用方法
チャートにインジケーターを追加し、上位足(例:1時間)と現在の時間足(例:5分)を設定
トレンド方向に沿ったタイミングでエントリーを検討
複数フィルターを用いることで、レンジ相場での誤認識を回避可能
注意事項
本インジケーターは補助的な分析ツールです。過去のパフォーマンスが将来を保証するものではありません。
スクリプトは再描画しない設計ですが、時間足の切り替え等で見た目が変わる可能性があります。
戦略構築には他のリスク管理指標との併用を推奨します。
Fibonacci - RSI OscillatorIndicator Overview
The Fibonacci RSI Oscillator calculates the Relative Strength Index (RSI) based on a dynamically adjusting level derived from recent price action and a fixed Fibonacci ratio (0.236). This differs from standard RSI, which is calculated directly on the closing price. The objective is to measure momentum relative to a level that adapts to recent peaks and valleys.
Core Calculation Mechanism
Peak/Valley Tracking: The script identifies the highest high (state_peak) and lowest low (state_valley) since the last detected change in short-term directional bias (state_dir).
Dynamic Level Calculation: A level (state_dyn_level) is calculated using a fixed 0.236 Fibonacci ratio relative to the tracked peak and valley:
If bias is up: state_dyn_level = state_peak - (state_peak - state_valley) * 0.236
If bias is down: state_dyn_level = state_valley + (state_peak - state_valley) * 0.236
This level adjusts automatically when a new peak or valley is established in the current directional bias. If price crosses the dynamic level against the current bias, the bias flips, and the level recalculates.
Optional Source Smoothing: The calculated state_dyn_level can optionally be smoothed using a user-selected moving average (SMA, EMA, WMA, HMA, RMA) before the RSI calculation.
RSI Calculation: The standard RSI formula is applied to the (optionally smoothed) state_dyn_level series to produce the primary oscillator value (val_primary_osc).
Signal Line: A moving average (type and length configurable) is calculated on the val_primary_osc to generate the val_sig_line.
Key Features & Components
Dynamic Fibonacci Level: The core input for the RSI calculation, based on recent peaks/valleys and the 0.236 ratio.
Fibonacci Level RSI: The primary oscillator line representing the RSI of the dynamic level.
Signal Line: A moving average of the primary RSI line.
Overbought/Oversold Levels: User-defined threshold lines.
Optional Source Smoothing: Configurable MA smoothing applied to the dynamic level before RSI calculation.
Gradient RSI Color : Option to color the primary RSI line based on its value relative to OB/Mid/OS levels.
Zone & OB/OS Fills: Visual fills for the 0-50 / 50-100 zones and specific fills when the RSI enters OB/OS territory.
Background Gradient: Optional vertical background color gradient based on the RSI's position between 0 and 100.
Configurable Parameters: Inputs for lengths, MA types, OB/OS levels, colors, line widths, and feature toggles.
Visual Elements Explained
Fibonacci Level RSI Line: The main plotted oscillator (color/gradient/width configurable).
Signal Line: The moving average of the RSI line (color/width/MA type configurable).
OB/OS Lines: Horizontal lines plotted at the set OB/OS levels (color/width configurable).
Mid-Line (50): Horizontal line plotted at 50 (color/width configurable).
Zone Fills:
Background fill between 0-50 and 50-100 (colors configurable).
Conditional fill between the RSI line and the 50 line when RSI > OB level or RSI < OS level (colors configurable).
Background Gradient: Optional background coloring where transparency varies vertically with the RSI level (base colors and transparency range configurable).
Configuration Options
Users can adjust the following parameters in the indicator settings:
Smoothing: Enable/disable dynamic level smoothing; set length and MA type.
RSI: Set the RSI calculation length.
Signal Line: Set the signal line smoothing length and MA type.
Levels: Define Overbought and Oversold numeric thresholds.
Visuals: Configure colors and widths for the RSI line, signal line, OB/OS lines, mid-line, zone fills, and OB/OS fills.
Gradients: Enable/disable and configure colors for the RSI line gradient; enable/disable and configure colors/transparency for the background gradient.
Interpretation Notes
The oscillator reflects the momentum of the dynamic Fibonacci level, not directly the price. Divergences, OB/OS readings, and signal line crossovers should be interpreted in this context.
The behavior may differ from standard RSI, potentially offering a smoother output or highlighting different momentum patterns depending on market structure and volatility.
As with any indicator, signals should be used in conjunction with other analysis methods and risk management practices. It is not designed as a standalone trading system.
Risk Disclaimer:
Trading involves significant risk. This indicator is provided for analytical purposes only and does not constitute financial advice. Past performance is not indicative of future results. Use sound risk management practices and never trade with capital you cannot afford to lose.

RSI_Heikinashi📜 Title:
Heikin-Ashi RSI Candle Plot with Multi-Timeframe Analysis and EMA Overlay
📖 Full Description:
This is an original custom indicator that transforms the traditional Relative Strength Index (RSI) into a Heikin-Ashi (HA) candle representation, allowing traders to visualize RSI trends with greater clarity, less noise, and multi-timeframe perspective.
🛠️ Core Concept and Original Method:
Rather than plotting a single RSI line, this script recalculates RSI into a Heikin-Ashi candle format, using a double EMA smoothing method on the RSI data itself.
Here's how the transformation works:
RSI Calculation:
RSI is computed traditionally using Wilder's Moving Average (RMA) for smoothing gains and losses.
The RSI period and price source are fully customizable (default length = 28, source = close).
Heikin-Ashi Style Smoothing (applied to RSI):
The HA Close is calculated as the EMA of the average between the current RSI and previous HA Close.
The HA Open is calculated as the EMA of the average between the previous HA Open and the current HA Close.
The HA High and HA Low are dynamically calculated based on the maximum/minimum values of the current RSI, HA Open, and HA Close.
Smoothing is done via 5-period EMA, which adds a unique layer of trend smoothing without traditional price-based HA calculation.
Multi-Timeframe Comparison:
In addition to plotting the chart timeframe HA RSI, the indicator retrieves the 1-hour timeframe HA RSI using request.security.
This allows traders to align trades with higher timeframe RSI trends, a powerful technique for multi-timeframe confirmation.
50 EMA Overlay:
A 50-period Exponential Moving Average (EMA) is plotted over both the chart timeframe HA RSI and the 1-hour HA RSI.
EMA acts as a trend filter or dynamic support/resistance for RSI behavior.
RSI Bands and Visual Aids:
Standard RSI bands at 70 (Overbought), 50 (Midline), and 30 (Oversold) are plotted.
A shaded background between the 30–70 levels helps highlight RSI range-bound movements versus breakout momentum.
🔥 Why this script is original and useful:
Unique Application:
This is not a simple RSI plot or standard Heikin-Ashi candle — it is a specialized smoothing method applied directly to RSI values for a clearer, noise-reduced momentum reading.
Multi-Timeframe Advantage:
Unlike typical RSI indicators, it includes a 1-hour timeframe comparison alongside the chart timeframe, improving decision-making across intraday and swing strategies.
Advanced Smoothing Logic:
Double EMA smoothing of RSI and HA-style recalculations offer a much smoother signal than traditional RSI or basic RSI/EMA crossovers.
Visualized Trend Strength:
Using colored candles instead of just a line enhances readability and gives an intuitive sense of momentum direction, strength, and possible reversals.
Fully Customizable:
Traders can adjust the RSI period and source depending on asset volatility or timeframe preferences.
📋 How to Use:
Look for HA RSI candles color changes for early momentum shifts.
Use the 50 EMA crossovers on HA RSI to confirm larger trend changes.
Compare chart timeframe vs 1H timeframe HA RSI for stronger signal alignment.
Watch for overbought/oversold breaks beyond the 70/30 bands for trade entries or exits.
⚙️ Inputs:
RSI Length (Default: 28)
RSI Source (Default: Close)
📢 Important Note:
This script is originally conceptualized and custom-built.
It is not a mashup of existing open-source indicators and introduces a new smoothing technique for RSI visualization.
🙏 Credits:
Script developed by Sri_RSI.
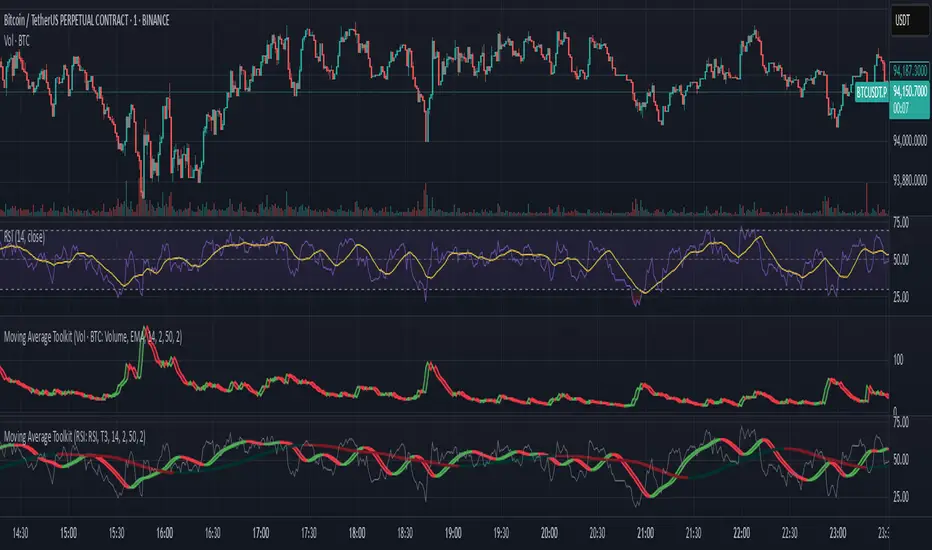
Moving Average ToolkitMoving Average Toolkit - Advanced MA Analysis with Flexible Source Input
A powerful and versatile moving average indicator designed for maximum flexibility. Its unique source input feature allows you to analyze moving averages of ANY indicator or price data, making it perfect for creating custom combinations with RSI, Volume, OBV, or any other technical indicator.
Key Features:
• Universal Source Input:
- Analyze moving averages of any data: Price, Volume, RSI, MACD, Custom Indicators
- Perfect for creating advanced technical setups
- Identify trends in any technical data
• 13 Moving Average Types:
- Traditional: SMA, EMA, WMA, RMA, VWMA
- Advanced: HMA, T3, DEMA, TEMA, KAMA, ZLEMA, McGinley, EPMA
• Dual MA System:
- Compare two different moving averages
- Independent settings for each MA
- Perfect for multiple timeframe analysis
• Visual Offset Analysis:
- Dynamic color changes based on momentum
- Fill between current and offset values
- Clear visualization of trend strength
Usage Examples:
• Price Trend: Traditional MA analysis using price data
• Volume Trend: Apply MA to volume for volume trend analysis
• RSI Trend: Smooth RSI movements for clearer signals
• Custom: Apply to any indicator output for unique insights
Settings:
• Fully customizable colors for bull/bear conditions
• Adjustable offset periods
• Independent length settings
• Optional second MA for comparison
Perfect for:
• Advanced technical analysts
• Multi-indicator strategy developers
• Custom indicator creators
• Traders seeking flexible analysis tools
This versatile toolkit goes beyond traditional moving averages by allowing you to apply sophisticated MA analysis to any technical data, creating endless possibilities for custom technical analysis strategies.
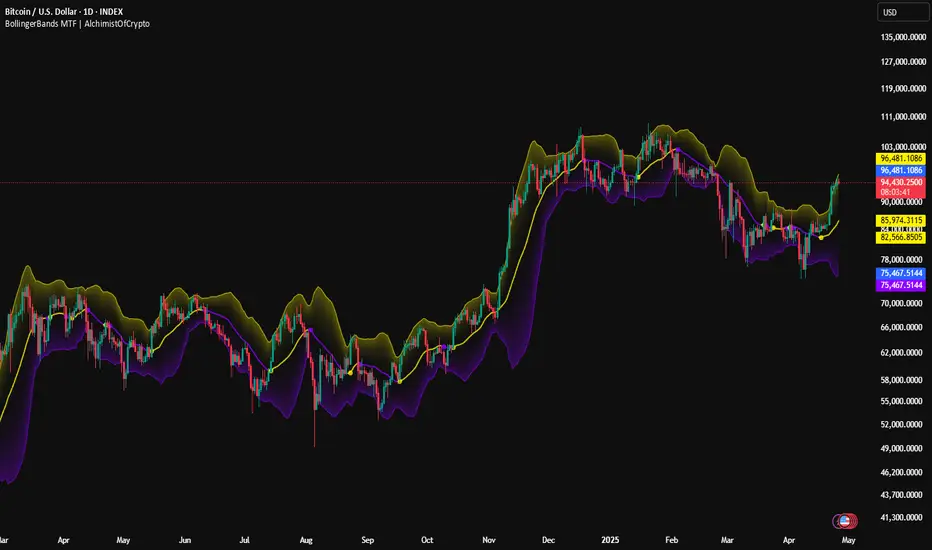
BollingerBands MTF | AlchimistOfCrypto🌌 Bollinger Bands – Unveiling Market Volatility Fields 🌌
"The Bollinger Bands, reimagined through quantum mechanics principles, visualizes the probabilistic distribution of price movements within a multi-dimensional volatility field. This indicator employs principles from wave function mathematics where standard deviation creates probabilistic boundaries, similar to electron cloud models in quantum physics. Our implementation features algorithmically enhanced visualization derived from extensive mathematical modeling, creating a dynamic representation of volatility compression and expansion cycles with adaptive glow effects that highlight the critical moments where volatility phase transitions occur."
📊 Professional Trading Application
The Bollinger Bands Quantum transcends traditional volatility measurement with a sophisticated gradient illumination system that reveals the underlying structure of market volatility fields. Scientifically calibrated for multiple timeframes and featuring eight distinct visual themes, it enables traders to perceive volatility contractions and expansions with unprecedented clarity.
⚙️ Indicator Configuration
- Volatility Field Parameters 📏
Python-optimized settings for specific market conditions:
- Period: 20 (default) - The quantum time window for volatility calculation
- StdDev Multiplier: 2.0 - The probabilistic boundary coefficient
- MA Type: SMA/EMA/VWMA/WMA/RMA - The quantum field smoothing algorithm
- Visual Theming 🎨
Eight scientifically designed visual palettes optimized for volatility pattern recognition:
- Neon (default): High-contrast green/red scheme enhancing volatility transition visibility
- Cyan-Magenta: Vibrant palette for maximum volatility boundary distinction
- Yellow-Purple: Complementary colors for enhanced compression/expansion detection
- Specialized themes (Green-Red, Forest Green, Blue Ocean, Orange-Red, Grayscale): Each calibrated for different market environments
- Opacity Control 🔍
- Variable transparency system (0-100) allowing seamless integration with price action
- Adaptive glow effect that intensifies during volatility phase transitions
- Quantum field visualization that reveals the probabilistic nature of price movements
🚀 How to Use
1. Select Visualization Parameters ⏰: Adjust period and standard deviation to match market conditions
2. Choose MA Type 🎚️: Select the appropriate smoothing algorithm for your trading strategy
3. Select Visual Theme 🌈: Choose a color scheme that enhances your personal pattern recognition
4. Adjust Opacity 🔎: Fine-tune visualization intensity to complement your chart analysis
5. Identify Volatility Phases ✅: Monitor band width to detect compression (pre-breakout) and expansion (trend)
6. Trade with Precision 🛡️: Enter during band contraction for breakouts, or trade mean reversion using band boundaries
7. Manage Risk Dynamically 🔐: Use band width as volatility-based position sizing parameter
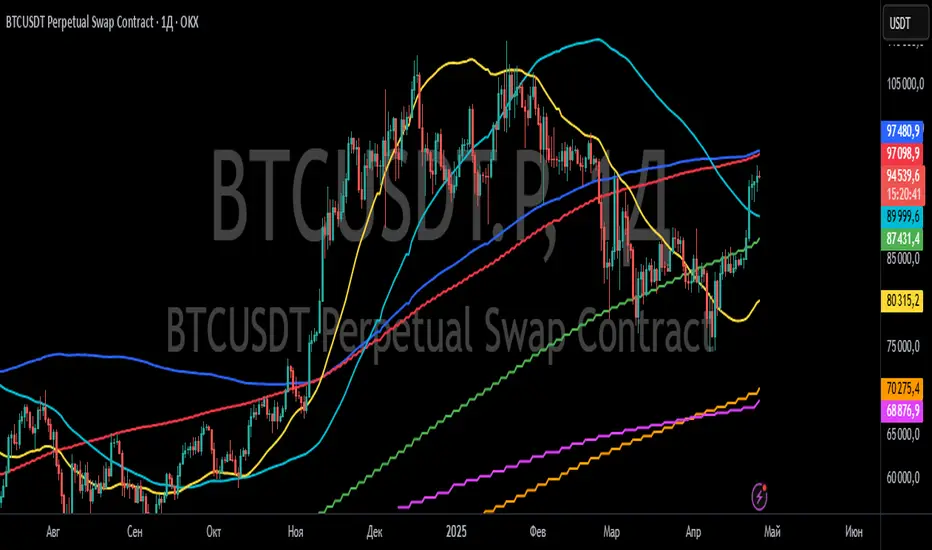
Event-Based Multi MA v1.1📈 Event-Based Multi MA v1.1 — Smart Trading with Dynamic MA Updates
Overview
In a world where most moving averages blindly follow every candle, Event-Based Multi MA v1.1 introduces a smarter logic:
➡️ Update moving averages only when significant price movements occur.
Forget the noise. Focus on what's important.
This indicator recalculates your moving averages only after meaningful price shifts, allowing you to spot true trends and avoid market whipsaws.
Key Features
✅ Event-Driven Logic
Set events based on:
Points: Absolute price change
Percent: Relative price movement
ATR: Volatility-adjusted dynamic movement
✅ Seven Fully Customizable Moving Averages (MA1–MA7)
Each MA offers:
Custom timeframe
Selection of types (EMA, SMA, WMA, VWMA, HMA, LSMA, DEMA, TEMA, ALMA, RMA)
Adjustable lengths and colors
✅ Reduced Market Noise
MAs adjust only after important price actions — cutting down lag and false signals.
✅ Multi-Timeframe Analysis
You can blend moving averages from different timeframes (e.g., 15m, 1H, Daily) into a single chart — perfect for professional multi-frame strategy building.
Settings Explained
Event Trigger Type: Select Points, Percent, or ATR-based movement.
Event Threshold: The amount of price movement needed to trigger a new calculation.
ATR Length: If ATR mode is selected, this controls the sensitivity.
Each Moving Average (MA1 to MA7) has:
MA Type: Choose the smoothing method that suits your trading style.
Length: The number of bars used in the calculation.
Color: Customize visual styling.
Timeframe: Load MAs from different timeframes into your current chart.
How to Use It in Trading
🔹 Trend Confirmation
Wait for event-triggered updates. Fresh MAs after a significant move are much stronger signals than constantly refreshing MAs.
🔹 Momentum Breakouts
Combine short-term (e.g., MA1, MA2) and long-term (e.g., MA5, MA6) MAs. When short-term MAs cross above/below long-term after an event, it's a powerful breakout cue.
🔹 Dynamic Support/Resistance
Use slow-moving MAs like 100-200 length across different timeframes.
The event-based recalculation keeps them relevant to recent major price moves.
🔹 Volatility Filters
Switch to ATR-based events to adapt moving average updates during volatile periods and calm markets.
Why It Beats Traditional Moving Averages
🚀 No More Overfitting to Every Candle
You focus only on impactful price changes.
🚀 Multi-Timeframe Flexibility
Blend micro and macro views seamlessly in one chart.
🚀 Cleaner Signals, Less Noise
Event-triggered recalculations filter out useless minor price wobbles.
🚀 Customization Beyond Standard MAs
TEMA, HMA, ALMA, DEMA, VWMA — all included for ultra-fine-tuned strategies.
✨ Ready to Upgrade Your Trading?
Forget the old, slow MAs.
Use intelligence. Trade events, not noise.
→ Add Event-Based Multi MA v1.1 to your chart and experience true precision!
ONE RING 8 MA Bands with RaysCycle analysis tool ...
MAs: Eight moving averages (MA1–MA8) with customizable lengths, types (RMA, WMA, EMA, SMA), and offsets
Bands: Upper/lower bands for each MA, calculated based on final_pctX (Percentage mode) or final_ptsX (Points mode), scaled by multiplier
Rays: Forward-projected lines for bands, with customizable start points, styles (Solid, Dashed, Dotted), and lengths (up to 500 bars)
Band Choices
Manual: Uses individual inputs for band offsets
Uniform: Sets all offsets to base_pct (e.g., 0.1%) or base_pts (e.g., 0.1 points)
Linear: Scales linearly (e.g., base_pct * 1, base_pct * 2, base_pct * 3 ..., base_pct * 8)
Exponential: Scales exponentially (e.g., base_pct * 1, base_pct * 2, base_pct * 4, base_pct * 8 ..., base_pct * 128)
ATR-Based: Offsets are derived from the Average True Range (ATR), scaled by a linear factor. Dynamic bands that adapt to market conditions, useful for breakout or mean-reversion strategies. (final_pct1 = base_pct * atr, final_pct2 = base_pct * atr * 2, ..., final_pct8 = base_pct * atr * 8)
Geometric: Offsets follow a geometric progression (e.g., base_pct * r^0, base_pct * r^1, base_pct * r^2, ..., where r is a ratio like 1.5) This is less aggressive than Exponential (which uses powers of 2) and provides a smoother progression.
Example: If base_pct = 0.1, r = 1.5, then final_pct1 = 0.1%, final_pct2 = 0.15%, final_pct3 = 0.225%, ..., final_pct8 ≈ 1.71%
Harmonic: Offsets are based on harmonic flavored ratios. final_pctX = base_pct * X / (9 - X), final_ptsX = base_pts * X / (9 - X) for X = 1 to 8 This creates a harmonic-like progression where offsets increase non-linearly, ensuring MA8 bands are wider than MA1 bands, and avoids duplicating the Linear choice above.
Ex. offsets for base_pct = 0.1: MA1: ±0.0125% (0.1 * 1/8), MA2: ±0.0286% (0.1 * 2/7), MA3: ±0.05% (0.1 * 3/6), MA4: ±0.08% (0.1 * 4/5), MA5: ±0.125% (0.1 * 5/4), MA6: ±0.2% (0.1 * 6/3), MA7: ±0.35% (0.1 * 7/2), MA8: ±0.8% (0.1 * 8/1)
Square Root: Offsets grow with the square root of the band index (e.g., base_pct * sqrt(1), base_pct * sqrt(2), ..., base_pct * sqrt(8)). This creates a gradual widening, less aggressive than Linear or Exponential. Set final_pct1 = base_pct * sqrt(1), final_pct2 = base_pct * sqrt(2), ..., final_pct8 = base_pct * sqrt(8).
Example: If base_pct = 0.1, then final_pct1 = 0.1%, final_pct2 ≈ 0.141%, final_pct3 ≈ 0.173%, ..., final_pct8 ≈ 0.283%.
Fibonacci: Uses Fibonacci ratios (e.g., base_pct * 1, base_pct * 1.618, base_pct * 2.618
Percentage vs. Points Toggle:
In Percentage mode, bands are calculated as ma * (1 ± (final_pct / 100) * multiplier)
In Points mode, bands are calculated as ma ± final_pts * multiplier, where final_pts is in price units.
Threshold Setting for Slope:
Threshold setting for determining when the slope would be significant enough to call it a change in direction. Can check efficiency by setting MA1 to color on slope temporarily
Arrow table: Shows slope direction of 8 MAs using an Up or Down triangle, or shows Flat condition if no triangle.

LinReg Heikin Ashi CandlesLinear Regression Heikin Ashi Candles will dramatically change how the candlesticks on your chart will appear. This script creates Heikin Ashi candles from the existing candlesticks and then applies wickless Linear Regression candles as an overlay. The result is an ultra smoothed 'Renko-like' chart that remains time-based and responsive.
Key Features:
Heikin Ashi Base: Provides a smoother representation of price trends by filtering out noise.
Linear Regression Candles on Heikin Ashi: Plots Linear Regression lines as candles on the Heikin Ashi chart, potentially highlighting the immediate trend direction and momentum within the smoothed data. Wicks are intentionally removed for a clearer focus on the linear progression.
Tillson T3 Moving Averages: Includes fast and slow T3 Moving Averages with customizable length and alpha. These smoothed moving averages can help identify trend direction and potential crossover signals. Users can toggle their visibility.
Volatility Bands: Integrates Volatility Bands based on Average True Range (ATR) with customizable length, ATR type (RMA, SMA, EMA, WMA), and inner/outer multipliers. These bands help gauge price volatility and potential reversal zones. Users can toggle the visibility of the basis line.
Customizable Colors: Allows users to customize the colors of the Linear Regression Heikin Ashi bullish and bearish candles.
How to Use:
This is an overlay on your chart so you'll need to 'hide' the existing candlesticks on your chart.
This indicator can be used on any timeframe from seconds to days to quickly identify market trend, gauge volatility, and potentially find entry/exit points. Consider looking for confluence between the candle color/direction, T3 MA crossovers, and price interaction with the Volatility Bands.
Note: This indicator plots Linear Regression directly on Heikin Ashi candles, removing wicks for a focus on the linear trend within the smoothed data. Adjust the input parameters to suit your trading style and the specific market conditions.
HUGE CREDIT to ugurvu who originally created the Linear Regression Candles indicator that my indicator pulls code from.
