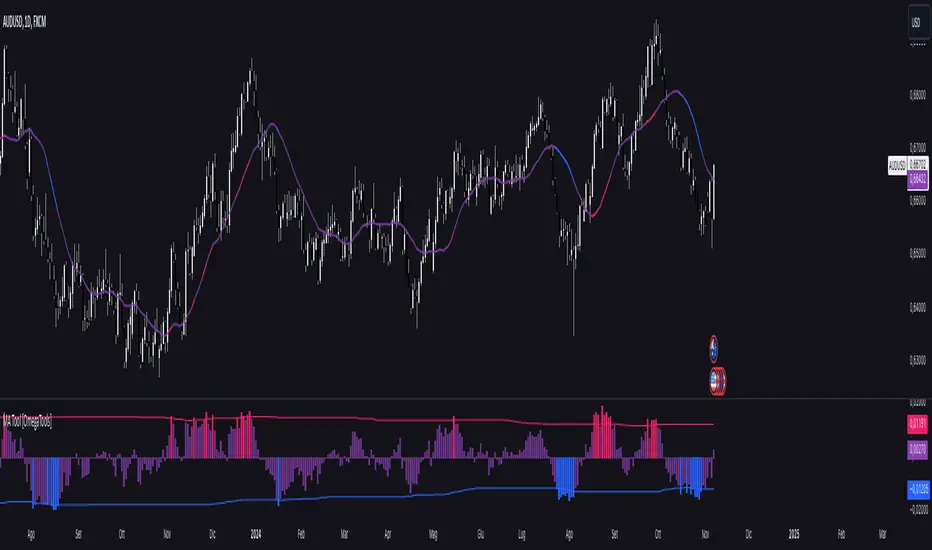
Moving Average Simple Tool [OmegaTools]This TradingView script is a versatile Moving Average Tool that offers users multiple moving average types and a customizable overbought and oversold (OB/OS) sensitivity feature. It is designed to assist in identifying potential price trends, reversals, and momentum by using different average calculations and providing visual indicators for deviation levels. Below is a detailed breakdown of the settings, functionality, and visual elements within the Moving Average Simple Tool.
Indicator Overview
Indicator Name: Moving Average Simple Tool
Short Title: MA Tool
Purpose: Provides a choice of six moving average types with configurable sensitivity, which helps traders identify trend direction, potential reversal zones, and overbought or oversold conditions.
Input Parameters
Source (src): This option allows the user to select the data source for the moving average calculation. By default, it is set to close, but users can choose other options like open, high, low, or any custom price data.
Length (lnt): Defines the period length for the moving average. By default, it is set to 21 periods, allowing users to adjust the moving average sensitivity to either shorter or longer periods.
Average Type (mode): This input defines the moving average calculation type. Six types of averages are available:
SMA (Simple Moving Average)
EMA (Exponential Moving Average)
WMA (Weighted Moving Average)
VWMA (Volume-Weighted Moving Average)
RMA (Rolling Moving Average)
Middle Line: Calculates the average between the highest and lowest price over the period specified in Length. This is useful for a mid-range line rather than a traditional moving average.
Sensitivity (sens): This parameter controls the sensitivity of the overbought and oversold levels. The sensitivity value can range from 1 to 40, where a lower value represents a higher sensitivity and a higher value allows for smoother OB/OS zones.
Color Settings:
OS (Oversold Color, upc): The color applied to deviation areas that fall below the oversold threshold.
OB (Overbought Color, dnc): The color applied to deviation areas that exceed the overbought threshold.
Middle Line Color (midc): A gradient color that visually blends between overbought and oversold colors for smoother visual transitions.
Calculation Components
Moving Average Calculation (mu): Based on the chosen Average Type, this calculation derives the moving average or middle line value for the selected source and length.
Deviation (dev): The deviation of the source value from the moving average is calculated. This is useful to determine whether the current price is significantly above or below the average, signaling potential buying or selling opportunities.
Overbought (ob) and Oversold (os) Levels: These levels are calculated using a linear percentile interpolation based on the deviation, length, and sensitivity inputs. The higher the sensitivity, the narrower the overbought and oversold zones, allowing users to capture more frequent signals.
Visual Elements
Moving Average Line (mu): This line represents the moving average based on the selected calculation method and is plotted with a dynamic color based on deviation thresholds. When the deviation crosses into overbought or oversold zones, it shifts to the corresponding OB/OS colors, providing a visual indication of potential trend reversals.
Deviation Plot (dev): This plot visualizes the deviation values as a column plot, with colors matching the overbought, oversold, or neutral states. This helps users to quickly assess whether the price is trending or reverting back to its mean.
Overbought (ob) and Oversold (os) Levels: These levels are plotted as fixed lines, helping users identify when the deviation crosses into overbought or oversold zones.
Cerca negli script per "rma"
Effective Volume (ADV) v3Effective Volume (ADV) v3: Enhanced Accumulation/Distribution Analysis Tool
This indicator is an updated version of the original script by cI8DH, now upgraded to Pine Script v5 with added functionality, including the Volume Multiple feature. The tool is designed for analyzing Accumulation/Distribution (A/D) volume, referred to here as "Effective Volume," which represents the volume impact in alignment with price direction, providing insights into bullish or bearish trends through volume.
Accumulation/Distribution Volume Analysis : The script calculates and visualizes Effective Volume (ADV), helping traders assess volume strength in relation to price action. By factoring in bullish or bearish alignment, Effective Volume highlights points where volume strongly supports price movements.
Volume Multiple Feature for Volume Multiplication : The Volume Multiple setting (default value 2) allows you to set a multiplier to identify bars where Effective Volume exceeds the previous bar’s volume by a specified factor. This feature aids in pinpointing significant shifts in volume intensity, often associated with potential trend changes.
Customizable Aggregation Types : Users can choose from three volume aggregation types:
Simple - Standard SMA (Simple Moving Average) for averaging Effective Volume
Smoothed - RMA (Recursive Moving Average) for a less volatile, smoother line
Cumulative - Accumulated Effective Volume for ongoing trend analysis
Volume Divisor : The “Divide Vol by” setting (default 1 million) scales down the Effective Volume value for easier readability. This allows Effective Volume data to be aligned with the scale of the price chart.
Visualization Elements
Effective Volume Columns : The Effective Volume bar plot changes color based on volume direction:
Green Bars : Bullish Effective Volume (volume aligns with price movement upwards)
Red Bars : Bearish Effective Volume (volume aligns with price movement downwards)
Moving Average Lines :
Volume Moving Average - A gray line representing the moving average of total volume.
A/D Moving Average - A blue line showing the moving average of Accumulation/Distribution (A/D) Effective Volume.
High ADV Indicator : A “^” symbol appears on bars where the Effective Volume meets or exceeds the Volume Multiple threshold, highlighting bars with significant volume increase.
How to Use
Analyze Accumulation/Distribution Trends : Use Effective Volume to observe if bullish or bearish volume aligns with price direction, offering insights into the strength and sustainability of trends.
Identify Volume Multipliers with Volume Multiple : Adjust Volume Multiple to track when Effective Volume has notably increased, signaling potential shifts or strengthening trends.
Adjust Volume Display : Use the volume divisor setting to scale Effective Volume for clarity, especially when viewing alongside price data on higher timeframes.
With customizable parameters, this script provides a flexible, enhanced perspective on Effective Volume for traders analyzing volume-based trends and reversals.

J Lines EMA + VWAPThe EMA + VWAP indicator combines the power of Exponential Moving Averages (EMA) with the Volume Weighted Average Price (VWAP) to help traders spot trends, identify potential entries/exits, and understand market momentum with ease. This dual-purpose tool is designed to give both beginner and experienced traders a clear view of price direction and volume influence, whether for day trading or swing trading.
Key Features:
Dynamic EMA Lines:
Six customizable moving averages (EMA by default) adapt to your selected timeframe. EMAs help track trend direction and strength, with various colors and opacity settings that visually separate them for clarity.
VWAP Tracking: A standalone VWAP line (blue) shows the average trading price adjusted for volume, making it ideal for pinpointing significant price levels where institutional interest often lies.
EMA Ribbons for Trend Confirmation: Soft-colored ribbons are placed between EMA pairs to make the trend strength visually apparent, with different color fills between lines. This makes it easy to gauge bullish or bearish conditions at a glance.
Flexible MA Options: Besides EMA, you can choose from SMA, WMA, HMA, and RMA, allowing you to adapt the indicator to various trading strategies.
This tool simplifies trend-following and volume-based analysis by giving you insight into both price momentum and market participation levels. EMAs adapt to volatility and changing market conditions, while the VWAP keeps you aware of critical price zones based on trading volume. Together, these help you stay on the right side of the market, avoid false breakouts, and make informed decisions on when to enter or exit trades.
Ideal for beginners due to its visual clarity and flexible enough for seasoned traders, EMA + VWAP is your go-to indicator for a structured approach to market trends.

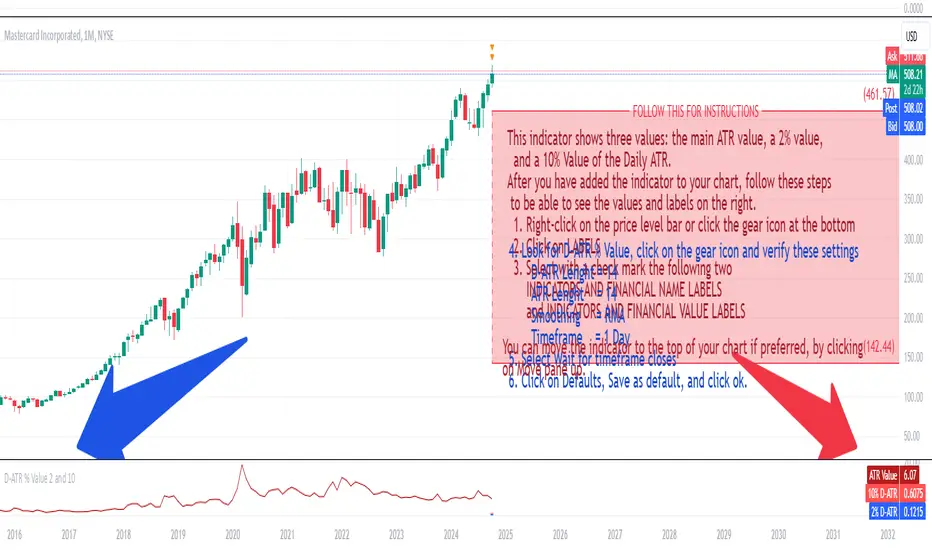
Daily ATR 2 and 10 Percent Value
This indicator shows three values: the main ATR value, a 2% value,
and a 10% Value of the Daily ATR.
After you have added the indicator to your chart, follow these steps
to be able to see the values and labels on the right.
1. Right-click on the price level bar or click the gear icon at the bottom
2. Click on LABELS
3. Select with a check mark the following two
INDICATORS AND FINANCIAL NAME LABELS
and INDICATORS AND FINANCIAL VALUE LABELS
4. Look for D-ATR % Value, click on the gear icon and verify these settings
- D-ATR Lenght = 14
- ATR Lenght = 14
- Smoothing = RMA
- Timeframe = 1 Day
5. Select Wait for timeframe closes
6. Click on Defaults, Save as default, and click ok.
You can move the indicator to the top of your chart if preferred, by clicking
on Move pane up.
Slightly modifications from other indicators.
STANDARD DEVIATION INDICATOR BY WISE TRADERWISE TRADER STANDARD DEVIATION SETUP: The Ultimate Volatility and Trend Analysis Tool
Unlock the power of STANDARD DEVIATIONS like never before with the this indicator, a versatile and comprehensive tool designed for traders who seek deeper insights into market volatility, trend strength, and price action. This advanced indicator simultaneously plots three sets of customizable Deviations, each with unique settings for moving average types, standard deviations, and periods. Whether you’re a swing trader, day trader, or long-term investor, the STANDARD DEVIATION indicator provides a dynamic way to spot potential reversals, breakouts, and trend-following opportunities.
Key Features:
STANDARD DEVIATIONS Configuration : Monitor three different Bollinger Bands at the same time, allowing for multi-timeframe analysis within a single chart.
Customizable Moving Average Types: Choose from SMA, EMA, SMMA (RMA), WMA, and VWMA to calculate the basis of each band according to your preferred method.
Dynamic Standard Deviations: Set different standard deviation multipliers for each band to fine-tune sensitivity for various market conditions.
Visual Clarity: Color-coded bands with adjustable thicknesses provide a clear view of upper and lower boundaries, along with fill backgrounds to highlight price ranges effectively.
Enhanced Trend Detection: Identify potential trend continuation, consolidation, or reversal zones based on the position and interaction of price with the three bands.
Offset Adjustment: Shift the bands forward or backward to analyze future or past price movements more effectively.
Why Use Triple STANDARD DEVIATIONS ?
STANDARD DEVIATIONS are a popular choice among traders for measuring volatility and anticipating potential price movements. This indicator takes STANDARD DEVIATIONS to the next level by allowing you to customize and analyze three distinct bands simultaneously, providing an unparalleled view of market dynamics. Use it to:
Spot Volatility Expansion and Contraction: Track periods of high and low volatility as prices move toward or away from the bands.
Identify Overbought or Oversold Conditions: Monitor when prices reach extreme levels compared to historical volatility to gauge potential reversal points.
Validate Breakouts: Confirm the strength of a breakout when prices move beyond the outer bands.
Optimize Risk Management: Enhance your strategy's risk-reward ratio by dynamically adjusting stop-loss and take-profit levels based on band positions.
Ideal For:
Forex, Stocks, Cryptocurrencies, and Commodities Traders looking to enhance their technical analysis.
Scalpers and Day Traders who need rapid insights into market conditions.
Swing Traders and Long-Term Investors seeking to confirm entry and exit points.
Trend Followers and Mean Reversion Traders interested in combining both strategies for maximum profitability.
Harness the full potential of STANDARD DEVIATIONS with this multi-dimensional approach. The "STANDARD DEVIATIONS " indicator by WISE TRADER will become an essential part of your trading arsenal, helping you make more informed decisions, reduce risks, and seize profitable opportunities.
Who is WISE TRADER ?
Wise Trader is a highly skilled trader who launched his channel in 2020 during the COVID-19 pandemic, quickly building a loyal following. With thousands of paid subscribed members and over 70,000 YouTube subscribers, Wise Trader has become a trusted authority in the trading world. He is known for his ability to navigate significant events, such as the Indian elections and stock market crashes, providing his audience with valuable insights into market movements and volatility. With a deep understanding of macroeconomics and its correlation to global stock markets, Wise Trader shares informed strategies that help traders make better decisions. His content covers technical analysis, trading setups, economic indicators, and market trends, offering a comprehensive approach to understanding financial markets. The channel serves as a go-to resource for traders who want to enhance their skills and stay informed about key market developments.

RSI with Dynamic ColorsThe "RSI with Dynamic Colors" is a custom indicator built on top of the traditional Relative Strength Index (RSI), which helps traders identify overbought or oversold market conditions. This enhanced version includes added functionality like dynamic colors, highlighting specific conditions, and more customization options. Here's a breakdown of how this indicator works:
Indicator Components:
Relative Strength Index (RSI) Calculation:
The RSI is a momentum oscillator that measures the speed and change of price movements. It oscillates between 0 and 100, helping traders determine if an asset is overbought or oversold.
In this version, the RSI is calculated with a configurable lookback period (default is 14) and applies smoothing to both upward and downward price changes using the Relative Moving Average (RMA).
Dynamic Coloring:
The indicator dynamically changes the color of the RSI line based on its value. Specific thresholds include:
Blue: When the RSI is at or above an extreme overbought level (≥ 85).
Red: When the RSI is in the overbought zone (≥ 70 but < 85).
Yellow: When the RSI is at or below the extreme oversold level (≤ 15).
Green: When the RSI is in the oversold zone (≤ 30 but > 15).
White: When the RSI is between the oversold and overbought zones.
Moving Average Options (MA):
The indicator allows the user to plot an optional moving average of the RSI for additional trend confirmation. Users can select from various types of moving averages, including Simple Moving Average (SMA), Exponential Moving Average (EMA), and others.
Bollinger Bands can be optionally applied around the RSI to visualize volatility.
Overbought and Oversold Highlights:
It provides visual highlights (green for overbought and red for oversold) in the background of the RSI plot, making it easier to identify potential reversal zones.
Divergence Detection (Optional):
The indicator can optionally display regular bullish or bearish divergence, which can signal potential trend reversals. Divergence occurs when price moves in the opposite direction of the RSI.
Bullish divergence is indicated when the price makes lower lows while the RSI makes higher lows.
Bearish divergence is shown when the price makes higher highs while the RSI makes lower highs.
Alerts:
Users can set up alerts for bullish or bearish divergence, making it easier to get notified when key conditions occur in the market.
Use Case:
This custom RSI indicator is designed for traders who want to combine the classic RSI functionality with enhanced visual aids, such as color coding for different RSI zones, customizable moving averages, and Bollinger Bands. It is particularly useful for identifying potential market tops and bottoms by highlighting overbought/oversold conditions and divergence signals.
In summary, this indicator not only retains the traditional RSI's power but also adds new layers of insight through color, moving averages, and divergence detection, helping traders make better-informed decisions.

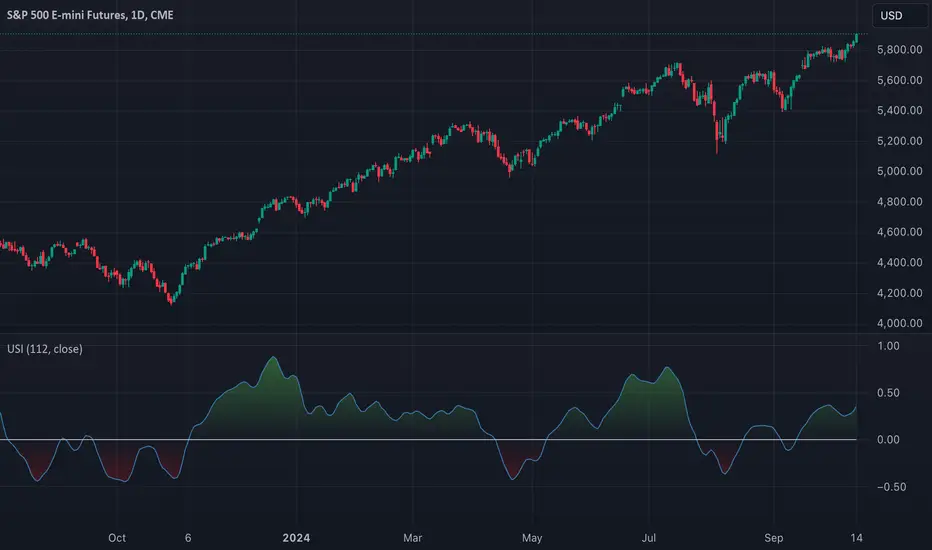
TASC 2024.11 Ultimate Strength Index█ OVERVIEW
This script implements the Ultimate Strength Index (USI) indicator, introduced by John Ehlers in his article titled "Ultimate Strength Index (USI)" from the November 2024 edition of TASC's Traders' Tips . The USI is a modified version of Wilder's original Relative Strength Index (RSI) that incorporates Ehlers' UltimateSmoother lowpass filter to produce an output with significantly reduced lag.
█ CONCEPTS
Many technical indicators, including the RSI, lag due to their heavy reliance on historical data. John Ehlers reformulated the RSI to substantially reduce lag by applying his UltimateSmoother filter to upward movements ( strength up - SU ) and downward movements ( strength down - SD ) in the time series, replacing the standard process of smoothing changes with rolling moving averages (RMAs). Ehlers' recent works, covered in our recent script publications, have shown that the UltimateSmoother is an effective alternative to other classic averages, offering notably less lag in its response.
Ehlers also modified the RSI formula to produce an index that ranges from -1 to +1 instead of 0 to 100. As a result, the USI indicates bullish conditions when its value moves above 0 and bearish conditions when it falls below 0.
The USI retains many of the strengths of the traditional RSI while offering the advantage of reduced lag. It generally uses a larger lookback window than the conventional RSI to achieve similar behavior, making it suitable for trend trading with longer data lengths. When applied with shorter lengths, the USI's peaks and valleys tend to align closely with significant turning points in the time series, making it a potentially helpful tool for timing swing trades.
█ CALCULATIONS
The first step in the USI's calculation is determining each bar's strength up (SU) and strength down (SD) values. If the current bar's close exceeds the previous bar's, the calculation assigns the difference to SU. Otherwise, SU is zero. Likewise, if the current bar's close is below the previous bar's, it assigns the difference to SD. Otherwise, SD is zero.
Next, instead of the RSI's typical smoothing process, the USI's calculation applies the UltimateSmoother to the short-term average SU and SD values, reducing high-frequency chop in the series with low lag.
Finally, this formula determines the USI value:
USI = ( Ult (SU) − Ult (SD)) / ( Ult (SU) + Ult (SD)),
where Ult (SU) and Ult (SD) are the smoothed average strength up and strength down values.
ADX Trend Strength Analyzer█ OVERVIEW
This script implements the Average Directional Index (ADX), a powerful tool used to measure the strength of market trends. It works alongside the Directional Movement Index (DMI), which breaks down the directional market pressure into bullish (+DI) and bearish (-DI) components. The purpose of the ADX is to indicate when the market is in a strong trend, without specifying the direction. This indicator can be especially useful for identifying market trends early and validating trading strategies based on trend-following systems.
The ADX component in this script is based on two key parameters:
ADX Smoothing Length (adxlen), which determines the degree of smoothing for the trend strength.
DI Length (dilen), which defines the look-back period for calculating the directional index values.
Additionally, a horizontal line is plotted at the 30 level, providing a widely used threshold that signifies when a trend is considered strong (above 30).
█ CONCEPTS
Directional Movement (DM): The core idea behind this indicator is the calculation of price movement in terms of bullish and bearish forces. By evaluating the change in highs and lows, the script distinguishes between bullish movement (+DM) and bearish movement (-DM). These values are normalized by dividing them by the True Range (TR), creating the +DI and -DI values.
True Range (TR): The True Range is calculated using the Average True Range (ATR) formula, and it serves to smooth out volatility, ensuring that short-term fluctuations don't distort the long-term trend signal.
ADX Calculation: The ADX is derived from the absolute difference between the +DI and -DI. By smoothing this difference and normalizing it, the ADX is able to measure the overall strength of the trend without regard to whether the market is moving up or down. A rising ADX indicates increasing trend strength, while a falling ADX signals weakening trends.
█ METHODOLOGY
Directional Movement Calculation: The script first determines the upward and downward price movement by comparing changes in the high and low prices. If the upward movement is greater than the downward movement, it registers a bullish signal and vice versa for bearish movement.
True Range Adjustment: The script then applies a smoothing function to normalize these movements by dividing them by the True Range (ATR). This ensures that the trend signal is based on relative, rather than absolute, price movements.
ADX Signal Generation: The final step is to calculate the ADX by applying the Relative Moving Average (RMA) to the difference between +DI and -DI. This produces the ADX value, which is plotted in red, making it easy to visualize shifts in market momentum.
Threshold Line: A blue horizontal line is plotted at 30, which serves as a key reference point. When the ADX is above this line, it indicates a strong trend, whether bullish or bearish.
█ HOW TO USE
Trend Strength: Traders typically use the 30 level as a critical threshold. When the ADX is above 30, it signifies a strong trend, making it a favorable environment for trend-following strategies. Conversely, ADX values below 30 suggest a weak or non-trending market.
+DI and -DI Relationship: The indicator also provides insight into whether the trend is bullish or bearish. When +DI is greater than -DI, the market is considered bullish. When -DI is greater than +DI, the market is considered bearish. While this script focuses on the ADX value itself, the underlying +DI and -DI help interpret the trend direction.
Market Conditions: This indicator is effective in trending markets, but not ideal for choppy or sideways conditions. Traders can use it to determine the best entry and exit points when trends are strong, or to avoid trading in periods of low volatility.
Combining with Other Indicators: The ADX is commonly used in conjunction with oscillators like RSI or moving averages, to confirm the trend strength and avoid false signals.
█ METHOD VARIANTS
This script applies the standard approach for calculating the ADX, but could be adapted with the following variants:
Different Timeframes: The script could be modified to calculate ADX values across higher or lower timeframes, depending on the trader's strategy.
Custom Thresholds: Instead of using the default 30 threshold, traders could adjust the horizontal line to suit their own risk tolerance or market conditions.

TechniTrend: Average VolatilityTechniTrend: Average Volatility
Description:
The "Average Volatility" indicator provides a comprehensive measure of market volatility by offering three different types of volatility calculations: High to Low, Body, and Shadows. The indicator allows users to apply various types of moving averages (SMA, EMA, SMMA, WMA, and VWMA) on these volatility measures, enabling a more flexible approach to trend analysis and volatility tracking.
Key Features:
Customizable Volatility Types:
High to Low: Measures the range between the highest and lowest prices in the selected period.
Body: Measures the absolute difference between the opening and closing prices of each candle (just the body of the candle).
Shadows: Measures the difference between the wicks (shadows) of the candle.
Flexible Moving Averages:
Choose from five different types of moving averages to apply on the calculated volatility:
SMA (Simple Moving Average)
EMA (Exponential Moving Average)
SMMA (RMA) (Smoothed Moving Average)
WMA (Weighted Moving Average)
VWMA (Volume-Weighted Moving Average)
Custom Length:
Users can customize the period length for the moving averages through the Length input.
Visualization:
Three separate plots are displayed, each representing the average volatility of a different type:
Blue: High to Low volatility.
Green: Candle body volatility.
Red: Candle shadows volatility.
-------------------------------------------
This indicator offers a versatile and highly customizable tool for analyzing volatility across different components of price movement, and it can be adapted to different trading styles or market conditions.

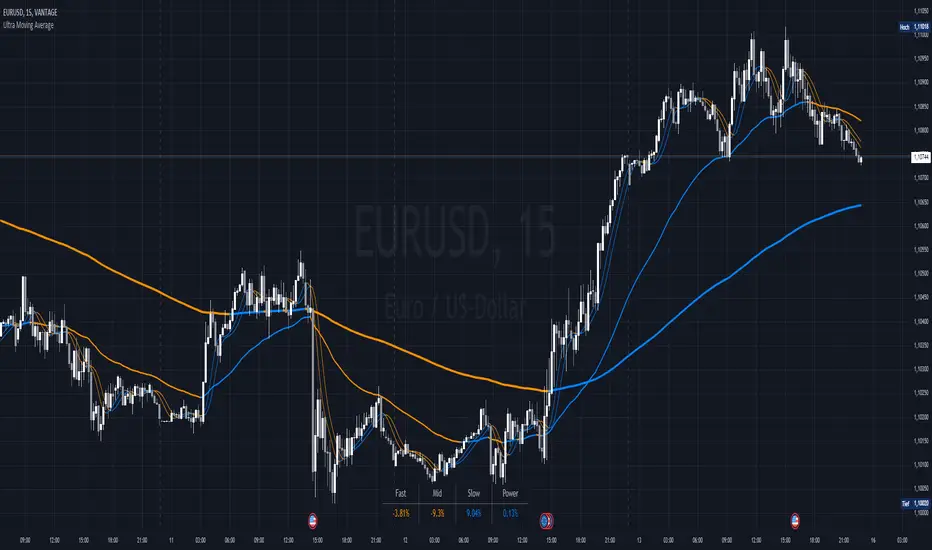
Ultra Moving AverageThe Ultra Moving Average is a versatile technical indicator that combines various types of moving averages to analyze trends, providing multi-timeframe insights for traders. It offers four customizable moving averages and a trend strength table for enhanced decision-making.
Introduction
The Ultra Moving Average indicator is a powerful tool designed to help traders track market trends by offering a combination of four distinct moving averages. With flexible customization options, users can apply different types of moving averages like SMA, EMA, TEMA, and many more, across various timeframes. Additionally, it provides trend strength analysis through an intuitive visual table, helping traders quickly identify market conditions.
Detailed Description
.........
Moving Averages
Each of the four moving averages is independently configurable. You can select the timeframe, type, length, color, and width to match your trading strategy.
The types of moving averages range from traditional ones like the Simple Moving Average (SMA) to advanced ones like the Double Expotential Moving Average (DEMA) or the Triple Exponential Moving Average (TEMA) or the Recursive Moving Average (RMA) or the Weigthend Moving Average (WMA) or the Volume Weigthend Moving Average (VWMA) or Hull Moving Average (HMA).
Very Special ones are the Triple Weigthend Moving Average (TWMA) wich created RedKTrader .
I created the Multi Weigthend Moving Average (MWMA) wich is a simple signal line to the TWMA.
.....
Trend Visualization
The indicator uses color-coding to visually represent whether the price is in an uptrend or downtrend. Bullish trends are highlighted in one color, while bearish trends appear in another, making it easy to interpret.
.....
Trend Strength Table
One of the unique features of the Ultra Moving Average is the trend strength table at the bottom of the chart. This table breaks down the strength of the fast, mid, and slow moving averages, displaying them as percentages. It also shows the overall "trend power," which helps assess how strong or weak the current trend is.
You have the option to calculate trends using live data or the previous bar's data, offering flexibility in how the indicator reacts to market changes. This can help traders make more responsive decisions based on real-time trends.
The table displays trend strength across three timeframes Fast, Mid, and Slow by calculating the percentage difference between the price and each of the moving averages (MA1, MA3, MA4).
The Power row shows the average of these percentages, representing overall trend strength.
The percentages are calculated relative to their maximum values in history (limited by TradingView subscription), providing insight into the trend's strength for each timeframe.
.........
Overall, the Ultra Moving Average indicator is a comprehensive tool that combines multiple moving average types and advanced trend analysis, helping traders identify market direction and strength at a glance. With its intuitive visualization and flexible settings, it's suited for both beginner and experienced traders.
Special Thanks
I use the TWMA-Function created from RedKTrader to smooth the values.
Special thanks to him for creating and sharing this function!
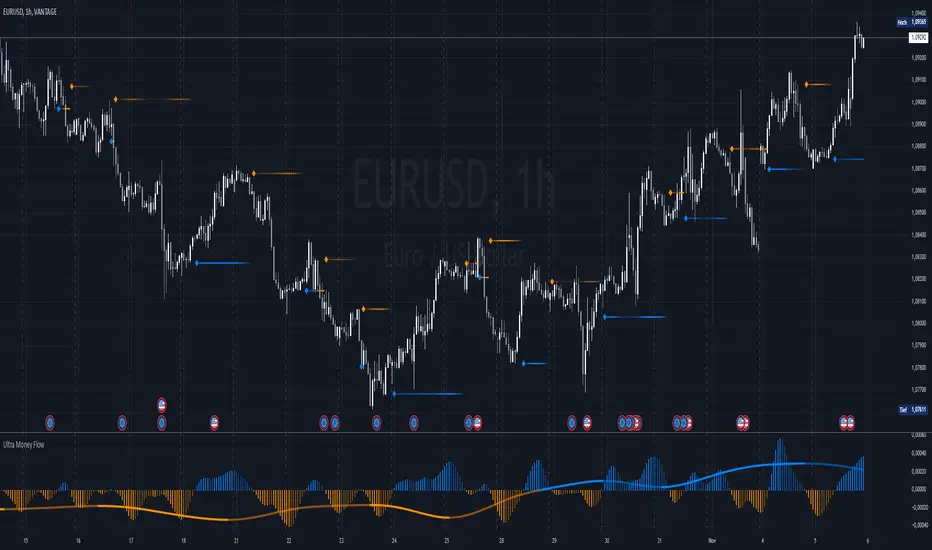
Ultra Money FlowIntroduction
The Ultra Money Flow script is a technical indicator for analyzing stock trends. It highlights buying and selling power, helping you identify bullish (rising) or bearish (falling) market trends.
Detailed Description
The Ultra Money Flow script calculates and visually displays two main components: Fast and Slow money flow. These components represent short-term and long-term trends, respectively.
Here's how it works:
.........
Inputs
You can adjust the speed of analysis (Fast Length and Slow Length) and the type of smoothing applied (e.g., Simple Moving Average, Exponential Moving Average).
Choose colors for visualizing the trends, with blue for bullish (positive) and orange for bearish (negative) movements.
.....
Money Flow Calculation
The script analyzes price changes (delta) over specified periods.
It separates upward price movements (buying power) from downward ones (selling power).
It then calculates the difference between these powers for both Fast and Slow components.
The types of smoothing methods range from traditional ones like the Simple Moving Average (SMA) to advanced ones like the Double Expotential Moving Average (DEMA) or the Triple Exponential Moving Average (TEMA) or the Recursive Moving Average (RMA) or the Weigthend Moving Average (WMA) or the Volume Weigthend Moving Average (VWMA) or Hull Moving Average (HMA).
Very Special ones are the Triple Weigthend Moving Average (TWMA) wich created RedKTrader .
I created the Multi Weigthend Moving Average (MWMA) wich is a simple signal line to the TWMA.
.....
Divergence
This indicator can show divergence by comparing the direction of price movements with the indicator value.
If the price and the indicator move in opposite directions, you can use these signals to help decide when to buy or sell.
.....
Auto Scaling
The script adjusts its calculations based on the time frame you are viewing, whether it's minutes, hours, or days, ensuring accurate representation across different time scales.
.....
Plotting
The script plots the Fast component as a histogram and the Slow component as a line, using the chosen colors to indicate bullish or bearish trends.
The thickness and transparency of these plots give additional clues about the strength of the trend.
.........
By using this indicator, traders can easily spot shifts in buying and selling power, allowing for better-informed decisions in the market.
Special Thanks
I use the TWMA-Function created from RedKTrader to smooth the values.
Special thanks to him for creating and sharing this function!
Average True Range with Price MAATR with Price Moving Average Indicator
This custom indicator combines the Average True Range (ATR) with a Price Moving Average (MA) to help traders analyze market volatility in percent to the price.
Key Components:
Average True Range (ATR)
Price Moving Average (MA)
ATR/Price in Percent
ATR/Price in Percent
Purpose: This ratio helps traders understand the relative size of the ATR compared to the current price, providing a clearer sense of how significant the volatility is in proportion to the price level.
Calculation: ATR is divided by the current closing price and multiplied by 100 to express it as a percentage. This makes it easier to compare volatility across assets with different price ranges.
Plot: This is plotted as a percentage, making it easier to gauge whether the volatility is proportionally high or low compared to the asset's price.
Usage:
This indicator is designed to help identify the most volatile tokens, making it ideal for configuring a Grid Bot to maximize profit. By focusing on high-volatility assets, traders can capitalize on larger price swings within the grid, increasing the potential for more profitable trades.
Features:
Customizable Smoothing Method: Choose from RMA (Relative Moving Average), SMA (Simple Moving Average), EMA (Exponential Moving Average), or WMA (Weighted Moving Average) for both ATR and the Price Moving Average.
Dual Perspective: The indicator provides both volatility analysis (ATR) and trend analysis (Price MA) in a single view.
Proportional Volatility: The ATR/Price (%) ratio adds a layer of context by showing how volatile the asset is relative to its current price.

Pulse Oscillator [UAlgo]The "Pulse Oscillator " is a trading tool designed to capture market momentum and trend changes by combining the strengths of multiple well-known technical indicators. By integrating the RSI (Relative Strength Index), CCI (Commodity Channel Index), and Stochastic Oscillator, this indicator provides traders with a comprehensive view of market conditions, offering both trend filtering and precise buy/sell signals. The oscillator is customizable, allowing users to fine-tune its parameters to match different trading strategies and timeframes. With its built-in smoothing techniques and level adjustments, the Pulse Oscillator aims to be a reliable tool for both trend-following and counter-trend trading strategies.
🔶 Key Features
Multi-Indicator Integration: Combines RSI, CCI, and Stochastic Oscillator to create a weighted momentum oscillator.
Why Use Multi-Indicator Integration?
Script uses Multi-Indicator Integration to combine the strengths of different technical indicators—such as RSI, CCI, and Stochastic Oscillator—into a single tool. This approach helps to reduce the weaknesses of individual indicators, providing a more comprehensive and reliable analysis of market conditions. By integrating multiple indicators, we can generate more accurate signals, filter out noise, and enhance our trading decisions.
Customizable Parameters: Allows users to adjust weights, periods, and smoothing techniques, providing flexibility to adapt the indicator to various market conditions.
Trend Filtering Option: An optional trend filter is available to enhance the accuracy of buy and sell signals, reducing the risk of false signals in choppy markets.
Dynamic Levels: The indicator dynamically calculates multiple levels of support and resistance, adjusting to market conditions with customizable decay factors and offsets.
Visual Clarity: The indicator visually represents different levels and trends with color-coded plots and fills, making it easier for traders to interpret market conditions at a glance.
Alerts: Configurable alerts for buy and sell signals, as well as trend changes, enabling traders to stay informed of key market movements without constant monitoring.
🔶 Interpreting the Indicator
Buy Signal: A buy signal is generated when the Slow Line crosses under the Fast Line during an uptrend or when the trend filter is disabled. This indicates a potential bullish reversal or continuation of an upward trend.
Sell Signal: A sell signal occurs when the Slow Line crosses above the Fast Line during a downtrend or when the trend filter is disabled, signaling a potential bearish reversal or continuation of a downward trend.
Trend Change: The indicator detects trend changes when the Fast Line shifts from increasing to decreasing or vice versa, providing early warning of possible market reversals.
Dynamic Levels: The indicator calculates upper and lower levels based on the Fast Line's values. These levels can be used to identify overbought or oversold conditions and potential areas of support or resistance.
🔶 Disclaimer
Use with Caution: This indicator is provided for educational and informational purposes only and should not be considered as financial advice. Users should exercise caution and perform their own analysis before making trading decisions based on the indicator's signals.
Not Financial Advice: The information provided by this indicator does not constitute financial advice, and the creator (UAlgo) shall not be held responsible for any trading losses incurred as a result of using this indicator.
Backtesting Recommended: Traders are encouraged to backtest the indicator thoroughly on historical data before using it in live trading to assess its performance and suitability for their trading strategies.
Risk Management: Trading involves inherent risks, and users should implement proper risk management strategies, including but not limited to stop-loss orders and position sizing, to mitigate potential losses.
No Guarantees: The accuracy and reliability of the indicator's signals cannot be guaranteed, as they are based on historical price data and past performance may not be indicative of future results.

Uptrick: Volume-Weighted EMA Signal### **Uptrick: Volume-Weighted EMA Signal (UVES) Indicator - Comprehensive Description**
#### **Overview**
The **Uptrick: Volume-Weighted EMA Signal (UVES)** is an advanced, multifaceted trading indicator meticulously designed to provide traders with a holistic view of market trends by integrating Exponential Moving Averages (EMA) with volume analysis. This indicator not only identifies the direction of market trends through dynamic EMAs but also evaluates the underlying strength of these trends using real-time volume data. UVES is a versatile tool suitable for various trading styles and markets, offering a high degree of customization to meet the specific needs of individual traders.
#### **Purpose**
The UVES indicator aims to enhance traditional trend-following strategies by incorporating a critical yet often overlooked component: volume. Volume is a powerful indicator of market strength, providing insights into the conviction behind price movements. By merging EMA-based trend signals with detailed volume analysis, UVES offers a more nuanced and reliable approach to identifying trading opportunities. This dual-layer analysis allows traders to differentiate between strong trends supported by significant volume and weaker trends that may be prone to reversals.
#### **Key Features and Functions**
1. **Dynamic Exponential Moving Average (EMA):**
- The core of the UVES indicator is its dynamic EMA, calculated over a customizable period. The EMA is a widely used technical indicator that smooths price data to identify the underlying trend. In UVES, the EMA is dynamically colored—green when the current EMA value is above the previous value, indicating an uptrend, and red when below, signaling a downtrend. This visual cue helps traders quickly assess the trend direction without manually calculating or interpreting raw data.
2. **Comprehensive Moving Average Customization:**
- While the EMA is the default moving average in UVES, traders can select from various other moving average types, including Simple Moving Average (SMA), Smoothed Moving Average (SMMA), Weighted Moving Average (WMA), and Volume-Weighted Moving Average (VWMA). Each type offers unique characteristics:
- **SMA:** Provides a simple average of prices over a specified period, suitable for identifying long-term trends.
- **EMA:** Gives more weight to recent prices, making it more responsive to recent market movements.
- **SMMA (RMA):** A slower-moving average that reduces noise, ideal for capturing smoother trends.
- **WMA:** Weighs prices based on their order in the dataset, making recent prices more influential.
- **VWMA:** Integrates volume data, emphasizing price movements that occur with higher volume, making it particularly useful in volume-sensitive markets.
3. **Signal Line for Trend Confirmation:**
- UVES includes an optional signal line, which applies a secondary moving average to the primary EMA. This signal line can be used to smooth out the EMA and confirm trend changes. The signal line’s color changes based on its slope—green for an upward slope and red for a downward slope—providing a clear visual confirmation of trend direction. Traders can adjust the length and type of this signal line, allowing them to tailor the indicator’s responsiveness to their trading strategy.
4. **Buy and Sell Signal Generation:**
- UVES generates explicit buy and sell signals based on the interaction between the EMA and the signal line. A **buy signal** is triggered when the EMA transitions from a red (downtrend) to a green (uptrend), indicating a potential entry point. Conversely, a **sell signal** is triggered when the EMA shifts from green to red, suggesting an exit or shorting opportunity. These signals are displayed directly on the chart as upward or downward arrows, making them easily identifiable even during fast market conditions.
5. **Volume Analysis with Real-Time Buy/Sell Volume Table:**
- One of the standout features of UVES is its integration of volume analysis, which calculates and displays the volume attributed to buying and selling activities. This analysis includes:
- **Buy Volume:** The portion of the total volume associated with price increases (close higher than open).
- **Sell Volume:** The portion of the total volume associated with price decreases (close lower than open).
- **Buy/Sell Ratio:** A ratio of buy volume to sell volume, providing a quick snapshot of market sentiment.
- These metrics are presented in a real-time table positioned in the top-right corner of the chart, with customizable colors and formatting. The table updates with each new bar, offering continuous feedback on the strength and direction of the market trend based on volume data.
6. **Customizable Settings and User Control:**
- **EMA Length and Source:** Traders can specify the lookback period for the EMA, adjusting its sensitivity to price changes. The source for EMA calculations can also be customized, with options such as close, open, high, low, or other custom price series.
- **Signal Line Customization:** The signal line’s length, type, and width can be adjusted to suit different trading strategies, allowing traders to optimize the balance between trend detection and noise reduction.
- **Offset Adjustment:** The offset feature allows users to shift the EMA and signal line forward or backward on the chart. This can help align the indicator with specific price action or adjust for latency in decision-making processes.
- **Volume Table Positioning and Formatting:** The position, size, and color scheme of the volume table are fully customizable, enabling traders to integrate the table seamlessly into their chart setup without cluttering the visual workspace.
7. **Versatility Across Markets and Trading Styles:**
- UVES is designed to be effective across a wide range of financial markets, including Forex, stocks, cryptocurrencies, commodities, and indices. Its adaptability to different markets is supported by its comprehensive customization options and the inclusion of volume analysis, which is particularly valuable in markets where volume plays a crucial role in price movement.
#### **How Different Traders Can Benefit from UVES**
1. **Trend Followers:**
- Trend-following traders will find UVES particularly beneficial for identifying and riding trends. The dynamic EMA and signal line provide clear visual cues for trend direction, while the volume analysis helps confirm the strength of these trends. This combination allows trend followers to stay in profitable trades longer and exit when the trend shows signs of weakening.
2. **Volume-Based Traders:**
- Traders who focus on volume as a key indicator of market strength can leverage the UVES volume table to gain insights into the buying and selling pressure behind price movements. By monitoring the buy/sell ratio, these traders can identify periods of strong conviction (high buy volume) or potential reversals (high sell volume) with greater accuracy.
3. **Scalpers and Day Traders:**
- For traders operating on shorter time frames, UVES provides quick and reliable signals that are essential for making rapid trading decisions. The ability to customize the EMA length and type allows scalpers to fine-tune the indicator for responsiveness, while the volume analysis offers an additional layer of confirmation to avoid false signals.
4. **Swing Traders:**
- Swing traders, who typically hold positions for several days to weeks, can use UVES to identify medium-term trends and potential entry and exit points. The indicator’s ability to filter out market noise through the signal line and volume analysis makes it ideal for capturing significant price movements without being misled by short-term volatility.
5. **Position Traders and Long-Term Investors:**
- Even long-term investors can benefit from UVES by using it to identify major trend reversals or confirm the strength of long-term trends. The flexibility to adjust the EMA and signal line to longer periods ensures that the indicator remains relevant for detecting shifts in market sentiment over extended time frames.
#### **Optimal Settings for Different Markets**
- **Forex Markets:**
- **EMA Length:** 9 to 14 periods.
- **Signal Line:** Use VWMA or WMA for the signal line to incorporate volume data, which is crucial in the highly liquid Forex markets.
- **Best Use:** Short-term trend following, with an emphasis on identifying rapid changes in market sentiment.
- **Stock Markets:**
- **EMA Length:** 20 to 50 periods.
- **Signal Line:** SMA or EMA with a slightly longer length (e.g., 50 periods) to capture broader market trends.
- **Best Use:** Medium to long-term trend identification, with volume analysis confirming the strength of institutional buying or selling.
- **Cryptocurrency Markets:**
- **EMA Length:** 9 to 12 periods, due to the high volatility in crypto markets.
- **Signal Line:** SMMA or EMA for smoothing out extreme price fluctuations.
- **Best Use:** Identifying entry and exit points in volatile markets, with the volume table providing insights into market manipulation or sudden shifts in trader sentiment.
- **Commodity Markets:**
- **EMA Length:** 14 to 21 periods.
- **Signal Line:** WMA or VWMA, considering the impact of trading volume on commodity prices.
- **Best Use:** Capturing medium-term price movements and confirming trend strength with volume data.
#### **Customization for Advanced Users**
- **Advanced Offset Usage:** Traders can experiment with different offset values to see how shifting the EMA and signal line impacts the timing of buy/sell signals. This can be particularly useful in markets with known latency or for strategies that require a delayed confirmation of trend changes.
- **Volume Table Integration:** The position, size, and colors of the volume table can be adjusted to fit seamlessly into any trading setup. For example, a trader might choose to position the table in the bottom-right corner and use a smaller size to keep the focus on price action while still having access to volume data.
- **Signal Filtering:** By combining the signal line with the primary EMA, traders can filter out false signals during periods of low volatility or when the market is range-bound. Adjusting the length of the signal line allows for greater control over the sensitivity of the trend detection.
#### **Conclusion**
The **Uptrick: Volume-Weighted EMA Signal (UVES)** is a powerful and adaptable indicator designed for traders who demand more from their technical analysis tools. By integrating dynamic EMA trend signals with real-time volume analysis, UVES offers a comprehensive view of market conditions, making it an invaluable resource for identifying trends, confirming signals, and understanding market sentiment. Whether you are a day trader, swing trader, or long-term investor, UVES provides the versatility, precision, and customization needed to make more informed and profitable trading decisions. With its ability to adapt to various markets and trading styles, UVES is not just an indicator but a complete trend analysis solution.

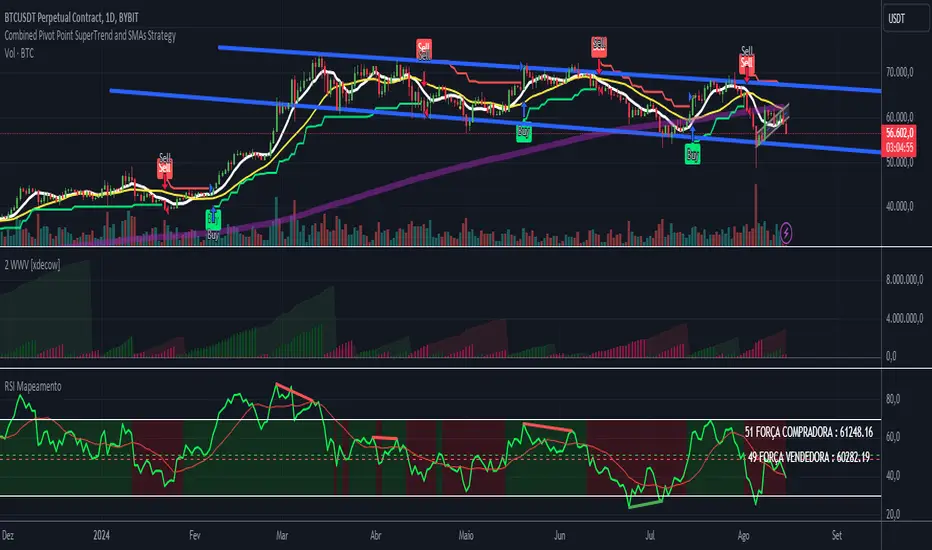
RSI - ARIEIVhe RSI MAPPING - ARIEIV is a powerful technical indicator based on the Relative Strength Index (RSI) combined with moving averages and divergence detection. This indicator is designed to provide a clear view of overbought and oversold conditions, as well as identifying potential reversals and signals for market entries and exits.
Key Features:
Customizable RSI:
The indicator offers flexibility in adjusting the RSI length and data source (closing price, open price, etc.).
The overbought and oversold lines can be customized, allowing the RSI to signal critical market zones according to the trader’s strategy.
RSI-Based Moving Averages (MA):
Users can enable a moving average based on the RSI with support for multiple types such as SMA, EMA, WMA, VWMA, and SMMA (RMA).
For those who prefer Bollinger Bands, there’s an option to use the moving average with standard deviation to detect market volatility.
Divergence Detection:
Detects both regular and hidden divergences (bullish and bearish) between price and RSI, which can indicate potential market reversals.
These divergences can be customized with specific colors for easy identification on the chart, allowing traders to quickly spot significant market shifts.
Zone Mapping:
The script maps zones of buying and selling strength, filling the areas between the overbought and oversold levels with specific colors, highlighting when the market is in extreme conditions.
Strength Tables:
At the end of each session, a table appears on the right side of the chart, displaying the "Buying Strength" and "Selling Strength" based on calculated RSI levels. This allows for quick analysis of the dominant pressure in the market.
Flexible Settings:
Many customization options are available, from adjusting the number of decimal places to the choice of colors and the ability to toggle elements on or off within the chart.
Pivot Channel Breaks [BigBeluga]Pivot Channel Break
The Pivot Channel Break indicator identifies key pivot points and creates a dynamic channel based on these pivots. It detects breakouts from this channel, providing potential entry and exit signals for traders.
🔵 How to Use
Channel Identification:
- Upper and lower channel lines drawn based on pivot highs and lows
- Channel width dynamically adjusted using ATR-like calculation
Breakout Signals:
- Upward breakout: Price closes above upper channel line
- Downward breakout: Price closes below lower channel line
- Signals shown as X marks on the chart
Pivot Points:
- High pivots marked with "H" triangles
- Low pivots marked with "L" triangles
Support & Resistance:
- Optional signals when price touches but doesn't break channel lines
Trend Visualization:
- Optional bar coloring based on the most recent breakout direction
🔵 Customization
• Pivot Right: Lookback period for pivot detection (default: 10)
• Pivot Left: Forward period for pivot confirmation (default: 40)
• Channel Width: Multiplier for channel width calculation (default: 1.0)
• Support & Resistance Signals: Toggle additional touch signals
• Bar Color: Enable/disable trend-based bar coloring
Calculation:
Detect pivot highs and lows using specified lookback periods
Calculate channel basis using 10-period SMA of close prices
Determine channel width using ATR-like calculation: RMA(high - low, 10) * width multiplier
Set channel lines based on pivot points and calculated deviations
Identify breakouts when price crosses beyond channel lines
The Pivot Channel Break indicator offers a dynamic approach to identifying potential trend changes and breakout opportunities. It combines pivot point analysis with a flexible channel calculation, providing traders with a visual tool for market structure analysis. Use this indicator in conjunction with other technical analysis methods to confirm signals and manage risk effectively.

Brooks Always In [KintsugiTrading]Brooks Always In
Overview:
The "Brooks Always In Indicator" by KintsugiTrading is a tool designed for traders who follow price action methodologies inspired by Al Brooks. This indicator identifies key bar patterns and breakouts, plots an Exponential Moving Average (EMA), and highlights consecutive bullish and bearish bars. It is intended to assist traders in making informed decisions based on price action dynamics.
Features:
Consecutive Bar Patterns:
Identifies and highlights consecutive bullish and bearish bars.
Differentiates between bars that are above/below the EMA and those that are not.
Customizable EMA:
Option to display an Exponential Moving Average (EMA) with user-defined length and offset.
The EMA can be smoothed using various methods such as SMA, EMA, SMMA (RMA), WMA, and VWMA.
Breakout Patterns:
Recognizes bullish and bearish breakout bars and outside bars.
Tracks inside bars and prior bar conditions to better understand the market context.
Customizable Display:
Users can display or hide the EMA, consecutive bar patterns, and consecutive bars relative to the moving average.
How to Use:
Customize Settings:
First, I like to navigate to the top right corner of the chart (bolt icon), and change both the bull and bear body color to match the background (white/black) - this helps the user visualize the indicator far better.
Next, Toggle to display EMA, consecutive bar patterns, and consecutive bars relative to the moving average using the provided input options.
Adjust the EMA length, source, and offset as per your trading strategy.
Select the smoothing method and length for the EMA if desired.
Analyze Key Patterns:
Observe the highlighted bars on the chart to identify consecutive bullish and bearish patterns.
Use the plotted EMA to gauge the general trend and analyze the relationship between price bars and the moving average.
Informed Decision Making:
Utilize the identified bar patterns and breakouts to make informed trading decisions, such as identifying potential entry and exit points based on price action dynamics.
Good luck with your trading!

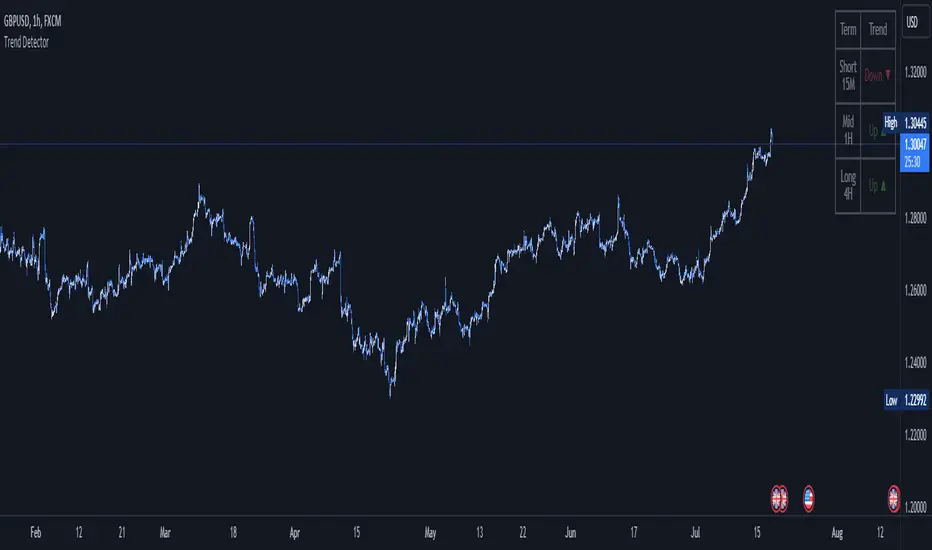
Trend DetectorThe Trend Detector indicator is a powerful tool to help traders identify and visualize market trends with ease. This indicator uses multiple moving averages (MAs) of different timeframes to provide a comprehensive view of market trends, making it suitable for traders of all experience levels.
█ USAGE
This indicator will automatically plot the chosen moving averages (MAs) on your chart, allowing you to visually assess the trend direction. Additionally, a table displaying the trend data for each selected MA timeframe is included to provide a quick overview.
█ FEATURES
1. Customizable Moving Averages: The indicator supports various types of moving averages, including Simple (SMA) , Exponential (EMA) , Smoothed (RMA) , Weighted (WMA) , and Volume-Weighted (VWMA) . You can select the type and length for each MA.
2. Multiple Timeframes: Plot moving averages for different timeframes on a single chart, including fast (short-term) , mid (medium-term) , and slow (long-term) MAs.
3. Trend Detector Table: A customizable table displays the trend direction (Up or Down) for each selected MA timeframe, providing a quick and easy way to assess the market's overall trend.
4. Customizable Appearance: Adjust the colors, frame, border, and text of the Trend Detector Table to match your chart's style and preferences.
5. Wait for Timeframe Close: Option to wait until the selected timeframe closes to plot the MA, which will remove the gaps.
█ CONCLUSION
The Trend Detector indicator is a versatile and user-friendly tool designed to enhance your trading strategy. By providing a clear visualization of market trends across multiple timeframes, this indicator helps you make informed trading decisions with confidence and trade with the market trend. Whether you're a day trader or a long-term investor, this indicator is an essential addition to your trading toolkit.
█ IMPORTANT
This indicator is a tool to aid in your analysis and should not be used as the sole basis for trading decisions. It is recommended to use this indicator in conjunction with other tools and perform comprehensive market analysis before making any trades.
Happy trading!
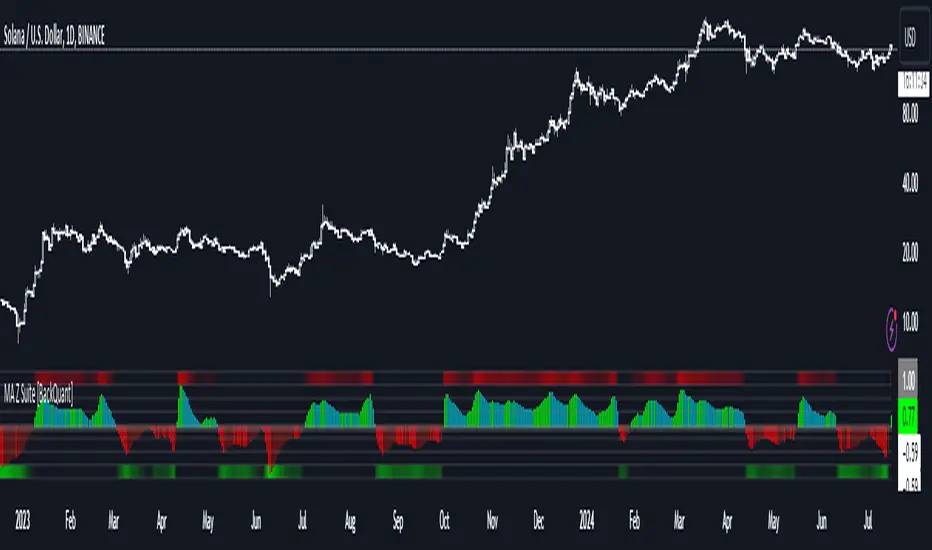
Moving Average Z-Score Suite [BackQuant]Moving Average Z-Score Suite
1. What is this indicator
The Moving Average Z-Score Suite is a versatile indicator designed to help traders identify and capitalize on market trends by utilizing a variety of moving averages. This indicator transforms selected moving averages into a Z-Score oscillator, providing clear signals for potential buy and sell opportunities. The indicator includes options to choose from eleven different moving average types, each offering unique benefits and characteristics. It also provides additional features such as standard deviation levels, extreme levels, and divergence detection, enhancing its utility in various market conditions.
2. What is a Z-Score
A Z-Score is a statistical measurement that describes a value's relationship to the mean of a group of values. It is measured in terms of standard deviations from the mean. For instance, a Z-Score of 1.0 means the value is one standard deviation above the mean, while a Z-Score of -1.0 indicates it is one standard deviation below the mean. In the context of financial markets, Z-Scores can be used to identify overbought or oversold conditions by determining how far a particular value (such as a moving average) deviates from its historical mean.
3. What moving averages can be used
The Moving Average Z-Score Suite allows users to select from the following eleven moving averages:
Simple Moving Average (SMA)
Hull Moving Average (HMA)
Exponential Moving Average (EMA)
Weighted Moving Average (WMA)
Double Exponential Moving Average (DEMA)
Running Moving Average (RMA)
Linear Regression Curve (LINREG) (This script can be found standalone )
Triple Exponential Moving Average (TEMA)
Arnaud Legoux Moving Average (ALMA)
Kalman Hull Moving Average (KHMA)
T3 Moving Average
Each of these moving averages has distinct properties and reacts differently to price changes, allowing traders to select the one that best fits their trading style and market conditions.
4. Why Turning a Moving Average into a Z-Score is Innovative and Its Benefits
Transforming a moving average into a Z-Score is an innovative approach because it normalizes the moving average values, making them more comparable across different periods and instruments. This normalization process helps in identifying extreme price movements and mean-reversion opportunities more effectively. By converting the moving average into a Z-Score, traders can better gauge the relative strength or weakness of a trend and detect potential reversals. This method enhances the traditional moving average analysis by adding a statistical perspective, providing clearer and more objective trading signals.
5. How It Can Be Used in the Context of a Trading System
In a trading system, it can be used to generate buy and sell signals based on the Z-Score values. When the Z-Score crosses above zero, it indicates a potential buying opportunity, suggesting that the price is above its mean and possibly trending upward. Conversely, a Z-Score crossing below zero signals a potential selling opportunity, indicating that the price is below its mean and might be trending downward. Additionally, the indicator's ability to show standard deviation levels and extreme levels helps traders set profit targets and stop-loss levels, improving risk management and trade planning.
6. How It Can Be Used for Trend Following
For trend-following strategies, it can be particularly useful. The Z-Score oscillator helps traders identify the strength and direction of a trend. By monitoring the Z-Score and its rate of change, traders can confirm the persistence of a trend and make informed decisions to enter or exit trades. The indicator's divergence detection feature further enhances trend-following by identifying potential reversals before they occur, allowing traders to capitalize on trend shifts. By providing a clear and quantifiable measure of trend strength, this indicator supports disciplined and systematic trend-following strategies.
No backtests for this indicator due to the many options and ways it can be used,
Enjoy
MA Optimizer Simplified [CHE]Introduction:
The MA Optimizer Simplified is a powerful tool for traders and analysts who want to compare and optimize various moving averages (MA). This tool is specifically designed to identify the best or worst performers among a variety of moving averages based on their cumulative performance.
Features and Benefits:
1. Versatility:
- Supports multiple types of moving averages, including:
- Simple Moving Average (SMA): A basic MA calculated by averaging the closing prices over a specified period.
- Exponential Moving Average (EMA): Gives more weight to recent prices, making it more responsive to new information.
- Weighted Moving Average (WMA): Assigns more weight to recent data, but in a linear fashion.
- Volume-Weighted Moving Average (VWMA): Averages prices based on volume, giving more importance to periods with higher trading volume.
- Hull Moving Average (HMA): Designed to reduce lag while improving smoothness.
- Smoothed Moving Average (SMMA or RMA): Averages prices over a longer period, providing a smoother line.
- Bollinger Bands: Uses SMA as a basis and adds upper and lower bands based on standard deviations.
- T3: A smoother and less lagging MA that reduces market noise.
- Allows users to easily switch between MA types and test different periods.
2. Performance Evaluation:
- Calculates the cumulative performance of up to ten different MAs.
- Automatically identifies the best or worst performer based on user selection (Best or Worst).
3. Crossover Detection:
- Detects crossovers of prices and MAs to measure performance.
- Provides clear visual signals when the price crosses a moving average.
4. Visual Representation:
- Plots the best MA indicator on the chart, dynamically changing its color based on price movement relative to the MA.
- Table functionality to display the performance of each MA, including the length and achieved performance in percentage.
5. Customizable Settings:
- Customizable settings for table size and position as well as colors for better visualization and user-friendliness.
- Flexibility in selecting the number of candles that must be above or below the MA before a signal is triggered.
Special Features:
1. T3 Indicator:
- The T3 indicator provides a smoother representation and reduces market noise, leading to more precise signals.
2. Crossover and Crossunder Logic:
- The script includes advanced logic for detecting crossover and crossunder events to identify accurate entry points.
3. Dynamic Color Change:
- The best MA indicator changes color based on the number of candles above or below the MA, helping to quickly recognize market sentiment.
4. Comprehensive Performance Analysis:
- The calculation of cumulative performance for each MA allows for detailed analysis and helps identify the most effective trading strategies.
Conclusion:
The MA Optimizer Simplified is an essential tool for any trader looking to analyze and optimize the performance of various moving averages. With its versatile features and user-friendly settings, it offers a comprehensive and efficient solution for technical analysis.
Best regards, Chervolino

RV - Relative Strength Index Buy/SellIntroduction
The RV - RSI B/S V1.2 indicator leverages the RSI to identify overbought and oversold conditions in the market. The RSI line color changes according to bullish, bearish, oversold, and overbought zones, helping users identify direction and avoid false trades. By plotting the RSI along with user-defined moving averages and Bollinger Bands, it offers a multi-faceted approach to analyzing market momentum.
Indicator Overview
The indicator RSI line color changes as per the bullish, bearish, oversold, and overbought zones. This helps users find out the direction and the zones. The oversold and overbought zones are colored to help users avoid false trades.
Trading Strategy
Long Trades (Bullish Setup):
Entry: A long trade is initiated when the RSI crosses from 60 up to 80.
Exit: Long trades are generally exited when the RSI is between 80 and 90.
Condition: No long trades are taken if the RSI exceeds 80.
Short Trades (Bearish Setup):
Entry: A short trade is initiated when the RSI crosses from 40 down to 20.
Exit: Short trades are generally exited when the RSI is between 20 and 10.
Condition: No short trades are taken if the RSI falls below 20.
RSI Color Coding and Interpretation
The RV - RSI B/S V1.2 indicator uses color coding to provide a visual representation of RSI values, making it easier to identify critical levels at a glance:
Green (RSI 60-80): Indicates a bullish zone where long trades can be considered.
Red (RSI > 80): Signals an overbought condition where long trades should be avoided.
Orange (RSI 20-40): Indicates a bearish zone where short trades can be considered.
Pink (RSI < 20): Signals an oversold condition where short trades should be avoided.
RSI Settings and Their Importance
RSI Length: The default length is set to 12, which is the standard period for RSI calculation. This setting can be adjusted to increase or decrease sensitivity.
Source: The source of the data for the RSI calculation is typically the closing price.
MA Type: Various moving averages can be applied to the RSI, including SMA, EMA, SMMA (RMA), WMA, and VWMA. Each type offers different smoothing properties and can be selected based on
trading preferences.
MA Length: The default length is set to 20, aligning with the RSI length for consistency.
Bollinger Bands: When using Bollinger Bands, the standard deviation multiplier is set to 2.0 by default, but it can be adjusted to suit different volatility conditions.
Disclaimer
This indicator provides valuable signals for potential trading opportunities based on RSI levels and moving averages. However, it is crucial to incorporate directional price action analysis to confirm signals and improve trading accuracy. The RV - RSI B/S V1.2 should be used as part of a broader trading strategy, considering other technical and fundamental factors.

Advanced Gold Scalping Strategy with RSI Divergence# Advanced Gold Scalping Strategy with RSI Divergence
## Overview
This Pine Script implements an advanced scalping strategy for gold (XAUUSD) trading, primarily designed for the 1-minute timeframe. The strategy utilizes the Relative Strength Index (RSI) indicator along with its moving average to identify potential trade setups based on divergences between price action and RSI movements.
## Key Components
### 1. RSI Calculation
- Uses a customizable RSI length (default: 60)
- Allows selection of the source for RSI calculation (default: close price)
### 2. Moving Average of RSI
- Supports multiple MA types: SMA, EMA, SMMA (RMA), WMA, VWMA, and Bollinger Bands
- Customizable MA length (default: 3)
- Option to display Bollinger Bands with adjustable standard deviation multiplier
### 3. Divergence Detection
- Implements both bullish and bearish divergence identification
- Uses pivot high and pivot low points to detect divergences
- Allows for customization of lookback periods and range for divergence detection
### 4. Entry Conditions
- Long Entry: Bullish divergence when RSI is below 40
- Short Entry: Bearish divergence when RSI is above 60
### 5. Trade Management
- Stop Loss: Customizable, default set to 11 pips
- Take Profit: Customizable, default set to 33 pips
### 6. Visualization
- Plots RSI line and its moving average
- Displays horizontal lines at 30, 50, and 70 RSI levels
- Shows Bollinger Bands when selected
- Highlights divergences with "Bull" and "Bear" labels on the chart
## Input Parameters
- RSI Length: Adjusts the period for RSI calculation
- RSI Source: Selects the price source for RSI (close, open, high, low, hl2, hlc3, ohlc4)
- MA Type: Chooses the type of moving average applied to RSI
- MA Length: Sets the period for the moving average
- BB StdDev: Adjusts the standard deviation multiplier for Bollinger Bands
- Show Divergence: Toggles the display of divergence labels
- Stop Loss: Sets the stop loss distance in pips
- Take Profit: Sets the take profit distance in pips
## Strategy Logic
1. **RSI Calculation**:
- Computes RSI using the specified length and source
- Calculates the chosen type of moving average on the RSI
2. **Divergence Detection**:
- Identifies pivot points in both price and RSI
- Checks for higher lows in RSI with lower lows in price (bullish divergence)
- Checks for lower highs in RSI with higher highs in price (bearish divergence)
3. **Trade Entry**:
- Enters a long position when a bullish divergence is detected and RSI is below 40
- Enters a short position when a bearish divergence is detected and RSI is above 60
4. **Position Management**:
- Places a stop loss order at the entry price ± stop loss pips (depending on the direction)
- Sets a take profit order at the entry price ± take profit pips (depending on the direction)
5. **Visualization**:
- Plots the RSI and its moving average
- Draws horizontal lines for overbought/oversold levels
- Displays Bollinger Bands if selected
- Shows divergence labels on the chart for identified setups
## Usage Instructions
1. Apply the script to a 1-minute XAUUSD (Gold) chart in TradingView
2. Adjust the input parameters as needed:
- Increase RSI Length for less frequent but potentially more reliable signals
- Modify MA Type and Length to change the sensitivity of the RSI moving average
- Adjust Stop Loss and Take Profit levels based on current market volatility
3. Monitor the chart for Bull (long) and Bear (short) labels indicating potential trade setups
4. Use in conjunction with other analysis and risk management techniques
## Considerations
- This strategy is designed for short-term scalping and may not be suitable for all market conditions
- Always backtest and forward test the strategy before using it with real capital
- The effectiveness of divergence-based strategies can vary depending on market trends and volatility
- Consider using additional confirmation signals or filters to improve the strategy's performance
Remember to adapt the strategy parameters to your risk tolerance and trading style, and always practice proper risk management.

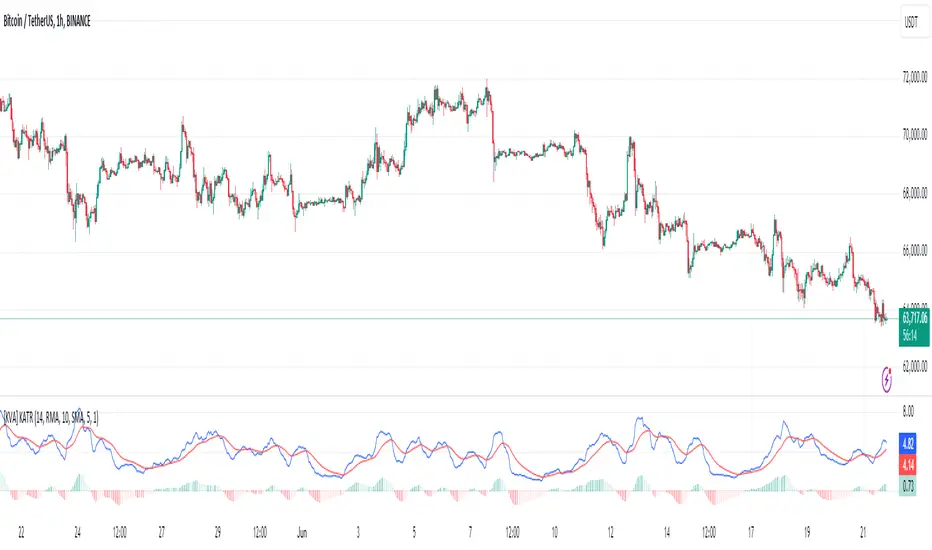
[KVA] KATRThe KATR indicator enhances the traditional ATR by leveraging the most common candle body percentage range, tailoring volatility measurement to specific market contexts. This advanced tool provides more relevant insights tailored to current market conditions.
Key Features:
Configurable ATR Length : Allows users to set the period for the ATR calculation, providing flexibility to adapt to different trading strategies and timeframes.
Multiple Smoothing Options : Offers a choice of RMA, SMA, EMA, and WMA for smoothing the ATR, enabling traders to select the method that best suits their analysis style.
Histogram Visualization for ATR Differences: The histogram visually represents the difference between the ATR and its moving average. This difference, or "dif," is calculated and smoothed, then multiplied by a user-defined factor. The histogram color indicates market conditions:
Light Red: Increasing but below zero, signaling potential weakening.
Light Green: Increasing and above zero, indicating strengthening.
Dark Green: Decreasing but above zero, showing potential weakening.
Dark Red: Decreasing and below zero, indicating strong weakening.
Ideal for Traders:
This indicator is perfect for traders seeking precise, context-sensitive volatility assessments to optimize trade timing and risk management strategies. Integrated seamlessly with other technical indicators, the KATR enhances your trading dashboard by adding depth to volatility analysis.
Detailed Explanation:
ATR Calculation: The ATR is derived by taking the average true range over a specified period, multiplied by the most common body percentage found in historical data.
Smoothing: Users can smooth the ATR using different methods, adding flexibility and customization to suit various trading styles.
Histogram: The histogram's primary function is to visualize the difference between the current ATR and its smoothed average. This provides clear, visual signals for potential volatility expansions or contractions, aiding in better decision-making.
Whether you're a day trader or a long-term investor, the KATR helps you stay ahead of market trends with reliable and easy-to-interpret insights. Elevate your trading strategy with the KATR's innovative approach to volatility measurement.