VAWSI and Trend Persistance Reversal Strategy SL/TPThis is a completely revamped version of my "RSI and ATR Trend Reversal Strategy."
What's New?
The RSI has been replaced with an original indicator of mine, the "VAWSI," as I've elected to call it.
The standard RSI measures a change in an RMA to determine the strength of a movement.
The VAWSI performs very similarly, except it uses another original indicator of mine, the VAWMA.
VAWMA stands for "Volume (and) ATR Weight Moving Average." It takes an average of the volume and ATR and uses the ratio of each bar to weigh a moving average of the source.
It has the same formula as an RSI, but uses the VAWMA instead of an RMA.
Next we have the Trend Persistence indicator, which is an index on how long a trend has been persisting for. It is another original indicator. It takes the max deviation the source has from lowest/highest of a specified length. It then takes a cumulative measure of that amount, measures the change, then creates a strength index with that amount.
The VAWSI is a measure of an emerging trend, and the Trend Persistence indicator is a measure of how long a trend has persisted.
Finally, the 3rd main indicator, is a slight variation of an ATR. Rather than taking the max of source - low or high- source and source - source , it instead takes the max of high-low and the absolute value of source - the previous source. It then takes the absolute value of the change of this, and normalizes it with the source.
Inputs
Minimum SL/TP ensures that the Stop Loss and Take Profit still exist in untrendy markets. This is the minimum Amount that will always be applied.
VAWSI Weight is a divided by 100 multiplier for the VAWSI. So value of 200 means it is multiplied by 2. Think of it like a percentage.
Trend Persistence weight and ATR Weight are applied the same. Higher the number, the more impactful on the final calculation it is.
Combination Mult is an outright multiplier to the final calculation. So a 2.0 = * 2.0
Trend Persistence Smoothing Length is the length of the weighted moving average applied to the Trend Persistence Strength index.
Length Cycle Decimal is a replacement of length for the script.
Here we used BlackCat1402's Dynamic Length Calculation, which can be found on his page. With his permission we have implemented it into this script. Big shout out to them for not only creating, but allowing us to use it here.
The Length Cycle Decimal is used to calculate the dynamic length. Because TradingView only allows series int for their built-in library, a lot of the baseline indicators we use have to be manually recreated as functions in the following section.
The Strategy
As usual, we use Heiken Ashi values for calculations.
We begin by establishing the minimum SL/TP for use later.
Next we determine the amount of bars back since the last crossup or crossdown of our threshold line.
We then perform some normalization of our multipliers. We want a larger trend or larger VAWSI amount to narrow the threshold, so we have 1 divide them. This way, a higher reading outputs a smaller number and vice versa. We do this for both Trend Persistence, and the VAWSI.
The VAWSI we also normalize, where rather than it being a 0-100 reading of trend direction and strength, we absolute it so that as long as a trend is strong, regardless of direction, it will have a higher reading. With these normalized values, we add them together and simply subtract the ATR measurement rather than having 1 divide it.
Here you can see how the different measurements add up. A lower final number suggests imminent reversal, and a higher final number suggests an untrendy or choppy market.
ATR is in orange, the Trend Persistence is blue, the VAWSI is purple, and the final amount is green.
We take this final number and depending on the current trend direction, we multiply it by either the Highest or Lowest source since the last crossup or crossdown. We then take the highest or lowest of this calculation, and have it be our Stop Loss or Take Profit. This number cannot be higher/lower than the previous source to ensure a rapid spike doesn't immediately close your position on a still continuing trend. As well, the threshold cannot be higher/ lower than the the specified Stop Loss and Take Profit
Only after the source has fully crossed these lines do we consider it a crossup or crossdown. We confirm this with a barstate.isconfirmed to prevent repainting. Next, each time there is a crossup or crossdown we enter a long or a short respectively and plot accordingly.
I have the strategy configured to "process on order close" to ensure an accurate backtesting result. You could also set this to false and add a 1 bar delay to the "if crossup" and "if crossdown" lines under strategy so that it is calculated based on the open of the next bar.
Final Notes
The amounts have been preconfigured for performance on RIOT 5 Minute timeframe. Other timeframes are viable as well. With a few changes to the parameters, this strategy has backtested well on NVDA, AAPL, TSLA, and AMD. I recommend before altering settings to try other timeframes first.
This script does not seem to perform nearly as well in typically untrendy and choppy markets such as crypto and forex. With some setting changes, I have seen okay results with crypto, but overfitting could be the cause there.
Thank you very much, and please enjoy.
Cerca negli script per "rma"

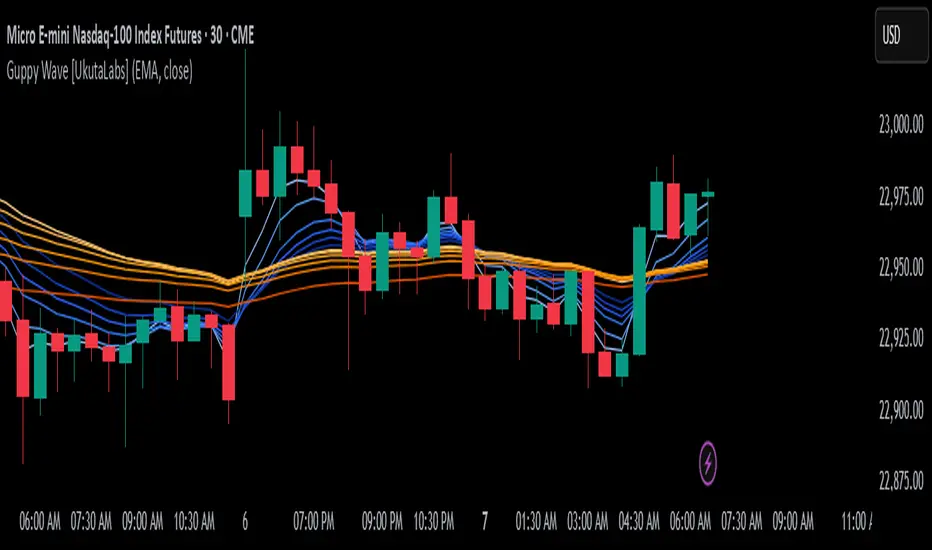
Guppy Wave [UkutaLabs]█ OVERVIEW
The Guppy Wave Indicator is a collection of Moving Averages that provide insight on current market strength. This is done by plotting a series of 12 Moving Averages and analysing where each one is positioned relative to the others.
In doing this, this script is able to identify short-term moves and give an idea of the current strength and direction of the market.
The aim of this script is to simplify the trading experience of users by automatically displaying a series of useful Moving Averages to provide insight into short-term market strength.
█ USAGE
The Guppy Wave is generated using a series of 12 total Moving Averages composed of 6 Small-Period Moving Averages and 6 Large Period Moving Averages. By measuring the position of each moving average relative to the others, this script provides unique insight into the current strength of the market.
Rather than simply plotting 12 Moving Averages, a color gradient is instead drawn between the Moving Averages to make it easier to visualise the distribution of the Guppy Wave. The color of this gradient changes depending on whether the Small-Period Averages are above or below the Large-Period Averages, allowing traders to see current short-term market strength at a glance.
When the gradient fans out, this indicates a rapid short-term move. When the gradient is thin, this indicates that there is no dominant power in the market.
█ SETTINGS
• Moving Average Type: Determines the type of Moving Average that get plotted (EMA, SMA, WMA, VWMA, HMA, RMA)
• Moving Average Source: Determines the source price used to calculate Moving Averages (open, high, low, close, hl2, hlc3, ohlc4, hlcc4)
• Bearish Color: Determines the color of the gradient when Small-Period MAs are above Large-Period MAs.
• Bullish Color: Determines the color of the gradient when Small-Period MAs are below Large-Period MAs.
Fibonacci Moving Averages [UkutaLabs]█ OVERVIEW
The Fibonacci Moving Averages are a toolkit which allows the user to configure different types of Moving Averages based on key Fibonacci numbers.
Moving Averages are used to visualise short-term and long-term support and resistance which can be used as a signal where price might continue or retrace. Moving Averages serve as a simple yet powerful tool that can help traders in their decision-making and help foster a sense of where the price might be moving next.
The aim of this script is to simplify the trading experience of users by automatically displaying a series of useful Moving Averages, allowing the user to easily configure multiple at once depending on their trading style.
█ USAGE
This script will automatically plot 5 Moving Averages, each with a period of a key Fibonacci Level (5, 8, 13, 21 and 34).
Both the Source and Type of the Moving Averages can be configured by the user (see all options below under SETTINGS), making this a versatile trading tool that can provide value in a wide variety of trading styles.
█ SETTINGS
Configuration
• MA Source: Determines the source of the Moving Averages (open, high, low, close, hl2, hlc3, ohlc4, hlcc4)
• MA Source: Determines the type of the Moving Averages (SMA, EMA, VWMA, WMA, HMA, RMA)
Colors
• 5: Determines the color of the 5 period Moving Average
• 8: Determines the color of the 8 period Moving Average
• 13: Determines the color of the 13 period Moving Average
• 21: Determines the color of the 21 period Moving Average
• 34: Determines the color of the 34 period Moving Average

Simplified MA Crossover indicatorThis is my first script, it is really simple logic and you probably saw something similar before. Is a crossover indicator between 2 Moving Average, one fast MA and the second slow MA.
Inputs you can adjust:
- 8 different source of MA's
- lenght of the MA's
- 7 different types of MA's ("EMA", "SMA", "RMA", "WMA", "DEMA", "TEMA", "HMA")
- 3 smoothing level of the fast MA
- plotting fast MA into the chart
- plotting crossover triangle shapes
I really enjoed the creation of this simple concept indicator, maybe not the fastest because of his nature but I liked work on it. I am sure is a good base to improve, study and try new idea.
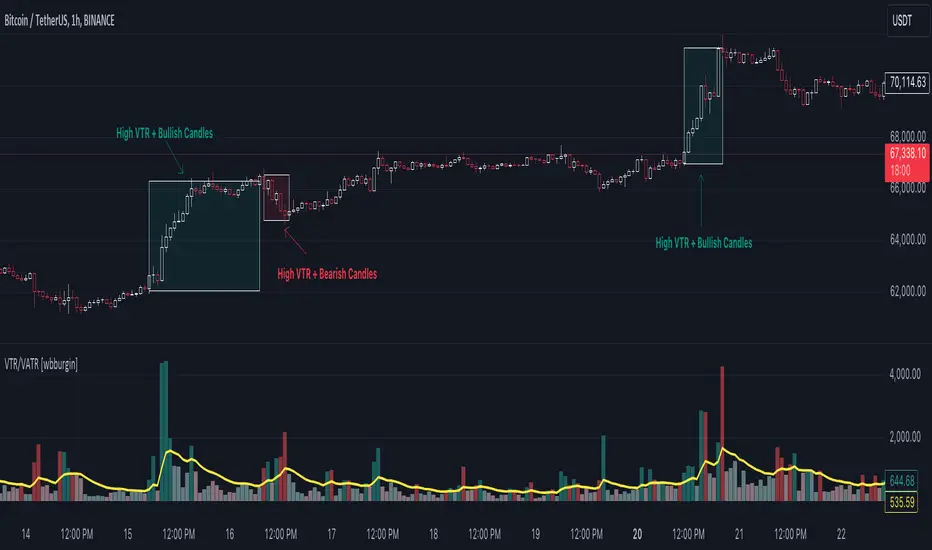
Volume True Range (VTR) and Volume Average True Range (VATR)This indicator uses lower-timeframe cumulative volume delta (CVD) candles to calculate the Volume True Range (VTR) of your instrument. The VTR is calculated similarly to the traditional true range, but uses volume instead (no price is involved in the calculation other than in the lower timeframe bar delta assignments). I haven't seen this concept developed before on TradingView or frankly the Internet, but I thought it seemed fairly intuitive; we can calculate the lower timeframe volume delta candles, so it makes sense to calculate a volume true range, which could show divergences in volume and price.
The VTR is calculated by the following code which uses the lower-timeframe CVD candles:
volumeTR = math.max(cvd_high - cvd_low, math.abs(cvd_high - nz(cvd_close )), math.abs(cvd_low - nz(cvd_close )))
The Volume Average True Range (VATR) is calculated by taking the RMA of the VTR, similarly to the ATR.
I would like to thank TradingView for the calculation of up/down intrabar volumes, which I referenced from their 'CVD - Cumulative Volume Delta Candles' indicator.
How to Use
The VTR and VATR can be used to identify price-volume trends and volatility divergences. A strong VTR (above the VATR of your specified length) can indicate the start or continuation of a trend, which you can identify via the VTR color (determined via price candle colors). Similarly, a rising VATR with most VTR bars of a specific color (green or red) will show that volume is moving in a specific price direction.
Additionally, the VATR plotted next to the ATR of the same length will show you volume volatility divergences. A strong VATR next to a muted/flat ATR indicates strong volume movement, which price might follow in the upcoming bars. Or, for trend reversals, a decreasing ATR after a strong trend combined with a rising VATR of the opposite trend may show a possible reversal.
Hope you all enjoy this.
-wbburgin
* Quick note: lower timeframe analysis returns only so much data. If you are on a high timeframe and the indicator is showing only a limited amount of bars, raise the lower timeframe (but still keep it below your current timeframe) so that the arrays can return more bars for you.
Multi-Chart Widget [LuxAlgo]The Multi-Chart Widget tool is a comprehensive solution crafted for traders and investors looking to analyze multiple financial instruments simultaneously. With the capability to showcase up to three additional charts, users can customize each chart by selecting different financial instruments, and timeframes.
Users can add various widely used technical indicators to the charts such as the relative strength index, Supertrend, moving averages, Bollinger Bands...etc.
🔶 USAGE
The tool offers traders and investors a comprehensive view of multiple charts simultaneously. By displaying up to three additional charts alongside the primary chart, users can analyze assets across different timeframes, compare their performance, and make informed decisions.
Users have the flexibility to choose from various customizable chart types, including the recently added "Volume Candles" option.
This tool allows adding to the chart some of the most widely used technical indicators, such as the Supertrend, Bollinger Bands, and various moving averages.
In addition to the charting capabilities, the tool also features a dynamic statistic panel that provides essential metrics and key insights into the selected assets. Users can track performance indicators such as relative strength, trend, and volatility, enabling them to identify trends, patterns, and trading opportunities efficiently.
🔶 DETAILS
A brief overview of the indicators featured in the statistic panel is given in the sub-section below:
🔹Dual Supertrend
The Dual Supertrend is a modified version of the Supertrend indicator, which is based on the concept of trend following. It generates buy or sell signals by analyzing the asset's price movement. The Dual Supertrend incorporates two Supertrend indicators with different parameters to provide potentially more accurate signals. It helps traders identify trend reversals and establish trend direction in a more responsive manner compared to a single Supertrend.
🔹Relative Strength Index
The Relative Strength Index is a momentum oscillator that measures the speed and change of price movements. RSI oscillates between 0 and 100 and is typically used to identify overbought or oversold conditions in a market. Traditionally, RSI values above 70 are considered overbought, suggesting that the asset may be due for a reversal or correction, while RSI values below 30 are considered oversold, indicating potential buying opportunities.
🔹Volatility
Volatility in trading refers to the degree of variation or fluctuation in the price of a financial instrument, such as a stock, currency pair, or commodity, over a certain period of time. It is a measure of the speed and magnitude of price changes and reflects the level of uncertainty or risk in the market. High volatility implies that prices are experiencing rapid and significant movements, while low volatility suggests that prices are relatively stable and are not changing much. Traders often use volatility as an indicator to assess the potential risk and return of an investment and to make informed decisions about when to enter or exit trades.
🔹R-Squared (R²)
R-squared, also known as the coefficient of determination, is a statistical measure that indicates the proportion of the variance in the dependent variable that is predictable from the independent variable(s). In other words, it quantifies the goodness of fit of a regression model to the observed data. R-squared values range from %0 to %100, with higher values indicating a better fit of the model to the data. An R-squared of 100% means that all movements of a security are completely explained by movements in the index, while an R-squared value of %0 indicates that the model does not explain any of the variability in the dependent variable.
In simpler terms, in investing, a high R-squared, from 85% to 100%, indicates that the stock’s or fund’s performance moves relatively in line with the index. Conversely, a low R-squared (around 70% or less) indicates that the fund's performance tends to deviate significantly from the movements of the index.
🔶 SETTINGS
🔹Mini Chart(s) Generic Settings
Mini Charts Separator: This option toggles the visibility of the separator lines.
Number Of Bars: Specifies the number of bars to be displayed for each mini chart.
Horizontal Offset: Determines the distance at which the mini charts will be displayed from the primary chart.
🔹Mini Chart Settings: Top - Middle - Bottom
Mini Chart Top/Middle/Bottom: Toggle the visibility of the selected mini chart.
Symbol: Choose the financial instrument to be displayed in the mini chart. If left as an empty string, it will default to the current chart instrument.
Timeframe: This option determines the timeframe used for calculating the mini charts. If a timeframe lower than the chart's timeframe is selected, the calculations will be based on the chart's timeframe.
Chart Type: Selection from various chart types for the mini charts, including candles, volume candles, line, area, columns, high-low, and Heikin Ashi.
Chart Size: Determines the size of the mini chart.
Technical Indicator: Selection from various technical indicators to be displayed on top of the mini charts.
Note : Chart sizing is relative to other mini charts. For example, If all the mini charts are sized to x5 relative to each other, the result will be the same as if they were all sized as x1. This is because the relative proportions between the mini charts remain consistent regardless of their absolute sizes. Therefore, their positions and sizes relative to each other remain unchanged, resulting in the same visual representation despite the differences in absolute scale.
🔹Supertrend Settings
ATR Length: is the lookback length for the ATR calculation.
Factor: is what the ATR is multiplied by to offset the bands from price.
Color: color customization option.
🔹Moving Average Settings
Type: is the type of the moving average, available types of moving averages include SMA (Simple Moving Average), EMA (Exponential Moving Average), RMA (Root Mean Square Moving Average), HMA (Hull Moving Average), WMA (Weighted Moving Average), and VWMA (Volume Weighted Moving Average).
Source: Determines what data from each bar will be used in calculations.
Length: The time period to be used in calculating the Moving Average.
Color: Color customization option.
🔹Bollinger Bands Settings
Basis Type: Determines the type of Moving Average that is applied to the basis plot line.
Source: Determines what data from each bar will be used in calculations.
Length: The time period to be used in calculating the Moving Average which creates the base for the Upper and Lower Bands.
StdDev: The number of Standard Deviations away from the Moving Average that the Upper and Lower Bands should be.
Color: Color customization options for basis, upper and lower bands.
🔹Mini Chart(s) Panel Settings
Mini Chart(s) Panel: Controls the visibility of the panel containing the mini charts.
Dual Supertrend: Toggles the display of the evaluated dual super trend, based on the super trend settings provided below the option. The definitions for the options are the same as stated above for the super trend.
Relative Strength Index: Toggles the display of the evaluated RSI, based on the source and length settings provided below the option.
Volatility: Toggles the display of the calculated Volatility, based on the length settings provided below the option.
R-Squared: Toggles the display of the calculated R-Squared (R²), based on the length settings provided below the option.
🔶 LIMITATIONS
The tool allows users to display mini charts featuring various types of instruments alongside the primary chart instrument. However, there's a limitation: the selected primary chart instrument must have an ACTIVE market status. Alternatively, if the primary chart instrument is not active, the mini chart instruments must belong to the same exchange and have the same type as the primary chart instrument.

Institutional Activity Index [AlgoAlpha]🌟 Introducing the Institutional Activity Index by AlgoAlpha 🌟
Welcome to a powerful new indicator designed to gauge institutional trading activity! This cutting-edge tool combines volume analysis with price movement to derive a unique index that shines a spotlight on potential institutional moves in the market. 🎯📈
Key Features:
🔍 Normalization Period : Adjust the look-back period for normalization to tailor the sensitivity to your trading strategy.
📊 Moving Average Types : Choose from SMA, HMA, EMA, RMA, WMA, or VWMA to smooth the index and pinpoint trends.
🌈 Color-Coded Trends : Instant visual feedback on index trend direction with customizable up and down colors.
🔔 Alerts : Set alerts for when the index shows increasing activity, decreasing activity, or has reached a peak.
Quick Guide to Using the Institutional Activity Index:
1. 📝 Add the Indicator: Add the indicator to favorites. Adjust the normalization period, MA type, and peak detection settings to match your trading style.
2. 📈 Market Analysis: Similar to volume that reflects the amount of collective trading activity, this index reflects an estimate of the amount of trading activity by institutions. A higher value means that institutions are trading the asset more, this can mean selling or buying as the indicator does not indicate direction . Look out for peak signals, which may indicate that institutions have already secured positions in preparation for a move in price.
3. 🔔 Set Alerts: Enable alerts to notify you when there is a significant change in the activity levels or a new peak is detected, allowing for timely decisions without constant monitoring.
How It Works: 🛠
It is common knowledge that institutions trade with high amounts of capital, but employ tactics so as to not move the price significantly when entering on positions. This can be done by entering in times of high liquidity so that when an institution buys, there are enough sellers to cancel out the price movements and prevent a huge pump in price and vice versa. The Institutional Activity Index calculates liquidity by measuring the volume relative to the price range (close-open). This value is smoothed using median and a user defined moving average type and period, enhancing its clarity. If normalization is enabled, the index is adjusted relative to its range over a user-defined period, making the data comparable across different conditions.
Embrace this innovative tool to enhance your trading insights and strategies! 🚀✨

AminioLibraryLibrary "AminioLibrary"
: this is my personal library that is being used in different indicators and strategies
calculateMA(source, len, maType)
This fuction returns a moving average value based on the type
Parameters:
source (float) : Is the time series source to calculate average from
len (simple int) : The length of the moving average, this should be integer
maType (string) : The type of moving average, acceptable types are : SMA, HMA, EMA, RMA, WMA, VWMA
Returns: value of moving average
atr(source, len)
This fuction returns atr value for a given source
Parameters:
source (float) : Is the time series source to calculate atr from
len (simple int) : The length of the atr, this should be integer
Returns: value of atr from source
superTrend(source, factor, len)
This fuction returns value of super trend indicator and the trend direction as a tupple
Parameters:
source (float) : Is the time series source to calculate super trend from
factor (simple float) : The multiplication factor for upper and lower band calcualtion, this can be a float
len (simple int) : The length of the super trend, this should be integer
Returns: value of atr from source
halfTrend(am, chdev)
This fuction returns a hTrend type carrying different values for half trend indicator
Parameters:
am (int) : This is the amplitude used for calcucating the half trend, use integers
chdev (float) : This is the Channel Deviation value used for calculating upper and lower atr channel boundaries, you can use floats
Returns: hTrend data type
hTrend
Fields:
halfTrend (series__float)
trend (series__integer)
atrHigh (series__float)
atrLow (series__float)
arrowUp (series__float)
arrowDown (series__float)

Uptrick: RSI MA Buying/Selling signalsIndicator Purpose:
This indicator, titled "Uptrick: RSI MA Buying/Selling signals" or "UpRSIMA," aims to provide buying and selling signals based on the Moving Average (MA) of the Relative Strength Index (RSI).
It plots the RSI MA line and highlights whether the RSI MA value is above or below 50, indicating potential bullish or bearish signals, respectively.
RSI Calculation:
The script calculates the RSI using a user-defined length parameter (default is 14) and a specified source (typically the closing price).
It then computes the MA of the RSI using the Recursive Moving Average (RMA) function applied to the RSI values.
Color Representation:
The color of the RSI MA line is determined based on whether it's above or below the neutral level of 50.
If the RSI MA is above 50, indicating potential bullish signals, the color is set to green; otherwise, it's set to red for potential bearish signals.
Plotting:
The RSI MA line is plotted on the chart with the specified color based on its value relative to 50.
Additionally, a horizontal line is drawn at y = 50 to visually represent the neutral level.
Histogram bars are also added to visually represent the difference between the RSI MA and the neutral level, with green bars indicating bullish signals and red bars indicating bearish signals.
User Interface:
The indicator is designed to be used as an overlay on price charts, allowing traders to easily visualize potential buying and selling signals based on RSI MA crossovers and levels relative to 50.
Overall, the "Uptrick: RSI MA Buying/Selling signals" indicator offers traders insights into potential trend reversals or continuations based on the moving average of the Relative Strength Index, aiding them in making informed trading decisions.

Fibonacci Trend Reversal StrategyIntroduction
This publication introduces the " Fibonacci Retracement Trend Reversal Strategy, " tailored for traders aiming to leverage shifts in market momentum through advanced trend analysis and risk management techniques. This strategy is designed to pinpoint potential reversal points, optimizing trading opportunities.
Overview
The strategy leverages Fibonacci retracement levels derived from @IMBA_TRADER's lance Algo to identify potential trend reversals. It's further enhanced by a method called " Trend Strength Over Time " (TSOT) (by @federalTacos5392b), which utilizes percentile rankings of price action to measure trend strength. This also has implemented Dynamic SL finder by utilizing @veryfid's ATR Stoploss Finder which works pretty well
Indicators:
Fibonacci Retracement Levels : Identifies critical reversal zones at 23.6%, 50%, and 78.6% levels.
TSOT (Trend Strength Over Time) : Employs percentile rankings across various timeframes to gauge the strength and direction of trends, aiding in the confirmation of Fibonacci-based signals.
ATR (Average True Range) : Implements dynamic stop-loss settings for both long and short positions, enhancing trade security.
Strategy Settings :
- Sensitivity: Set default at 18, adjustable for more frequent or sparse signals based on market volatility.
- ATR Stop Loss Finder: Multiplier set at 3.5, applying the ATR value to determine stop losses dynamically.
- ATR Length: Default set to 14 with RMA smoothing.
- TSOT Settings: Hard-coded to identify percentile ranks, with no user-adjustable inputs due to its intrinsic calculation method.
Trade Direction Options : Configurable to support long, short, or both directions, adaptable to the trader's market assessment.
Entry Conditions :
- Long Entry: Triggered when the price surpasses the mid Fibonacci level (50%) with a bullish TSOT signal.
- Short Entry: Activated when the price falls below the mid Fibonacci level with a bearish TSOT indication.
Exit Conditions :
- Employs ATR-based dynamic stop losses, calibrated according to current market volatility, ensuring effective risk management.
Strategy Execution :
- Risk Management: Features adjustable risk-reward settings and enables partial take profits by default to systematically secure gains.
- Position Reversal: Includes an option to reverse positions based on new TSOT signals, improving the strategy's responsiveness to evolving market conditions.
The strategy is optimized for the BYBIT:WIFUSDT.P market on a scalping (5-minute) timeframe, using the default settings outlined above.
I spent a lot of time creating the dynamic exit strategies for partially taking profits and reversing positions so please make use of those and feel free to adjust the settings, tool tips are also provided.
For Developers: this is published as open-sourced code so that developers can learn something especially on dynamic exits and partial take profits!
Good Luck!
Disclaimer
This strategy is shared for educational purposes and must be thoroughly tested under diverse market conditions. Past performance does not guarantee future results. Traders are advised to integrate this strategy with other analytical tools and tailor it to specific market scenarios. I was only sharing what I've crafted while strategizing over a Solana Meme Coin.

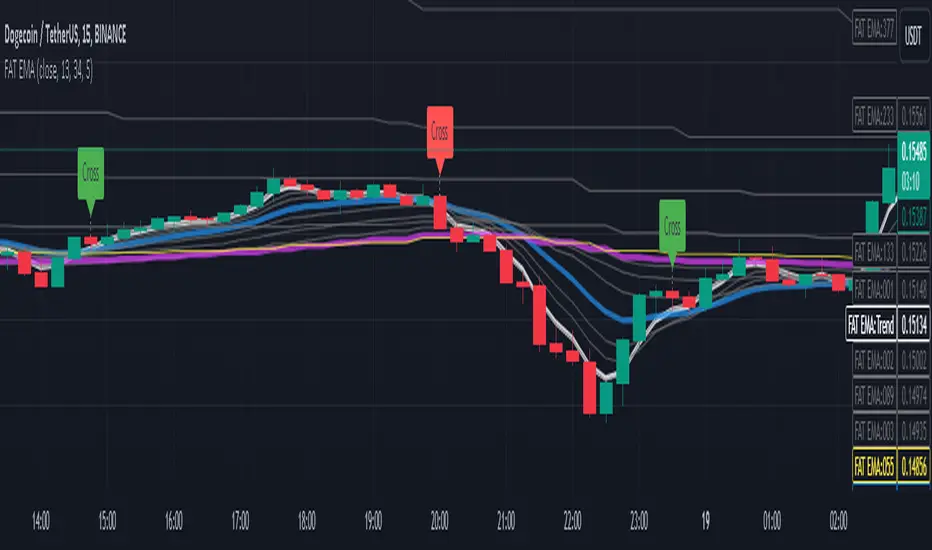
Fibonacci Adaptive Timeframe EMA (FAT EMA)The "Fibonacci Adaptive Timeframe EMA" is a sophisticated trading indicator designed for the TradingView platform, leveraging the power of Exponential Moving Averages (EMAs) determined by Fibonacci sequence lengths to provide traders with dynamic market insights. This indicator overlays directly on the price chart, offering a unique blend of trend analysis, smoothing techniques, and timeframe adaptability, making it an invaluable tool for traders looking to enhance their technical analysis strategy.
Key Features
1. Fibonacci-Based EMA Lengths: Utilizes the Fibonacci sequence to select EMA lengths, incorporating natural mathematical ratios believed to be significant in financial markets. The available lengths range from 1 to 987, allowing for detailed trend analysis over various periods.
2. Multiple Smoothing Methods: Offers the choice between several smoothing techniques, including Simple Moving Average (SMA), Exponential Moving Average (EMA), Smoothed Moving Average (SMMA or RMA), Weighted Moving Average (WMA), and Volume Weighted Moving Average (VWMA). This versatility ensures that users can tailor the indicator to suit their analytical preferences.
3. Timeframe Adaptability: Features the ability to fetch and calculate EMAs from different timeframes, providing a multi-timeframe analysis within a single chart view. This adaptability gives traders a broader perspective on market trends, enabling more informed decision-making.
4. Dynamic Visualization Options: Traders can customize the display to suit their analysis needs, including toggling the visibility of Fibonacci EMA lines, EMA prices, and smoothed EMA lines. Additionally, forecast lines can be projected into the future, offering speculative insights based on current trends.
5. Ema Tail Visualization: An innovative feature allowing for the visualization of the 'tail' or the continuation of EMA lines, which can be particularly useful for identifying trend persistence or reversal points.
6. User-friendly Customization: Through a series of input options, traders can easily adjust the source data, Fibonacci lengths, smoothing method, and visual aspects such as line colors and transparency, ensuring a seamless integration into any trading strategy.
Application and Use Cases
The "Fibonacci Adaptive Timeframe EMA" indicator is designed for traders who appreciate the significance of Fibonacci numbers in market analysis and seek a flexible tool to analyze trends across different timeframes. Whether it's for scalping, day trading, or long-term investing, this indicator can provide valuable insights into price dynamics, trend strengths, and potential reversal points. Its adaptability makes it suitable for various asset classes, including stocks, forex, commodities, and cryptocurrencies.
Fibonacci Timeframe Adaptive EMAThe "Fibonacci Timeframe Adaptive EMA" is a sophisticated trading indicator designed for the TradingView platform, leveraging the power of Exponential Moving Averages (EMAs) determined by Fibonacci sequence lengths to provide traders with dynamic market insights. This indicator overlays directly on the price chart, offering a unique blend of trend analysis, smoothing techniques, and timeframe adaptability, making it an invaluable tool for traders looking to enhance their technical analysis strategy.
Key Features
1. Fibonacci-Based EMA Lengths: Utilizes the Fibonacci sequence to select EMA lengths, incorporating natural mathematical ratios believed to be significant in financial markets. The available lengths range from 1 to 987, allowing for detailed trend analysis over various periods.
2. Multiple Smoothing Methods: Offers the choice between several smoothing techniques, including Simple Moving Average (SMA), Exponential Moving Average (EMA), Smoothed Moving Average (SMMA or RMA), Weighted Moving Average (WMA), and Volume Weighted Moving Average (VWMA). This versatility ensures that users can tailor the indicator to suit their analytical preferences.
3. Timeframe Adaptability: Features the ability to fetch and calculate EMAs from different timeframes, providing a multi-timeframe analysis within a single chart view. This adaptability gives traders a broader perspective on market trends, enabling more informed decision-making.
4. Dynamic Visualization Options: Traders can customize the display to suit their analysis needs, including toggling the visibility of Fibonacci EMA lines, EMA prices, and smoothed EMA lines. Additionally, forecast lines can be projected into the future, offering speculative insights based on current trends.
5. Ema Tail Visualization: An innovative feature allowing for the visualization of the 'tail' or the continuation of EMA lines, which can be particularly useful for identifying trend persistence or reversal points.
6. User-friendly Customization: Through a series of input options, traders can easily adjust the source data, Fibonacci lengths, smoothing method, and visual aspects such as line colors and transparency, ensuring a seamless integration into any trading strategy.
Application and Use Cases
The "Fibonacci Timeframe Adaptive EMA" indicator is designed for traders who appreciate the significance of Fibonacci numbers in market analysis and seek a flexible tool to analyze trends across different timeframes. Whether it's for scalping, day trading, or long-term investing, this indicator can provide valuable insights into price dynamics, trend strengths, and potential reversal points. Its adaptability makes it suitable for various asset classes, including stocks, forex, commodities, and cryptocurrencies.

Heikin Ashi RSI + OTT [Erebor]Relative Strength Index (RSI)
The Relative Strength Index (RSI) is a popular momentum oscillator used in technical analysis to measure the speed and change of price movements. Developed by J. Welles Wilder, the RSI is calculated using the average gains and losses over a specified period, typically 14 days. Here's how it works:
Description and Calculation:
1. Average Gain and Average Loss Calculation:
- Calculate the average gain and average loss over the chosen period (e.g., 14 days).
- The average gain is the sum of gains divided by the period, and the average loss is the sum of losses divided by the period.
2. Relative Strength (RS) Calculation:
- The relative strength is the ratio of average gain to average loss.
The RSI oscillates between 0 and 100. Traditionally, an RSI above 70 indicates overbought conditions, suggesting a potential sell signal, while an RSI below 30 suggests oversold conditions, indicating a potential buy signal.
Pros of RSI:
- Identifying Overbought and Oversold Conditions: RSI helps traders identify potential reversal points in the market due to overbought or oversold conditions.
- Confirmation Tool: RSI can be used in conjunction with other technical indicators or chart patterns to confirm signals, enhancing the reliability of trading decisions.
- Versatility: RSI can be applied to various timeframes, from intraday to long-term charts, making it adaptable to different trading styles.
Cons of RSI:
- Whipsaws: In ranging markets, RSI can generate false signals, leading to whipsaws (rapid price movements followed by a reversal).
- Not Always Accurate: RSI may give false signals, especially in strongly trending markets where overbought or oversold conditions persist for extended periods.
- Subjectivity: Interpretation of RSI levels (e.g., 70 for overbought, 30 for oversold) is somewhat subjective and can vary depending on market conditions and individual preferences.
Checking RSIs in Different Periods:
Traders often use multiple timeframes to analyze RSI for a more comprehensive view:
- Fast RSI (e.g., 8-period): Provides more sensitive signals, suitable for short-term trading and quick decision-making.
- Slow RSI (e.g., 32-period): Offers a smoother representation of price movements, useful for identifying longer-term trends and reducing noise.
By comparing RSI readings across different periods, traders can gain insights into the momentum and strength of price movements over various timeframes, helping them make more informed trading decisions. Additionally, divergence between fast and slow RSI readings may signal potential trend reversals or continuation patterns.
Heikin Ashi Candles
Let's consider a modification to the traditional “Heikin Ashi Candles” where we introduce a new parameter: the period of calculation. The traditional HA candles are derived from the open 01, high 00 low 00, and close 00 prices of the underlying asset.
Now, let's introduce a new parameter, period, which will determine how many periods are considered in the calculation of the HA candles. This period parameter will affect the smoothing and responsiveness of the resulting candles.
In this modification, instead of considering just the current period, we're averaging or aggregating the prices over a specified number of periods . This will result in candles that reflect a longer-term trend or sentiment, depending on the chosen period value.
For example, if period is set to 1, it would essentially be the same as traditional Heikin Ashi candles. However, if period is set to a higher value, say 5, each candle will represent the average price movement over the last 5 periods, providing a smoother representation of the trend but potentially with delayed signals compared to lower period values.
Traders can adjust the period parameter based on their trading style, the timeframe they're analyzing, and the level of smoothing or responsiveness they prefer in their candlestick patterns.
Optimized Trend Tracker
The "Optimized Trend Tracker" is a proprietary trading indicator developed by TradingView user ANIL ÖZEKŞİ. It is designed to identify and track trends in financial markets efficiently. The indicator attempts to smooth out price fluctuations and provide clear signals for trend direction.
The Optimized Trend Tracker uses a combination of moving averages and adaptive filters to detect trends. It aims to reduce lag and noise typically associated with traditional moving averages, thereby providing more timely and accurate signals.
Some of the key features and applications of the OTT include:
• Trend Identification: The indicator helps traders identify the direction of the prevailing trend in a market. It distinguishes between uptrends, downtrends, and sideways consolidations.
• Entry and Exit Signals: The OTT generates buy and sell signals based on crossovers and direction changes of the trend. Traders can use these signals to time their entries and exits in the market.
• Trend Strength: It also provides insights into the strength of the trend by analyzing the slope and momentum of price movements. This information can help traders assess the conviction behind the trend and adjust their trading strategies accordingly.
• Filter Noise: By employing adaptive filters, the indicator aims to filter out market noise and false signals, thereby enhancing the reliability of trend identification.
• Customization: Traders can customize the parameters of the OTT to suit their specific trading preferences and market conditions. This flexibility allows for adaptation to different timeframes and asset classes.
Overall, the OTT can be a valuable tool for traders seeking to capitalize on trending market conditions while minimizing false signals and noise. However, like any trading indicator, it is essential to combine its signals with other forms of analysis and risk management strategies for optimal results. Additionally, traders should thoroughly back-test the indicator and practice using it in a demo environment before applying it to live trading.
The following types of moving average have been included: "SMA", "EMA", "SMMA (RMA)", "WMA", "VWMA", "HMA", "KAMA", "LSMA", "TRAMA", "VAR", "DEMA", "ZLEMA", "TSF", "WWMA". Thanks to the authors.
Thank you for your indicator “Optimized Trend Tracker”. © kivancozbilgic
Thank you for your programming language, indicators and strategies. © TradingView
Kind regards.
© Erebor_GIT

Predictive Channel SignalsThis script is a comprehensive tool designed to enhance trading strategies by utilizing predictive channels, multiple moving average types, and dynamic signal generation. The script is meticulously crafted for traders who seek to identify potential support and resistance levels, anticipate market reversals, and optimize entry and exit points through advanced technical analysis featuring with the help of codes provided by LuxAlgo.
Core Features:
Dynamic Predictive Channels: The script calculates predictive channels based on price movements and volatility, represented by adjustable factors for sensitivity and slope. These channels adapt to changing market conditions, providing real-time support and resistance levels.
Versatile Moving Averages: Users can select from a variety of moving average types, including SMA, EMA, SMMA (RMA), HullMA, WMA, VWMA, DEMA, and TEMA. This flexibility allows traders to tailor the analysis to their specific strategy and market view.
Signal Generation: The script generates buying and selling signals based on the interaction between moving averages and predictive channels. Signals are categorized into low, mid, and high tiers, indicating the strength and potential risk/reward of the trade opportunity.
Visual Cues and Customization: With an emphasis on usability, the script offers customizable color schemes for easy interpretation of bullish and bearish zones, moving averages, and trading signals. Traders can quickly identify market trends and reversal points at a glance.
Advanced Calculations: Utilizing calculations such as the Average True Range (ATR) for volatility assessment, the script ensures that signals are both sensitive to market dynamics and robust against false positives.
Ideal for Traders Who:
Prefer a technical analysis approach with a focus on moving averages and price channels.
Desire a customizable tool that can adapt to different trading styles and market conditions.
Seek to enhance their trading strategy with predictive insights and actionable signals.
Circle = Entry Point
End of polyline = Stop Loss
1 Circle = Low Strength
2 Circles = Mid Strength
3 Circles = High Strength

Heikin Ashi TSI and OTT [Erebor]TSI (True Strength Index)
The TSI (True Strength Index) is a momentum-based trading indicator used to identify trend direction, overbought/oversold conditions, and potential trend reversals in financial markets. It was developed by William Blau and first introduced in 1991.
Here's how the TSI indicator is calculated:
• Double Smoothed Momentum (DM): This is calculated by applying double smoothing to the price momentum. First, the single smoothed momentum is calculated by subtracting the smoothed closing price from the current closing price. Then, this single smoothed momentum is smoothed again using an additional smoothing period.
• Absolute Smoothed Momentum (ASM): This is calculated by applying smoothing to the absolute value of the price momentum. Similar to DM, ASM applies a smoothing period to the absolute value of the difference between the current closing price and the smoothed closing price.
• TSI Calculation: The TSI is calculated as the ratio of DM to ASM, multiplied by 100 to express it as a percentage. Mathematically, TSI = (DM / ASM) * 100.
The TSI indicator oscillates around a centerline (typically at zero), with positive values indicating bullish momentum and negative values indicating bearish momentum. Traders often look for crossovers of the TSI above or below the centerline to identify shifts in momentum and potential trend reversals. Additionally, divergences between price and the TSI can signal weakening trends and potential reversal points.
Pros of the TSI indicator:
• Smoothed Momentum: The TSI uses double smoothing techniques, which helps to reduce noise and generate smoother signals compared to other momentum indicators.
• Versatility: The TSI can be applied to various financial instruments and timeframes, making it suitable for both short-term and long-term trading strategies.
• Trend Identification: The TSI is effective in identifying the direction and strength of market trends, helping traders to align their positions with the prevailing market sentiment.
Cons of the TSI indicator:
• Lagging Indicator: Like many momentum indicators, the TSI is a lagging indicator, meaning it may not provide timely signals for entering or exiting trades during rapidly changing market conditions.
• False Signals: Despite its smoothing techniques, the TSI can still produce false signals, especially during periods of low volatility or ranging markets.
• Subjectivity: Interpretation of the TSI signals may vary among traders, leading to subjective analysis and potential inconsistencies in trading decisions.
Overall, the TSI indicator can be a valuable tool for traders when used in conjunction with other technical analysis tools and risk management strategies. It can help traders identify potential trading opportunities and confirm trends, but it's essential to consider its limitations and incorporate additional analysis for more robust trading decisions.
Heikin Ashi Candles
Let's consider a modification to the traditional “Heikin Ashi Candles” where we introduce a new parameter: the period of calculation. The traditional HA candles are derived from the open , high low , and close prices of the underlying asset.
Now, let's introduce a new parameter, period, which will determine how many periods are considered in the calculation of the HA candles. This period parameter will affect the smoothing and responsiveness of the resulting candles.
In this modification, instead of considering just the current period, we're averaging or aggregating the prices over a specified number of periods . This will result in candles that reflect a longer-term trend or sentiment, depending on the chosen period value.
For example, if period is set to 1, it would essentially be the same as traditional Heikin Ashi candles. However, if period is set to a higher value, say 5, each candle will represent the average price movement over the last 5 periods, providing a smoother representation of the trend but potentially with delayed signals compared to lower period values.
Traders can adjust the period parameter based on their trading style, the timeframe they're analyzing, and the level of smoothing or responsiveness they prefer in their candlestick patterns.
Optimized Trend Tracker
The "Optimized Trend Tracker" is a proprietary trading indicator developed by TradingView user ANIL ÖZEKŞİ. It is designed to identify and track trends in financial markets efficiently. The indicator attempts to smooth out price fluctuations and provide clear signals for trend direction.
The Optimized Trend Tracker uses a combination of moving averages and adaptive filters to detect trends. It aims to reduce lag and noise typically associated with traditional moving averages, thereby providing more timely and accurate signals.
Some of the key features and applications of the OTT include:
• Trend Identification: The indicator helps traders identify the direction of the prevailing trend in a market. It distinguishes between uptrends, downtrends, and sideways consolidations.
• Entry and Exit Signals: The OTT generates buy and sell signals based on crossovers and direction changes of the trend. Traders can use these signals to time their entries and exits in the market.
• Trend Strength: It also provides insights into the strength of the trend by analyzing the slope and momentum of price movements. This information can help traders assess the conviction behind the trend and adjust their trading strategies accordingly.
• Filter Noise: By employing adaptive filters, the indicator aims to filter out market noise and false signals, thereby enhancing the reliability of trend identification.
• Customization: Traders can customize the parameters of the OTT to suit their specific trading preferences and market conditions. This flexibility allows for adaptation to different timeframes and asset classes.
Overall, the OTT can be a valuable tool for traders seeking to capitalize on trending market conditions while minimizing false signals and noise. However, like any trading indicator, it is essential to combine its signals with other forms of analysis and risk management strategies for optimal results. Additionally, traders should thoroughly back-test the indicator and practice using it in a demo environment before applying it to live trading.
The following types of moving average have been included: "SMA", "EMA", "SMMA (RMA)", "WMA", "VWMA", "HMA", "KAMA", "LSMA", "TRAMA", "VAR", "DEMA", "ZLEMA", "TSF", "WWMA". Thanks to the authors.
Thank you for your indicator “Optimized Trend Tracker”. © kivancozbilgic
Thank you for your programming language, indicators and strategies. © TradingView
Kind regards.
© Erebor_GIT
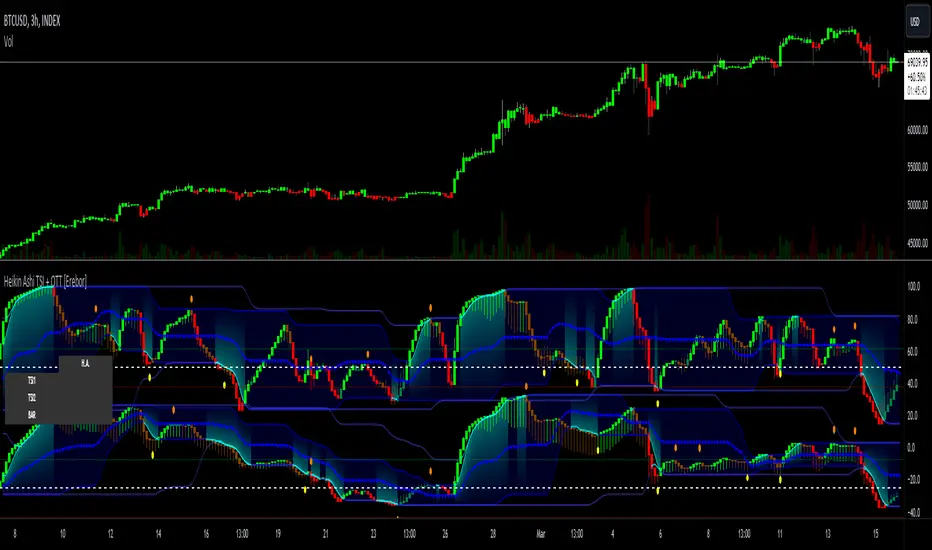
Heikin Ashi and Optimized Trend Tracker and PVSRA [Erebor]Heikin Ashi Candles
Let's consider a modification to the traditional “Heikin Ashi Candles” where we introduce a new parameter: the period of calculation. The traditional HA candles are derived from the open , high low , and close prices of the underlying asset.
Now, let's introduce a new parameter, period, which will determine how many periods are considered in the calculation of the HA candles. This period parameter will affect the smoothing and responsiveness of the resulting candles.
In this modification, instead of considering just the current period, we're averaging or aggregating the prices over a specified number of periods . This will result in candles that reflect a longer-term trend or sentiment, depending on the chosen period value.
For example, if period is set to 1, it would essentially be the same as traditional Heikin Ashi candles. However, if period is set to a higher value, say 5, each candle will represent the average price movement over the last 5 periods, providing a smoother representation of the trend but potentially with delayed signals compared to lower period values.
Traders can adjust the period parameter based on their trading style, the timeframe they're analyzing, and the level of smoothing or responsiveness they prefer in their candlestick patterns.
Optimized Trend Tracker
The "Optimized Trend Tracker" is a proprietary trading indicator developed by TradingView user ANIL ÖZEKŞİ. It is designed to identify and track trends in financial markets efficiently. The indicator attempts to smooth out price fluctuations and provide clear signals for trend direction.
The Optimized Trend Tracker uses a combination of moving averages and adaptive filters to detect trends. It aims to reduce lag and noise typically associated with traditional moving averages, thereby providing more timely and accurate signals.
Some of the key features and applications of the OTT include:
• Trend Identification: The indicator helps traders identify the direction of the prevailing trend in a market. It distinguishes between uptrends, downtrends, and sideways consolidations.
• Entry and Exit Signals: The OTT generates buy and sell signals based on crossovers and direction changes of the trend. Traders can use these signals to time their entries and exits in the market.
• Trend Strength: It also provides insights into the strength of the trend by analyzing the slope and momentum of price movements. This information can help traders assess the conviction behind the trend and adjust their trading strategies accordingly.
• Filter Noise: By employing adaptive filters, the indicator aims to filter out market noise and false signals, thereby enhancing the reliability of trend identification.
• Customization: Traders can customize the parameters of the OTT to suit their specific trading preferences and market conditions. This flexibility allows for adaptation to different timeframes and asset classes.
Overall, the OTT can be a valuable tool for traders seeking to capitalize on trending market conditions while minimizing false signals and noise. However, like any trading indicator, it is essential to combine its signals with other forms of analysis and risk management strategies for optimal results. Additionally, traders should thoroughly back-test the indicator and practice using it in a demo environment before applying it to live trading.
PVSRA (Price, Volume, S&R Analysis)
“PVSRA” (Price, Volume, S&R Analysis) is a trading methodology and indicator that combines the analysis of price action, volume, and support/resistance levels to identify potential trading opportunities in financial markets. It is based on the idea that price movements are influenced by the interplay between supply and demand, and analyzing these factors together can provide valuable insights into market dynamics.
Here's a breakdown of the components of PVSRA:
• Price Action Analysis: PVSRA focuses on analyzing price movements and patterns on price charts, such as candlestick patterns, trendlines, chart patterns (like head and shoulders, triangles, etc.), and other price-based indicators. Traders using PVSRA pay close attention to how price behaves at key support and resistance levels and look for patterns that indicate potential shifts in market sentiment.
• Volume Analysis: Volume is an essential component of PVSRA. Traders monitor changes in trading volume to gauge the strength or weakness of price movements. An increase in volume during a price move suggests strong participation and conviction from market participants, reinforcing the validity of the price action. Conversely, low volume during price moves may indicate lack of conviction and potential reversals.
• Support and Resistance (S&R) Analysis: PVSRA incorporates the identification and analysis of support and resistance levels on price charts. Support levels represent areas where buying interest is expected to be strong enough to prevent further price declines, while resistance levels represent areas where selling interest may prevent further price advances. These levels are often identified using historical price data, trendlines, moving averages, pivot points, and other technical analysis tools.
The PVSRA methodology combines these three elements to generate trading signals and make trading decisions. Traders using PVSRA typically look for confluence between price action, volume, and support/resistance levels to confirm trade entries and exits. For example, a bullish reversal signal may be considered stronger if it occurs at a significant support level with increasing volume.
It's important to note that PVSRA is more of a trading approach or methodology rather than a specific indicator with predefined rules. Traders may customize their analysis based on their preferences and trading style, incorporating additional technical indicators or filters as needed. As with any trading strategy, risk management and proper trade execution are essential components of successful trading with PVSRA.
The following types of moving average have been included: "SMA", "EMA", "SMMA (RMA)", "WMA", "VWMA", "HMA", "KAMA", "LSMA", "TRAMA", "VAR", "DEMA", "ZLEMA", "TSF", "WWMA". Thanks to the authors.
Thank you for your indicator “Optimized Trend Tracker”. © kivancozbilgic
Thank you for your indicator “PVSRA Volume Suite”. © creengrack
Thank you for your programming language, indicators and strategies. © TradingView
Kind regards.
© Erebor_GIT

Foxy's Logarithmic Bollinger BandsThis versatile indicator plots logarithmic Bollinger Bands on any financial asset or timeframe in the TradingView platform. Unlike traditional Bollinger Bands, which use simple arithmetic calculations, Foxy's LBB employs logarithmic scales to better capture and visualize percentage-based price movements.
The core functionality includes:
Basis Line: A central moving average line calculated on the log10 of the selected price source (default is close price). Multiple moving average types are available, including SMA, EMA, RMA, and volume-weighted variants.
Upper/Lower Bands 1: The first set of upper and lower bands, plotted at a user-defined number of standard deviations (default 2.0) above and below the Basis Line.
Upper/Lower Bands 2: A second set of bands plotted at a different standard deviation level (default 3.0) to cater to different volatility preferences.
Offset: An option to vertically offset the plotted lines for better visualization alongside other indicators or studies.
By using a logarithmic scale, Foxy's LBB provides a more accurate representation of percentage-based price changes, making it particularly useful for analyzing and trading volatile assets or markets with significant price swings.
Traders can leverage this indicator for various purposes, such as identifying potential overbought/oversold conditions, gauging volatility levels, and spotting trend continuations or reversals based on the interaction between price and the band levels.
Whether you're a seasoned trader or just starting, Foxy's LBB offers a powerful and flexible tool to enhance your technical analysis and decision-making process in the TradingView environment.

Composite Trend Oscillator [ChartPrime]CODE DUELLO:
Have you ever stopped to wonder what the underlying filters contained within complex algorithms are actually providing for you? Wouldn't it be nice to actually visually inspect for that? Those would require some kind of wild west styled quick draw duel or some comparison method as a proper 'code duello'. Then it can be determined which filter can 'draw' the quickest from it's computational holster with the least amount of lag and smoothness.
In Pine we can do so, discovering how beneficial that would be. This can be accomplished by quickly switching from one filter to another by input() back and forth, requiring visual memory. A better way could be done by placing two indicators added to the chart and then eventually placed into one indicator pane on top of each other.
By adding a filter() helper function that calls other moving average functions chosen for comparison, it can put to the test which moving average is the best drawing filter suited to our expected needs. PhiSmoother was formerly debuted and now it is utilized in a more complex environment in a multitude of ways along side other commonly utilized filters. Now, you the reader, get to judge for yourself...
FILTER VERSATILITY:
Having the capability to adjust between various smoothing methods such as PhiSmoother, TEMA, DEMA, WMA, EMA, and SMA on historical market data within the code provides an advantage. Each of these filter methods offers distinct advantages and hinderances. PhiSmoother stands out often by having superb noise rejection, while also being able to manipulate the fine-tuning of the phase or lag of the indicator, enhancing responsiveness to price movements.
The following are more well-known classic filters. TEMA (Triple Exponential Moving Average) and DEMA (Double Exponential Moving Average) offer reduced transient response times to price changes fluctuations. WMA (Weighted Moving Average) assigns more weight to recent data points, making it particularly useful for reduced lag. EMA (Exponential Moving Average) strikes a balance between responsiveness and computational efficiency, making it a popular choice. SMA (Simple Moving Average) provides a straightforward calculation based on the arithmetic mean of the data. VWMA and RMA have both been excluded for varying reasons, both being unworthy of having explanation here.
By allowing for adjustment refinements between these filter methods, traders may garner the flexibility to adapt their analysis to different market dynamics, optimizing their algorithms for improved decision-making and performance on demand.
INDICATOR INTRODUCTION:
ChartPrime's Composite Trend Oscillator operates as an oscillator based on the concept of a moving average ribbon. It utilizes up to 32 filters with progressively longer periods to assess trend direction and strength. Embedded within this indicator is an alternative view that utilizes the separation of the ribbon filaments to assess volatility. Both versions are excellent candidates for trend and momentum, both offering visualization of polarity, directional coloring, and filter crossings. Anyone who has former experience using RSI or stochastics may have ease of understanding applying this to their chart.
COMPOSITE CLUSTER MODES EXPLAINED:
In Trend Strength mode, the oscillator behavior signifies market direction and movement strength. When the oscillator is rising and above zero, the market is within a bullish phase, and visa versa. If the signal filter crosses the composite trend, this indicates a potential dynamic shift signaling a possible reversal. When the oscillator is teetering on its extremities, the market is more inclined to reverse later.
With Volatility mode, the oscillator undergoes a transformation, displaying an unbounded oscillator driven by market volatility. While it still employs the same scoring mechanism, it is now scaled according to the strength of the market move. This can aid with identification of ranging scenarios. However, one side effect is that the oscillator no longer has minimum or maximum boundaries. This can still be advantageous when considering divergences.
NOTEWORTHY SETTINGS FEATURES:
The following input settings described offer comprehensive control over the indicator's behavior and visualization.
Common Controls:
Price Source Selection - The indicator offers flexibility in choosing the price source for analysis. Traders can select from multiple options.
Composite Cluster Mode - Choose between "Trend Strength" and "Volatility" modes, providing insights into trend directionality or volatility weighting.
Cluster Filter and Length - Selects a filter for the cluster composition. This includes a length parameter adjustment.
Cluster Options:
Cluster Dispersion - Users can adjust the separation between moving averages in the cluster, influencing the sensitivity of the analysis.
Cluster Trimming - By modifying upper and lower trim parameters, traders can adjust the sensitivity of the moving averages within the cluster, enhancing its adaptability.
PostSmooth Filter and Length - Choose a filter to refine the composite cluster's post-smoothing with a length parameter adjustment.
Signal Filter and Length - Users can select a filter for the lagging signal plot, also having a length parameter adjustment.
Transition Easing - Sensitivity adjustment to influence the transition between bullish and bearish colors.
Enjoy

MA / Connectable [Azullian]Streamline trend analysis with the Moving Average indicator. Filter out market noise, aiding in the clear identification of market directions for dynamic strategy development.
This connectable moving average indicator is part of an indicator system designed to help test, visualize and build strategy configurations without coding. Like all connectable indicators , it interacts through the TradingView input source, which serves as a signal connector to link indicators to each other. All connectable indicators send signal weight to the next node in the system until it reaches either a connectable signal monitor, signal filter and/or strategy.
█ UNIFORM SETTINGS AND A WAY OF WORK
Although connectable indicators may have specific weight scoring conditions, they all aim to follow a standardized general approach to weight scoring settings, as outlined below.
■ Connectable indicators - Settings
• 🗲 Energy: Energy applies an ATR multiplier to the plotted shapes on the chart. A higher value plots shapes farther away from the candle, enhancing visibility.
• ☼ Brightness: Brightness determines the opacity of the shape plotted on the chart, aiding visibility. Indicator weight also influences opacity.
• → Input: Use the input setting to specify a data source for the indicator. Here you can connect the indicator to other indicators.
• ⌥ Flow: Determine where you want to receive signals from:
○ Both: Weights from this indicator and the connected indicator will apply
○ Indicator only: Only weights from this indicator will apply
○ Input only: Only weights from the connected indicator will apply
• ⥅ Weight multiplier: Multiply all weights in the entire indicator by a given factor, useful for quickly testing different indicators in a granular setup.
• ⥇ Threshold: Set a threshold to indicate the minimum amount of weight it should receive to pass it through to the next indicator.
• ⥱ Limiter: Set a hard limit to the maximum amount of weight that can be fed through the indicator.
■ Connectable indicators - Weight scoring settings
▢ Weight scoring conditions
• SM – Signal mode: Enable specific conditions for weight scoring
○ Start: A new trend starting will score
○ End: A trend ending will score
○ Zone: Continuous scoring for each candle between the start and the end.
• SP – Signal period: Defines a range of candles within which a signal can score.
• SC - Signal count: Specifies the number of bars to retrospectively examine and score.
○ Single: Score for a single occurrence
○ All occurrences: Score for all occurrences
○ Single + Threshold: Score for single occurrences within the signal period (SP)
○ Every + Threshold: Score for all occurrences within the signal period (SP)
▢ Weight scoring direction
• ES: Enter Short weight
• XL: Exit long weight
• EL: Enter Long weight
• XS: Exit Short weight
▢ Weight scoring values
• Weights can hold either positive or negative scores. Positive weights enhance a particular trading direction, while negative weights diminish it.
█ MA - INDICATOR SETTINGS
■ Main settings
• Enable/Disable Indicator: Toggle the entire indicator on or off.
• T - Type: Choose a type of moving average. (ALMA, EMA, HMA, RMA, SMA, SWMA, VWMA, WMA)
• L - Length: Set a period on which the moving average is calculated.
• F - Filter: Set a conditional filter for scoring:
○ Line direction: Score bullish when the trend line is going up, score bearish when the trendline is going down.
○ Line candle position: Score bullish when the candles are above the current trendline, score bearish when the candles are below the current trendline
○ Any: Score if any of the previously mentioned conditions are true
○ All: Score if all of the previously mentioned conditions are true
• S - Source: Choose an alternative data source for the Moving average calculation.
• T - Timeframe: Select an alternative timeframe for the Moving average calculation.
• C - Candletype: Choose a candletype for the alternative source.
■ Scoring functionality
• For each moving average you'll be able to score Bullish, Bearish or Neutral for each of the conditions as mentioned in the filter above.
█ PLOTTING
• Standard: Symbols (EL, XS, ES, XL) Moving average lines are plotted with bearish, bullish and neutral zones, in the visuals section you can enable plotting by weight which will only show the parts of the moving average line to which weight is addressed.
• Conditional Settings: A larger icon appears if global conditions are met. For instance, with a Threshold(⥇) of 12, Signal Period (SP) of 3, and Scoring Condition (SC) set to "EVERY", a moving average signaling over two times in 3 candles (scoring 6 each) triggers a larger icon.
█ USAGE OF CONNECTABLE INDICATORS
■ Connectable chaining mechanism
Connectable indicators can be connected directly to the signal monitor, signal filter or strategy , or they can be daisy chained to each other while the last indicator in the chain connects to the signal monitor, signal filter or strategy. When using a signal filter you can chain the filter to the strategy input to make your chain complete.
• Direct chaining: Connect an indicator directly to the signal monitor, signal filter or strategy through the provided inputs (→).
• Daisy chaining: Connect indicators using the indicator input (→). The first in a daisy chain should have a flow (⌥) set to 'Indicator only'. Subsequent indicators use 'Both' to pass the previous weight. The final indicator connects to the signal monitor, signal filter, or strategy.
■ Set up this indicator with a signal filter and strategy
The indicator provides visual cues based on signal conditions. However, its weight system is best utilized when paired with a connectable signal filter, signal monitor, or strategy .
Let's connect the MA to a connectable signal filter and a strategy :
1. Load all relevant indicators
• Load MA / Connectable
• Load Signal filter / Connectable
• Load Strategy / Connectable
2. Signal Filter: Connect the MA to the Signal Filter
• Open the signal filter settings
• Choose one of the three input dropdowns (1→, 2→, 3→) and choose : MA / Connectable: Signal Connector
• Toggle the enable box before the connected input to enable the incoming signal
3. Signal Filter: Update the filter signals settings if needed
• The default settings of the filter enable EL (Enter Long), XL (Exit Long), ES (Enter Short) and XS (Exit Short).
4. Signal Filter: Update the weight threshold settings if needed
• All connectable indicators load by default with a score of 6 for each direction (EL, XL, ES, XS)
• By default, weight threshold (TH) is set at 5. This allows each occurrence to score, as the default score in each connectable indicator is 1 point above the threshold. Adjust to your liking.
5. Strategy: Connect the strategy to the signal filter in the strategy settings
• Select a strategy input → and select the Signal filter: Signal connector
6. Strategy: Enable filter compatible directions
• Set the signal mode of the strategy to a compatible direction with the signal filter.
Now that everything is connected, you'll notice green spikes in the signal filter representing long signals, and red spikes indicating short signals. Trades will also appear on the chart, complemented by a performance overview. Your journey is just beginning: delve into different scoring mechanisms, merge diverse connectable indicators, and craft unique chains. Instantly test your results and discover the potential of your configurations. Dive deep and enjoy the process!
█ BENEFITS
• Adaptable Modular Design: Arrange indicators in diverse structures via direct or daisy chaining, allowing tailored configurations to align with your analysis approach.
• Streamlined Backtesting: Simplify the iterative process of testing and adjusting combinations, facilitating a smoother exploration of potential setups.
• Intuitive Interface: Navigate TradingView with added ease. Integrate desired indicators, adjust settings, and establish alerts without delving into complex code.
• Signal Weight Precision: Leverage granular weight allocation among signals, offering a deeper layer of customization in strategy formulation.
• Advanced Signal Filtering: Define entry and exit conditions with more clarity, granting an added layer of strategy precision.
• Clear Visual Feedback: Distinct visual signals and cues enhance the readability of charts, promoting informed decision-making.
• Standardized Defaults: Indicators are equipped with universally recognized preset settings, ensuring consistency in initial setups across different types like momentum or volatility.
• Reliability: Our indicators are meticulously developed to prevent repainting. We strictly adhere to TradingView's coding conventions, ensuring our code is both performant and clean.
█ COMPATIBLE INDICATORS
Each indicator that incorporates our open-source 'azLibConnector' library and adheres to our conventions can be effortlessly integrated and used as detailed above.
For clarity and recognition within the TradingView platform, we append the suffix ' / Connectable' to every compatible indicator.
█ COMMON MISTAKES, CLARIFICATIONS AND TIPS
• Removing an indicator from a chain: Deleting a linked indicator and confirming the "remove study tree" alert will also remove all underlying indicators in the object tree. Before removing one, disconnect the adjacent indicators and move it to the object stack's bottom.
• Point systems: The azLibConnector provides 500 points for each direction (EL: Enter long, XL: Exit long, ES: Enter short, XS: Exit short) Remember this cap when devising a point structure.
• Flow misconfiguration: In daisy chains the first indicator should always have a flow (⌥) setting of 'indicator only' while other indicator should have a flow (⌥) setting of 'both'.
• Hide attributes: As connectable indicators send through quite some information you'll notice all the arguments are taking up some screenwidth and cause some visual clutter. You can disable arguments in Chart Settings / Status line.
• Layout and abbreviations: To maintain a consistent structure, we use abbreviations for each input. While this may initially seem complex, you'll quickly become familiar with them. Each abbreviation is also explained in the inline tooltips.
• Inputs: Connecting a connectable indicator directly to the strategy delivers the raw signal without a weight threshold, meaning every signal will trigger a trade.
█ A NOTE OF GRATITUDE
Through years of exploring TradingView and Pine Script, we've drawn immense inspiration from the community's knowledge and innovation. Thank you for being a constant source of motivation and insight.
█ RISK DISCLAIMER
Azullian's content, tools, scripts, articles, and educational offerings are presented purely for educational and informational uses. Please be aware that past performance should not be considered a predictor of future results.

Broad market index / Flowly Indicators- Overview
Broad market index is a market breadth based oscillator, depicting broad market trend by analysing ratio between symbols moving up and symbols moving down in a given market. When market breadth is positive, more symbols are going up and when negative, more symbols are going down. As markets tend to correlate, broad market trend dictates likely path for all individual symbols that make up the market.
This tool provides market breadth for US equities (based on NYSE advancers - decliners) and ability to build two custom breadth baskets with up to 39 symbols included in each. Market breadth can be customized with variety of smoothing options, weighting and threshold modes to find most optimal rules for trend following. Performance of the model is reflected on metrics showing percentage of up/down moves during bullish/bearish states.
Example
↑ 63% = 63% of price moves during positive breadth state are to the upside
↓ 59% = 59% of price moves during negative breadth state are to the downside
Breadth state is colorized on line and chart according to its state (negative/positive/equilibrium) and direction (trending up/down). Upper and lower bands depict historical turning points in breadth for identifying extremes in broad market trend. Triangles mark breadth thrusts, in other words abnormally large moves in breadth at either upper or lower extreme. Breadth thrusts can serve as early signs of broad market trend reverting.
- Concept and features
By default, market breadth is calculated based on NYSE advancers - decliners, usable for all major indices that depict broad markets in US equities (SP500, QQQ, IWM). Users can also build 2 custom breadth baskets consisting of up to 39 symbols for defining broad market on other asset classes, such as cryptocurrencies. Custom baskets are suitable for any chart that fairly represents a market as a whole.
Example
Basket consisting of cryptocurrencies = Use on CRYPTOCAP:TOTAL (all cryptocurrencies aggregated)
Basket consisting of healthcare stocks = Use on AMEX:XLV (healthcare sector ETF)
Breadth line can be further refined using various smoothing options (SMA, EMA, HMA, RMA, WMA), threshold method and weights. By default, threshold (dividing line between bullish and bearish states) is set to fixed at 0, depicting an equilibrium where equal amount of symbols are going up and down.
Threshold mode can also be set to Dynamic, switching threshold to a moving average of the breadth line. Fundamental functionality still remains, breadth line above threshold marks bullish state and below threshold marks bearish state. Difference here is that the threshold no longer depicts a point of equilibrium, but simply a smoothed version of the breadth line itself, which can catch turns in broad market trend earlier.
Breadth basket can be adjusted to volatility of the viewed chart, causing an overstating of breadth on high volatility and understating on low volatility. Weighting takes into account magnitude of up/down moves, which can provide better relevance for trend following purposes.
- Practical guide
Example #1 : Broad market trend
The utility of market breadth is based on the idea that markets correlate and individual symbols making up the market will eventually join the broad market trend. With this in mind, going against broad market is like swimming upstream, it's going to be the hard way. A well performing basket with clear skew for upside and downside on respective breadth states can be used to form directional bias for trades and risk on/off regimes for investing.
Example #2 : Broad market reversals
Thrusts signify two things: a historical extreme in breadth and an aggressive move to the opposite direction. Thrusts are valuable clues for exhaustion in broad market trend, potentially leading to a reversal.
Example #3 : Breadth/price divergences
Market breadth and price diverging signify events where most symbols that make up the market are going one way but a few high weight symbols (big tech for SP500) are going the other way. In other words, only a few symbols are moving the market while general interest and intention is to the other direction. Divergences in breadth and price are not ideal for sustainable trend and can be expected to eventually revert to the direction of broad market.

Volume Spectrum - WhvntrThe "Volume Spectrum" by Whvntr has been developed to analyze and visualize trading volume patterns in financial markets, offering traders insights into volume dynamics relative to historical performance. This tool can be particularly useful for identifying periods of unusually high or low trading activity, which are often associated with significant price movements.
Intended Markets and Conditions
The Volume Spectrum indicator is versatile and can be applied across a variety of markets, including stocks, forex, commodities, and cryptocurrencies. It is designed to be relevant in both bullish and bearish markets, as well as in varying volatility conditions. The primary focus is on identifying shifts in trading volume that could indicate potential trading opportunities or risks.
Features and Relevance for Trading
Volume Analysis: The indicator calculates and plots the average volume over a user-defined period (length) and compares it to a shorter-term average volume (avg_length). This comparison helps in identifying trends in trading volume.
Smoothing Options: Users can select from four types of smoothing methods (RMA, SMA, EMA, WMA) to calculate the moving averages, allowing for customization based on trading strategy and personal preference.
High and Low Volume Identification: It highlights periods of high and low volume relative to the average, using customizable color schemes for easy visual identification.
Volume Alerts: The script generates alerts for significant increases or decreases in volume, enabling traders to react promptly to potential trading signals.
Customizability: Traders can adjust various parameters, including volume length, average length, smoothing method, and visual elements like plot colors and background highlights.
Volume Histogram: An optional volume histogram can be displayed, with colors indicating whether the volume is increasing and if the closing price was higher or lower than the opening price.
This indicator can be particularly relevant for traders looking to capitalize on volume-based trading strategies. High volume periods may indicate strong interest in a security at its current price, whereas low volume may suggest a lack of interest. By identifying these conditions, traders can make more informed decisions about entry and exit points.
Disclaimer
The Volume Spectrum indicator, like any analytical tool, should be used as part of a comprehensive trading strategy. It is important to note that past performance is not indicative of future results. Trading involves risk, and the effectiveness of this or any indicator may vary based on market conditions, settings used, and other factors. Traders should exercise caution, do their own research, and consider seeking advice from a financial professional before making trading decisions. This indicator is provided without warranty regarding its accuracy, timeliness, or completeness, and users assume all risks associated with its use.

AI SuperTrend x Pivot Percentile - Strategy [PresentTrading]█ Introduction and How it is Different
The AI SuperTrend x Pivot Percentile strategy is a sophisticated trading approach that integrates AI-driven analysis with traditional technical indicators. Combining the AI SuperTrend with the Pivot Percentile strategy highlights several key advantages:
1. Enhanced Accuracy in Trend Prediction: The AI SuperTrend utilizes K-Nearest Neighbors (KNN) algorithm for trend prediction, improving accuracy by considering historical data patterns. This is complemented by the Pivot Percentile analysis which provides additional context on trend strength.
2. Comprehensive Market Analysis: The integration offers a multi-faceted approach to market analysis, combining AI insights with traditional technical indicators. This dual approach captures a broader range of market dynamics.
BTC 6H L/S Performance
Local
█ Strategy: How it Works - Detailed Explanation
🔶 AI-Enhanced SuperTrend Indicators
1. SuperTrend Calculation:
- The SuperTrend indicator is calculated using a moving average and the Average True Range (ATR). The basic formula is:
- Upper Band = Moving Average + (Multiplier × ATR)
- Lower Band = Moving Average - (Multiplier × ATR)
- The moving average type (SMA, EMA, WMA, RMA, VWMA) and the length of the moving average and ATR are adjustable parameters.
- The direction of the trend is determined based on the position of the closing price in relation to these bands.
2. AI Integration with K-Nearest Neighbors (KNN):
- The KNN algorithm is applied to predict trend direction. It uses historical price data and SuperTrend values to classify the current trend as bullish or bearish.
- The algorithm calculates the 'distance' between the current data point and historical points. The 'k' nearest data points (neighbors) are identified based on this distance.
- A weighted average of these neighbors' trends (bullish or bearish) is calculated to predict the current trend.
For more please check: Multi-TF AI SuperTrend with ADX - Strategy
🔶 Pivot Percentile Analysis
1. Percentile Calculation:
- This involves calculating the percentile ranks for high and low prices over a set of predefined lengths.
- The percentile function is typically defined as:
- Percentile = Value at (P/100) × (N + 1)th position
- Where P is the desired percentile, and N is the number of data points.
2. Trend Strength Evaluation:
- The calculated percentiles for highs and lows are used to determine the strength of bullish and bearish trends.
- For instance, a high percentile rank in the high prices may indicate a strong bullish trend, and vice versa for bearish trends.
For more please check: Pivot Percentile Trend - Strategy
🔶 Strategy Integration
1. Combining SuperTrend and Pivot Percentile:
- The strategy synthesizes the insights from both AI-enhanced SuperTrend and Pivot Percentile analysis.
- It compares the trend direction indicated by the SuperTrend with the strength of the trend as suggested by the Pivot Percentile analysis.
2. Signal Generation:
- A trading signal is generated when both the AI-enhanced SuperTrend and the Pivot Percentile analysis agree on the trend direction.
- For instance, a bullish signal is generated when both the SuperTrend is bullish, and the Pivot Percentile analysis shows strength in bullish trends.
🔶 Risk Management and Filters
- ADX and DMI Filter: The strategy uses the Average Directional Index (ADX) and the Directional Movement Index (DMI) as filters to assess the trend's strength and direction.
- Dynamic Trailing Stop Loss: Based on the SuperTrend indicator, the strategy dynamically adjusts stop-loss levels to manage risk effectively.
This strategy stands out for its ability to combine real-time AI analysis with established technical indicators, offering traders a nuanced and responsive tool for navigating complex market conditions. The equations and algorithms involved are pivotal in accurately identifying market trends and potential trade opportunities.
█ Usage
To effectively use this strategy, traders should:
1. Understand the AI and Pivot Percentile Indicators: A clear grasp of how these indicators work will enable traders to make informed decisions.
2. Interpret the Signals Accurately: The strategy provides bullish, bearish, and neutral signals. Traders should align these signals with their market analysis and trading goals.
3. Monitor Market Conditions: Given that this strategy is sensitive to market dynamics, continuous monitoring is crucial for timely decision-making.
4. Adjust Settings as Needed: Traders should feel free to tweak the input parameters to suit their trading preferences and to respond to changing market conditions.
█Default Settings and Their Impact on Performance
1. Trading Direction (Default: "Both")
Effect: Determines whether the strategy will take long positions, short positions, or both. Adjusting this setting can align the strategy with the trader's market outlook or risk preference.
2. AI Settings (Neighbors: 3, Data Points: 24)
Neighbors: The number of nearest neighbors in the KNN algorithm. A higher number might smooth out noise but could miss subtle, recent changes. A lower number makes the model more sensitive to recent data but may increase noise.
Data Points: Defines the amount of historical data considered. More data points provide a broader context but may dilute recent trends' impact.
3. SuperTrend Settings (Length: 10, Factor: 3.0, MA Source: "WMA")
Length: Affects the sensitivity of the SuperTrend indicator. A longer length results in a smoother, less sensitive indicator, ideal for long-term trends.
Factor: Determines the bandwidth of the SuperTrend. A higher factor creates wider bands, capturing larger price movements but potentially missing short-term signals.
MA Source: The type of moving average used (e.g., WMA - Weighted Moving Average). Different MA types can affect the trend indicator's responsiveness and smoothness.
4. AI Trend Prediction Settings (Price Trend: 10, Prediction Trend: 80)
Price Trend and Prediction Trend Lengths: These settings define the lengths of weighted moving averages for price and SuperTrend, impacting the responsiveness and smoothness of the AI's trend predictions.
5. Pivot Percentile Settings (Length: 10)
Length: Influences the calculation of pivot percentiles. A shorter length makes the percentile more responsive to recent price changes, while a longer length offers a broader view of price trends.
6. ADX and DMI Settings (ADX Length: 14, Time Frame: 'D')
ADX Length: Defines the period for the Average Directional Index calculation. A longer period results in a smoother ADX line.
Time Frame: Sets the time frame for the ADX and DMI calculations, affecting the sensitivity to market changes.
7. Commission, Slippage, and Initial Capital
These settings relate to transaction costs and initial investment, directly impacting net profitability and strategy feasibility.

series_collectionLibrary "series_collection"
A personal collection of commonly used series types like moving averages that are supported directly by
the pinescript library ('ALMA', 'DEMA', 'EMA', 'HMA', 'RMA', 'SMA', 'SWMA', 'VWMA', 'WMA'), highest and lowest source,
median and pivots. One single function (with overloads) that can be configured easily by the user input and can be
used as a core piece of functionality for many user cases. This library was created to abstract away and re-use this
commonly used functionality in my "Two MA Signal Indicator" script and the "Template Trailing Strategy" script. Both
of them use the "two_ma_logic" for defining entry and exit signals. While this piece of work does not contain any
novel mathematical expressions and just adds a convinient (and configurable) way to do things, I hope that might add
value to other scripts as well and future projects.
cust_series(length, seriesType, source)
cust_series - Calculate the custom series of the given source for the given length and type
Parameters:
length (simple int) : - The length of the custom series
seriesType (simple string) : - The type of the custom series
source (float) : - The source of the values
Returns: - The resulting value of the calculations of the custom series
cust_series(length, seriesType, source)
cust_series - Calculate the custom series of the given source for the given length and type
Parameters:
length (simple float) : - The length of the custom series (ceiled)
seriesType (simple string) : - The type of the custom series
source (float) : - The source of the values
Returns: - The resulting value of the calculations of the custom series
