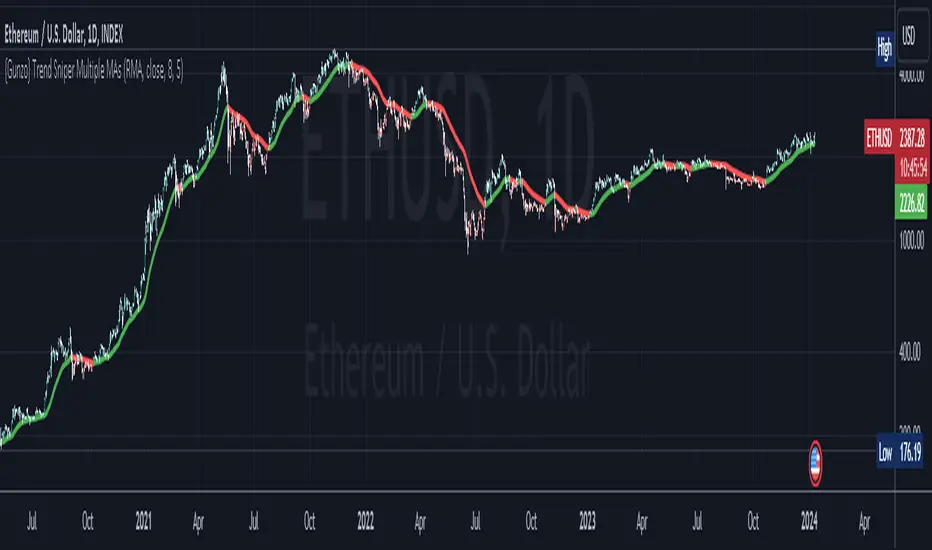
{Gunzo} Trend Sniper (Multiple MAs with coefficient)Updated GUNZO's Trend Sniper script by adding in different MA types to choose from. This can help reduce false signals and sharpen the trend reversal points.
Here's a summary of the key changes:
1. Multiple Moving Average Types: The original script was focused solely on the Weighted Moving Average (WMA) with a coefficient. The updated script introduces flexibility by allowing users to choose from a variety of Moving Average types, including WMA, VWMA (Volume Weighted Moving Average), EMA (Exponential Moving Average), SMA (Simple Moving Average), HullMA (Hull Moving Average), TEMA (Triple Exponential Moving Average), DEMA (Double Exponential Moving Average), T3, and RMA (Running Moving Average).
2. Coefficient Integration: In the original script, the coefficient was specifically designed for the WMA calculation. The updated script extends this concept to all the selected Moving Average types. This coefficient is applied differently depending on the type of MA, often affecting the length of the MA calculation.
3. Dynamic Length Calculation: For MAs that traditionally use an integer length (like SMA, EMA, etc.), the updated script calculates this length dynamically by multiplying the user-defined length by the coefficient and then rounding it to the nearest integer. This ensures compatibility with Pine Script's requirements for these functions.
All credits to GUNZO
original script:
Cerca negli script per "rma"
Instant RSI (IRSI)
Instant RSI is tailored for users seeking an effective RSI indicator for charts with limited historical data, such as new symbols or very high time frame charts. Its distinctiveness lies in employing a Chebyshev filter, an innovative approach that allows the RSI to initiate calculations with just two data points. The Chebyshev filter, traditionally used in signal processing, helps in smoothing data while minimizing lag, a critical aspect in fast-moving financial markets.
Key Features:
Chebyshev Filter Integration: The Chebyshev filter is fine-tuned to mimic a 14-period RMA's behavior, enhancing the RSI's responsiveness and accuracy with minimal data.
Customizable RSI and MA Settings: Users can modify the RSI's source, length, ripple effect, and style. An optional moving average overlay, also based on Chebyshev filtering, tuned to mimic an EMA set to 14.
Divergence Detection: I have also included the ability to adjust the divergence settings to allow for more flexibility over the built in RSI.
The script operates by applying the Chebyshev filter to the price movement's up and down components, forming the basis of the RSI calculation. When the moving average feature is activated, it further processes the RSI value through the Chebyshev filter for additional smoothing. This dual application of the Chebyshev filter is central to the script's design, offering a unique solution for situations where traditional RSI calculations might be less reliable due to data scarcity.
The divergence detection feature enhances the script's utility by signaling potential trend reversals, critical for strategic decision-making in trading. These features are visually represented on the chart, ensuring that users can easily interpret and react to the indicators.
In general this indicator should produce the exact same output as the built in RSI. This indicator is specifically designed to be used in conditions where the built in RSI will not work due to limited data.
In summary, the "Instant RSI" script is a practical option for those dealing with limited data scenarios, offering a unique blend of Chebyshev filter application for more responsive market analysis.

Donchian Channels StrengthTL;DR - A different approach calculating strength based on Donchain channels
My approach calculating strength by using the difference between price and donchain average. It is possible to use the highest/lowest value of a given source (like close) or to use the highest high/lowest low (by using the option 'include wicks') for the strength calculation
I added multiple moving averages which can be used in the calculations incl. SMMA (RMA) which is used in RSI calculation and works best for me.
Usage is similar to RSI: DC Strength oscillates between 0 and 100. Low values (<20) indicate a bearish situation while high values (>80) indicate bullish ones. Center line (50) crossings can also indicate a possible trend change.

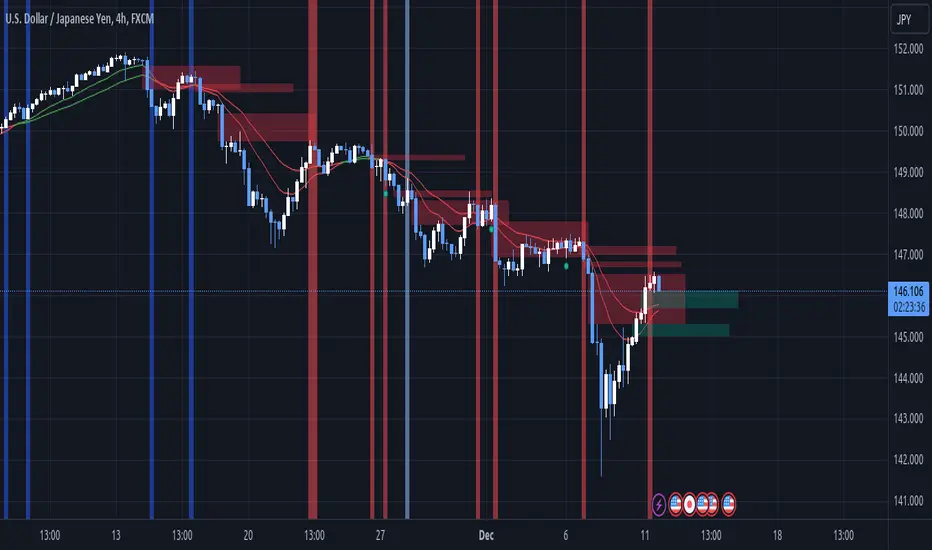
SentinelsSentinels is a playful variation on combining different mean averages (MA).
A cross of 2 user-defined MA's (MA 1 & MA 2) initiates the drawing of a sentinel with tentacles, which, on its turn can provide potential support/resistance or entry/stop-loss/take profit zones.
The type of each MA (MA 1, MA 2 and tentacles) can be chosen from following options:
SMA
EMA
SMMA (RMA)
HullMA
WMA
VWMA
DEMA
TEMA
🔹 Examples
Fast & slow MA: HullMA, Tentacles: TEMA
Fast & slow MA: SMA, Tentacles: WMA
Fast & slow MA: WMA, Tentacles: WMA
Fast & slow MA: TEMA, Tentacles: TEMA
🔶 DETAILS
🔹 Head-Body
The head-body is formed by:
the slow MA when there is a crossunder.
the fast MA when there is a crossover.
The color of the head-body is a gradient which can be set. The color of the tentacles (non-gradient) can be set as well.
The head-body of the sentinel will be visible for maximum 60 bars after a cross has occured.
🔹 Tentacles
The length of the 'Tentacles' is calculated by taking the difference between the length of MA 1 and MA 2 , and dividing this by 6 -> diff .
The length of each tentacle is MA 1 + a multiple of diff .
The tentacles will only begin to show from 2 bars after a cross.
Each tentacle will be shown maximum x bars after the cross:
Tentacle 1: 15 bars
Tentacle 2: 20 bars
Tentacle 3: 25 bars
Tentacle 4: 30 bars
Tentacle 5: 35 bars
Tentacle 6: 40 bars
🔹 Switch lengths
By switching lengths the colors get switched too.
Note that the tentacles act differently though.
In that way, this can be an extra option to visualize the tentacles .
🔶 Happy Holidays
Merry Christmas and a Happy New Year!

TrendFriendOverview
TrendFriend (TF) combines various technical analysis components, including trend calculations, moving averages, RSI signals, and Fair Value Gaps (FVG) detection to determine trend reversal and continuation points. The FVG feature identifies potential consolidation periods and displays mitigation levels.
Features
Trend Analysis: Utilizes short and long-term Running Moving Averages (RMA) to identify trends.
Average True Range (ATR): Plots ATR to depict market volatility.
RSI Signals: Calculates RSI and provides buy/sell signals based on RSI conditions.
Fair Value Gaps (FVG): Detects FVG patterns and offers options for customization, including dynamic FVG, mitigation levels, and auto threshold.
Usage
Buy Signals: Generated based on pullback conditions, contra-buy signals, and crossovers of specified moving averages.
Sell Signals: Generated based on pullback conditions, contra-sell signals, and crossunders of specified moving averages.
Visualization: FVG areas are visually represented on the chart, and unmitigated levels can be displayed.
Configuration
Adjustable parameters for trend periods, ATR length, RSI settings, FVG threshold, and display preferences.
Dynamic FVG detection and mitigation level visualization can be enabled/disabled.
Usage Example
Trend Analysis: Identify trends with short and long-term moving averages.
RSI Signals: Interpret RSI signals for potential reversals.
FVG Detection: Visualize Fair Value Gaps and mitigation levels on the chart.
Buy/Sell Signals: Receive alerts for buy/sell signals based on specified conditions.
Disclaimer
This Pine Script code is subject to the terms of the Mozilla Public License 2.0. Use this code at your own risk, and always conduct additional analysis before making trading decisions.
Author
Author: devoperator84
License: Mozilla Public License 2.0
Triple Moving Averages (Gradient, Alarm & Multi TF)Triple Moving Averages
Features:
- 7 Different MA's (RMA, SMA, EMA, 'WMA', HMA, DEMA, EMA)
- Gradient coloring
- Multi timeframe
- Crossover alarm's and alarm delay function
- Forecasting (By removing the last bar in the MA period)
Moving Average to easely identify the trend and trend strength.
Gradient coloring and personal color preferences can be made.
Alert Delay System
When timing is essentially, this helps you get the alarm just in time.
Use it with the triggers ONLY ONCE PER BAR or ONLY ONCE. Then the alarm comes before the close, but you don't have to worry about it triggering just seconds after bar open :)
Default = 15m Recomended for 1h chart
Alarm's
Get the alarms before it's actually crossing or when it crosses
*This is not a selfmade indicator but simply merging from several indicators and added alert delay function and multi timeframe support
// Credits
- BigBitsIO Script : Scripting Tutorial 6 Triple Many Moving Averages Forecasting
- PineCoders Script : Color Gradient Framework PineCoders

Targets For Many Indicators [LuxAlgo]The Targets For Many Indicators is a useful utility tool able to display targets for many built-in indicators as well as external indicators. Targets can be set for specific user-set conditions between two series of values, with the script being able to display targets for two different user-set conditions.
Alerts are included for the occurrence of a new target as well as for reached targets.
🔶 USAGE
Targets can help users determine the price limit where the price might start deviating from an indication given by one or multiple indicators. In the context of trading, targets can help secure profits/reduce losses of a trade, as such this tool can be useful to evaluate/determine user take profits/stop losses.
Due to these essentially being horizontal levels, they can also serve as potential support/resistances, with breakouts potentially confirming new trends.
In the above example, we set targets 3 ATR's away from the closing price when the price crosses over the script built-in SuperTrend indicator using ATR period 10 and factor 3. Using "Long Position Target" allows setting a target above the price, disabling this setting will place targets below the price.
Users might be interested in obtaining new targets once one is reached, this can be done by enabling "New Target When Reached" in the target logic setting section, resulting in more frequent targets.
Lastly, users can restrict new target creation until current ones are reached. This can result in fewer and longer-term targets, with a higher reach rate.
🔹 Dashboard
A dashboard is displayed on the top right of the chart, displaying the amount, reach rate of targets 1/2, and total amount.
This dashboard can be useful to evaluate the selected target distances relative to the selected conditions, with a higher reach rate suggesting the distance of the targets from the price allows them to be reached.
🔶 DETAILS
🔹 Indicators
Besides 'External' sources, each source can be set at 1 of the following Build-In Indicators :
ACCDIST : Accumulation/distribution index
ATR : Average True Range
BB (Middle, Upper or Lower): Bollinger Bands
CCI : Commodity Channel Index
CMO : Chande Momentum Oscillator
COG : Center Of Gravity
DC (High, Mid or Low): Donchian Channels
DEMA : Double Exponential Moving Average
EMA : Exponentially weighted Moving Average
HMA : Hull Moving Average
III : Intraday Intensity Index
KC (Middle, Upper or Lower): Keltner Channels
LINREG : Linear regression curve
MACD (macd, signal or histogram): Moving Average Convergence/Divergence
MEDIAN : median of the series
MFI : Money Flow Index
MODE : the mode of the series
MOM : Momentum
NVI : Negative Volume Index
OBV : On Balance Volume
PVI : Positive Volume Index
PVT : Price-Volume Trend
RMA : Relative Moving Average
ROC : Rate Of Change
RSI : Relative Strength Index
SMA : Simple Moving Average
STOCH : Stochastic
Supertrend
TEMA : Triple EMA or Triple Exponential Moving Average
VWAP : Volume Weighted Average Price
VWMA : Volume-Weighted Moving Average
WAD : Williams Accumulation/Distribution
WMA : Weighted Moving Average
WVAD : Williams Variable Accumulation/Distribution
%R : Williams %R
Each indicator is provided with a link to the Reference Manual or to the Build-In Indicators page.
The latter contains more information about each indicator.
Note that when "Show Source Values" is enabled, only values that can be logically found around the price will be shown. For example, Supertrend , SMA , EMA , BB , ... will be made visible. Values like RSI , OBV , %R , ... will not be visible since they will deviate too much from the price.
🔹 Interaction with settings
This publication contains input fields, where you can enter the necessary inputs per indicator.
Some indicators need only 1 value, others 2 or 3.
When several input values are needed, you need to separate them with a comma.
You can use 0 to 4 spaces between without a problem. Even an extra comma doesn't give issues.
The red colored help text will guide you further along (Only when Target is enabled)
Some examples that work without issues:
Some examples that work with issues:
As mentioned, the errors won't be visible when the concerning target is disabled
🔶 SETTINGS
Show Target Labels: Display target labels on the chart.
Candle Coloring: Apply candle coloring based on the most recent active target.
Target 1 and Target 2 use the same settings below:
Enable Target: Display the targets on the chart.
Long Position Target: Display targets above the price a user selected condition is true. If disabled will display the targets below the price.
New Target Condition: Conditional operator used to compare "Source A" and "Source B", options include CrossOver, CrossUnder, Cross, and Equal.
🔹 Sources
Source A: Source A input series, can be an indicator or external source.
External: External source if 'External" is selected in "Source A".
Settings: Settings of the selected indicator in "Source A", entered settings of indicators requiring multiple ones must be comma separated, for example, "10, 3".
Source B: Source B input series, can be an indicator or external source.
External: External source if 'External" is selected in "Source B".
Settings: Settings of the selected indicator in "Source B", entered settings of indicators requiring multiple ones must be comma separated, for example, "10, 3".
Source B Value: User-defined numerical value if "value" is selected in "Source B".
Show Source Values: Display "Source A" and "Source B" on the chart.
🔹 Logic
Wait Until Reached: When enabled will not create a new target until an existing one is reached.
New Target When Reached: Will create a new target when an existing one is reached.
Evaluate Wicks: Will use high/low prices to determine if a target is reached. Unselecting this setting will use the closing price.
Target Distance From Price: Controls the distance of a target from the price. Can be determined in currencies/points, percentages, ATR multiples, ticks, or using multiple of external values.
External Distance Value: External distance value when "External Value" is selected in "Target Distance From Price".

Choose Symbol, Mode with HullThis Pine Script code is designed to create a customizable indicator on the TradingView platform. Below is an introduction to its features and purpose:
Introduction:
This script serves as a versatile indicator on TradingView, allowing users to choose between different modes (Heikin-Ashi, Linear, and Normal) and apply a Hull Moving Average (Hull) for trend analysis. The primary features include mode selection, the choice of using different calculation methods, and the option to incorporate the Hull Moving Average for enhanced trend visibility.
Key Features:
Mode Selection:
Users can choose between "Heikin-Ashi," "Linear," or "Normal" modes, influencing how the open, high, low, and close prices are calculated.
Hull Moving Average:
The script incorporates the Hull Moving Average (Hull) to provide a smoothed trend line for better trend identification.
Calculation Methods:
Users can select different calculation methods for the open, high, low, and close prices, including Simple Moving Average (SMA), Exponential Moving Average (EMA), Smoothed Moving Average (SMMA or RMA), Weighted Moving Average (WMA), and Volume Weighted Moving Average (VWMA).
Customizable Lengths:
Length parameters are customizable, allowing users to adjust the period lengths for the Hull Moving Average and other calculation methods.
Buy and Sell Signals:
Buy and sell signals are generated based on crossovers and crossunders between the Hull Moving Average and the price. These signals are visually displayed on the chart with corresponding labels.
Color-Coding:
The script utilizes color-coding to distinguish between bullish (lime) and bearish (red) trends, making it easier for users to identify potential changes in market direction.
Customizable Symbol and Resolution:
Users have the option to choose a specific trading symbol and resolution for analysis.
Important Note:
This script is provided for educational purposes and does not constitute financial advice. Traders and investors should conduct thorough research and analysis before making any trading decisions. Additionally, customization options should be explored to align the script with individual trading preferences.

[KVA] Extremes ProfilerExtremes Profiler is a specialized indicator crafted for traders focusing on the relationship between price extremes and moving averages. This tool offers a comprehensive perspective on price dynamics by quantifying and visualizing significant distances of current prices from various moving averages. It effectively highlights the top extremes in market movements, providing key insights into price extremities relative to these averages. The indicator's ability to analyze and display these distances makes it a valuable tool for understanding market trends and potential turning points. Traders can leverage the Extremes Profiler to gain a deeper understanding of how prices behave in relation to commonly watched moving averages, thus aiding in making informed trading decisions
Key Features :
Extensive MA Analysis : Tracks the price distance from multiple moving averages including EMA, SMA, WMA, RMA, and HMA.
Top 50 (100) Distance Metrics : Highlights the 50 (100)greatest (highest or lowest) distances from each selected MA, pinpointing significant market deviations.
Customizable Periods : Offers flexibility with adjustable periods to align with diverse trading strategies.
Comprehensive View : Switch between timeframes for a well-rounded understanding of short-term fluctuations and long-term market trends.
Cross-Asset Comparison : Utilize the indicator to compare different assets, gaining insights into the relative dynamics and volatility of various markets. By analyzing multiple assets, traders can discern broader market trends and better understand asset-specific behaviors.
Customizable Display : Users can adjust the periods and number of results to suit their analytical needs.

Dope DPOThe "Dope DPO" (DDPO) indicator is a technical analysis tool designed for traders to identify trends and potential trend changes in the market. It's based on the concept of the Detrended Price Oscillator (DPO), but with several enhancements for greater versatility and user customization.
Key Features of the Dope DPO Indicator:
Averaging Multiple Periods: The indicator averages the DPO calculations over ten different time periods. This averaging helps in smoothing out the volatility and providing a more comprehensive view of the market trend.
Customizable Smoothing: Users can choose the length of the smoothing as well as the type of moving average (SMA, EMA, WMA, or RMA) for smoothing. This allows for flexibility in how the indicator responds to price changes.
Trend Change Detection: The indicator includes a feature to detect changes in the market trend. It does this by comparing the current value of the smoothed DPO to its value a specified number of bars back. This helps in identifying potential reversals or shifts in momentum.
Dynamic Color Coding: The indicator uses color coding (green and red) to visually represent the trend direction. If the smoothed DPO is trending upwards compared to a previous value, the color will be green, indicating bullish momentum. Conversely, a red color signifies bearish momentum.
Horizontal Reference Lines: It includes horizontal lines at specific levels (overbought, zero, and oversold) to provide reference points for interpreting the indicator's values.
Usage:
Traders can use the Dope DPO to gauge the overall market trend and to look for potential entry and exit points based on trend changes.
The color-coded histogram makes it easy to spot when the trend might be reversing, which can be particularly useful in conjunction with other technical analysis tools.
The flexibility in choosing the smoothing method and length allows traders to tailor the indicator to different trading styles and timeframes.

The Ultimate Buy and Sell IndicatorThis indicator should be used in conjunction with a solid risk management strategy that does not over-leverage positions and uses stop-losses. You can not rely 100% on the signals provided by this indicator (or any other for that matter).
With that said, this indicator can provide some excellent signals.
It has been designed with a large number of customization options intended for advanced traders, but you do not HAVE to be an advanced user to simply use the indicator. I have tried to make it easy to understand, and this section will provide you with a better understanding of how to use it.
NOTE:
While NOT REQUIRED, I would recommend also finding my indicator called, "Ultimate RSI", which is designed to work together with this indicator (visually). They both contain the same settings and allow you to visualize changes made in this indicator that can not be displayed on the main chart.
This indicator creates it's own candles(bars), so you have to go into your main settings and turn off the "body, border and wick" color settings. Using a dark background is also recommended.
How does it work?
The indicator mainly relies on the RSI indicator with Bollinger Bands for signals. (Though not entirely)
First, there are something that I call "Watch Signals", which are various Bollinger Band crossing events. This could be the price crossing Bollinger Bands or the RSI crossing Bollinger Bands.
There are separate watch signals for buys and sells. Buy watch signals are colored orange to match the BUY signal candle color and Fuchsia (kind of a bright purple) to match SELL signal candles.
In order for most buy or sell signals to be created, there must first be a watch signal. There is a lookback period (or length) for watch signals to be used, and after that many candles (bars) have passed, they will be ignored. You can set a length to look back as well as a time to wait before creating any.
What this means is that if there has previously been (for instance) a sell signal. You can tell it to wait 10 bars before creating any buy watch signals. You can then also tell it that it should look back 10 bars from the current one in order to find any buy watch signals. This means that if you had it set up that way 10 to wait and 10 to validate, it would start allowing buy watch signals 11 bars after a sell, and then once you hit 20 bars, it will start leaving a gap (invisible to you) as the 10 bar lookback period starts moving forward with each new bar. This is useful in order to keep signals more spaced apart as some bad signals come quickly after another one.
Example: You may get a sell signal where the Bollinger bands are tight, then the price easily drops down into the lower band creating a buy watch signal, then you get a "fake" or short pump up and it says buy, but then drops dramatically afterwards. The wait period can ensure that the sell stays in effect longer before a buy is considered by blocking any buy watch signals for a period of time.
After you get a watch signal, the system then looks for various other things to happen to create buy or sell signals. This could be the RSI crossing the (slow) RSI Basis line (from its Bollinger bands), it could be the price crossing its basis line, it could be MACD crosses, it could even be RSI crossing certain levels. All of these are options. If you like the MACD strategy and want it to give you buy and sell signals from just MACD crosses, simply select that option for signals.
It is also able to use the first of any of the options that takes place.
I included an option to force alternating buy and sell signals, rather than showing groups of, or subsequent buy, buy, buy signals, for instance.
Moving on....
You can change the moving average that is used to calculate the RSI. The standard moving average for RSI is the RMA (aka SWMA). Changes to this can dramatically change your signals. You also have the option to change the moving average type used in the Bollinger bands calculation. You can change the length of these as well. The same goes for the Bollinger bands over the Price chart. I added an ATR option for the RSI Bollinger bands to play with, as well. You are able to adjust the standard deviation (multiplier) of the bands as well, which will of course affect the signals.
The ways you can play with signals are nearly infinite, so have fun figuring it out.
The indicator allows for moving averages to be shown as well, with a variety of types to choose from. The standard numbers are 5, 10, 20, 50, 100 and 200, with the addition of a custom moving average of your choice. You can also change the color of this one. You can choose to show them all or any of them you want to show, in any combination, although the TYPE of moving average (SMA, EMA, WMA, etc.) will apply to all of them.
You may also notice the Bollinger Bands over the Price are colored, and become more or less transparent.
The color is derived from the trend of the RSI or the RSI basis (your choice). It looks back at the value however many bars you want and compares the values and that's how it determines if it is trending up or down. Since RSI is a directional momentum indicator, this can be quite useful. If you see the bands are getting darker, this will explain why.
The indicator has a lookback period for determining the widest the bands (which measure volatility) have been over that period of time. This is the baseline. It then will make the bands disappear (by making them more transparent) if the volatility is low. This indicates that a change in volatility is coming and that price isn't really changing much compared to the past (default 500) bars. If they become bright, this is because price has started trending in a direction and volatility is increasing.
I should also note that the candles are colored based on RSI levels.
If you use the Ultimate Companion indicator, you will be able to see the RSI levels (zones) that the colors are based on. As RSI moves into a new range, the candle color will change.
I have created a yellow zone where the candles turn yellow. This is when RSI is between (default) 45 and 55, indicating there is basically no momentum and price is going sideways. This is a good place to get trapped in bad trades, and there is a Yellow RSI Filter to block signals in this area to keep you from entering bad trades.
Green candles indicate values over 55 (getting brighter as RSI rises) and red candles are RSI values under 45 (getting brighter as RSI values get lower). If you see white, this means RSI is either over 80 or under 20. A sharp reversal is almost always imminent at this stage.
When we talk about Buy and Sell Signals, they draw a green or red triangle and it literally says BUY or SELL. There is an option to color the background for added visibility. These signals do not "repaint", what this means is that they can be late. To account for this, I have included a background color that will flash as a warning that a buy or sell could be imminent, although it may fail to break through and set a buy or sell signal. This is simply an advanced warning. The reason is that sometimes a candle may be very large and you won't be told to buy or sell during the candle until the move is completely over and now you're getting in on the next one. That's not a great feeling, so I made it repaint the background color and not repaint the completed signal. You get the best of both worlds.
This indicator also uses complex logic to handle things.
When there is a buy signal, it enters into a state of having been bought, or a "bought state". The same for sells. If Force alternating signals is off, you could have more than one buy in a bought state, or more than one sell in a sell state. There is an option to color the background green during the full duration of a bought state, or red during the full duration of a sold state.
I have added divergence.
This shows that the lows or highs of RSI and PRICE are different. If RSI is making higher highs but the price is not, then the price is likely to follow this bullish divergence, if the opposite happens, it's bearish. It will draw a line on the chart connecting the highs and lows and call it bearish or bullish. You can adjust this as well.
I have an RSI High/Low filter. If the RSI basis (or average) is very high or low, you can block signal from this area since the price is likely to continue in that direction before actually reversing.
You can change the settings of the MACD if you choose to use it for signals, and if you want to see it, you'll have to run that indicator below the chart and match the settings to see what is going on, just like the RSI.
Going back to Watch Signals. You can also choose to require more than one watch signal if you choose. You can skip watch signals, so it will ignore the first or second one, whatever you want to do. You can color the background to show you where watch signals have been skipped.
Regarding the wait period for creating watch signals after a sell or after a buy, you can also color the background to see where these were blocked by the wait period.
Lastly you can choose which type of watch signals to use, or keep them from being shown on the chart. This allows you to study the history of how the asset you are trading behaves and customize the behavior of signals based on your study of it.
Everything in the settings area has tooltips, which will explain what that thing does to help you along this journey.
I hope this indicator (and perhaps Ultimate RSI alongside this) will help you take your trading to the next level.

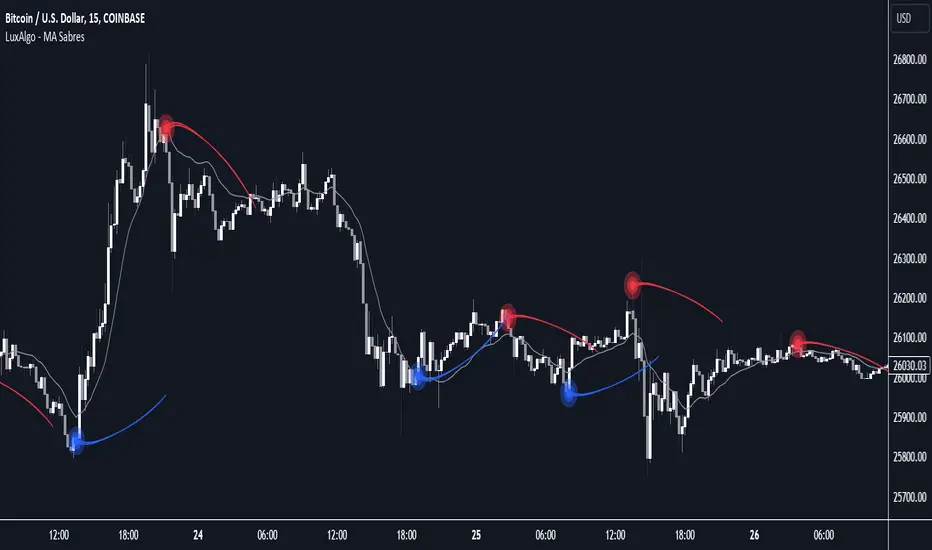
MA Sabres [LuxAlgo]The "MA Sabres" indicator highlights potential trend reversals based on a moving average direction. Detected reversals are accompanied by an extrapolated "Sabre" looking shape that can be used as support/resistance and as a source of breakouts.
🔶 USAGE
If a selected moving average (MA) continues in the same direction for a certain time, a change in that direction could signify a potential reversal.
In this publication, when a trend change occurs, a sabre-shaped figure is drawn which can be used as support/resistance:
A sabre can be indicative of a direction, however, it can also act as a stop-loss when the price should go in the opposite direction:
Or show potential areas of interest:
🔶 DETAILS
This publication will look for a change in direction after the MA went in the same direction during x consecutive bars (settings: " Reversal after x bars in the same direction ").
Then a circle-shaped drawing will be drawn 1 bar back, at the previous high/low, dependable of the previous direction.
From there originates a sabre-shaped figure where the tip lies as far as the user-set MA length.
The angle of the "sabre" relies on the ATR of the previous 14 bars.
Less volatility will create a flatter sabre while the opposite is true when there is more volatility in the previous 14 bars.
The sabre is created by the latest feature, polylines , which enables us to connect several 'points', resulting in a polyline.new() object.
Do note that sabres are offset by one bar to the past to align their locations.
🔶 SETTINGS
MA Type: SMA, EMA, SMMA (RMA), HullMA, WMA, VWMA, DEMA, TEMA, NONE (off)
Length: this sets the length of MA, and the length of the sabre shape
Previous Trend Duration: After the MA direction is the same for x consecutive bars, the first time the direction changes, a sabre is drawn
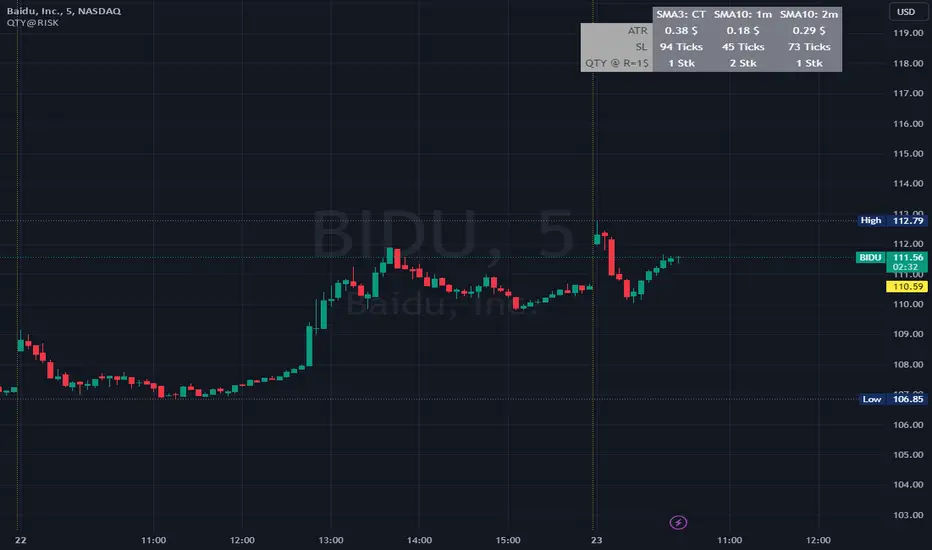
QTY@RISKWhat it does:
This indicator calculates the amount of shares to take at a predefined risk according to market volatility based on ATR.
This should help novice traders focus more on their trades and strategies instead of spending too much time calculating parameters.
How it works:
You have some configuration parameters
1. Number of candles used to calculate the ATR
2. ATR calculation method (SMA, RMA, EMA, WMA)
3. How much you want to risk in $.
4. Safety factor on ATR, to get a buffer
5. Size of your capital to be able to calculate the maximum amount of shares
6. Shares limit, if you have a certain limit of shares to take
The formula is simple:
Is the RISK/ATR * price > Equity ? then take the Equity/price
otherwise: SHARES = RISK/(ATR * safety_factor)
How to use it:
This indicator is most useful for intraday timeframe. If you trade on 1m, then use it in this timeframe
RVI_HTFThe "RVI_HTF" indicator is a tool designed to assist traders in analyzing market trends using the Relative Vigor Index (RVI) across different timeframes. It enables users to customize various aspects of the indicator's appearance and behavior. By monitoring the RVI on different timeframes, tracking its relationship with the moving average, and paying attention to extreme arrows above the 80 or below the 20 line, traders can anticipate potential reversals, trends, or changes in market momentum.
Above 80 Line: When the RVI moves above the 80 line, it suggests that the market may be overbought. Extreme upward arrows (indicating potential sell signals) can be a sign that a bullish trend might be reaching an exhaustion point. Traders may anticipate a possible trend reversal or pullback.
Below 20 Line: When the RVI dips below the 20 line, it implies that the market might be oversold. Extreme downward arrows (indicating potential buy signals) can be an early signal of a potential bullish reversal. Traders may anticipate an upcoming uptrend or bounce.
Crossing Above Moving Average: When the RVI crosses above its moving average on the selected timeframe, it can serve as an early indication of potential bullish strength in the market. This suggests that buying pressure may be increasing.
Crossing Below Moving Average: Conversely, when the RVI crosses below its moving average, it can signal potential bearish momentum. This indicates that selling pressure may be gaining strength.
Variables:
Timeframe (TF) Selection:
The indicator allows you to select the timeframe for the RVI calculation. You can choose from various options such as 1 minute (1), 5 minutes (5), 15 minutes (15), 30 minutes (30), 60 minutes (60), 240 minutes (240), Daily (D), Weekly (W), Monthly (M), or use "Auto" to automatically select a higher timeframe based on your current chart's timeframe.
Moving Average Type (MA_Type):
Function: Allows users to select the type of moving average used in RVI calculations.
Options: You can select from various moving average types, including:
SMA (Simple Moving Average)
EMA (Exponential Moving Average)
SMMA (Smoothed Moving Average, also known as RMA)
WMA (Weighted Moving Average)
VWMA (Volume Weighted Moving Average)
DEMA (Double Exponential Moving Average)
Moving Average Length (MA_Length):
Function: Permits users to set the number of periods for the selected moving average type.
Purpose: Controls the sensitivity of the RVI indicator. Longer lengths provide smoother results, while shorter lengths react more quickly to price changes.
Up Arrow Color (upArrowColor):
Function: Enables users to customize the color of arrows that indicate potential Overbought areas. (Only shown when the TF is same as or lower than the chart TF)
Down Arrow Color (downArrowColor):
Function: Allows users to specify the color of downward-pointing arrows signaling potential Oversold areas. (Only shown when the TF is same as or lower than the chart TF)
RVI Up Color (firstColor):
Function: Defines the color of the RVI line when it indicates a bullish condition on the higher timeframe.
RVI Down Color (secondColor):
Function: Specifies the color of the RVI line when it suggests a bearish condition on the higher timeframe.
RVI-Based Moving Average Up Color (firstColorMA):
Function: Customizes the color of the RVI-based moving average line when it indicates a bullish condition.
RVI-Based Moving Average Down Color (secondColorMA):
Function: Defines the color of the RVI-based moving average line when it suggests a bearish condition.

Advanced EMA Cross with Normalized ATR Filter, Controlling ADX
Description:
This strategy is based on EMA cross strategy and additional filters are used to get better results, a normalized ATR filter, and ADX control...
It aims to provide traders with a code base that generates signals for long positions based on market conditions defined by various indicators.
How it Works:
1. EMA: Uses short (8 periods) and long (20 periods) EMAs to identify crossovers.
2. ATR: Uses a 14-period ATR, normalized to its 20-period historical range, to filter out noise.
3. ADX: Uses a 14-period RMA to identify strong trends.
4. Volume: Filters trades based on a 14-period SMA of volume.
5. Super Trend: Uses a Super Trend indicator to identify the market direction.
How to Use:
- Buy Signal: Generated when EMA short crosses above EMA long, and other conditions like ATR and market direction are met.
- Sell Signal: Generated based on EMA crossunder and high ADX value.
Originality and Usefulness:
This script combines EMA, ATR, ADX, and Super Trend indicators to filter out false signals and identify more reliable trading opportunities.
USD Strength in the code is not working, just simulated it as PSEUDO CODE:
Strategy Results:
- Account Size: $1000
- Commission: Not considered
- Slippage: Not considered
- Risk: Manageable through parameters, now less than 5% per trade
- Dataset: Aim for more than 100 trades for a sufficient sample size
- Test Conditions: Test in 30 min chart for BTCUSDT
IMPORTANT NOTE: This script should be used for educational purposes and should not be considered as financial advice.
Chart:
- The script's output is plotted as Buy and Sell signals on the chart.
- No other scripts are included for clarity.
- Have tested with 30mins period
- You are encouraged to play with parameters, let me know if it helps you and/or if you can upgrade the code to a better level.
WHY DID I USE ATR AND ADX?
ATR filter is usually used for the following purposes.
Market Volatility: ATR measures how volatile the market is. High ATR values indicate that the price is experiencing significant fluctuations.
Filtering: Crossing a certain ATR threshold may indicate that the market is active enough to present trading opportunities.
Risk Management: ATR can also be used to set stop-loss and take-profit levels, helping to manage risk effectively.
And ADX is usually used for;
Trend Strength: ADX measures the strength of a trend. High ADX values indicate a strong trend.
Filtering: An ADX value above a certain level suggests that the trend is strong and it might be safer to trade.
Versatility: ADX does not indicate the direction of the trend, only its strength. This makes it useful in both bullish and bearish markets.
Using these indicators together can help filter out false signals and produce more reliable trading signals. While ATR helps to determine if the market is active enough, ADX measures the strength of the trend. Combined, they can create a more complex and effective trading strategy.
I've used ADX data to support generating a buy signal after a golden cross (bullish trend) and waiting until this is a strong trend. It sounds good to check for different trend strengths for bullish and bearish markets to decide a buy signal. Additionally I used ATR to check if the market has enough fluctuations.

Supertrend x4 w/ Cloud FillSuperTrend is one of the most common ATR based trailing stop indicators.
The average true range (ATR) plays an important role in 'Supertrend' as the indicator uses ATR to calculate its value. The ATR indicator signals the degree of price volatility. In this version you can change the ATR calculation method from the settings. Default method is RMA, when the alternative method is SMA.
The indicator is easy to use and gives an accurate reading about an ongoing trend. It is constructed with two parameters, namely period and multiplier.
The implementation of 4 supertrends and cloud fills allows for a better overall picture of the higher and lower timeframe trend one is trading a particular security in.
The default values used while constructing a supertrend indicator is 10 for average true range or trading period.
The key aspect what differentiates this indicator is the Multiplier. The multiplier is based on how much bigger of a range you want to capture. In our case by default, it starts with 2.636 and 3.336 for Set 1 & Set 2 respectively giving a narrow band range or Short Term (ST) timeframe visual. On the other hand, the multipliers for Set 3 & Set 4 goes up to 9.736 and 8.536 for the multiplier respectively giving a large band range or Long Term (LT) timeframe visual.
A ‘Supertrend’ indicator can be used on equities, futures or forex, or even crypto markets and also on minutes, hourly, daily, and weekly charts as well, but generally, it fails in a sideways-moving market. That's why with this implementation it enables one to stay out of the market if they choose to do so when the market is ranging.
This Supertrend indicator is modelled around trends and areas of interest versus buy and sell signals. Therefore, to better understand this indicator, one must calibrate it to one's need first, which means day trader (shorter timeframe) vs swing trader (longer time frame), and then understand how it can be utilized to improve your entries, exits, risk and position sizing.
Example:
In this chart shown above using SPX500:OANDA, 15R Time Frame, we can see that there is at any give time 1 to 4 clouds/bands of Supertrends. These four are called Set 1, Set 2, Set 3 and Set 4 in the indicator. Set's 1 & 2 are considered short term, whereas Set's 3 & 4 are considered long term. The term short and long are subjective based on one's trading style. For instance, if a person is a 1min chart trader, which would be short term, to get an idea of the trend you would have to look at a longer time frame like a 5min for instance. Similarly, in this cases the timeframes = Multiplier value that you set.
Optional Ideas:
+ Apply some basic EMA/SMA indicator script of your choice for easier understanding of the trend or to allow smooth transition to using this indicator.
+ Split the chart into two vertical layouts and applying this same script coupled with xdecow's 2 WWV candle painting script on both the layouts. Now you can use the left side of the chart to show all bearish move candles only (make the bullish candles transparent) and do the opposite for the right side of the chart. This way you enhance focus to just stick to one side at a given time.
Credits:
This indicator is a derivative of the fine work done originally by KivancOzbilgic
Here is the source to his original indicator: ).
Disclaimer:
This indicator and tip is for educational and entertainment purposes only. This not does constitute to financial advice of any sort.

Trend_Trader_WMA (Momentum)<---> Caution! This is first test version of indicator. I am ready to get more ideas+feedback to develop it more. <--->
The "Momentum_Trader_WMA" indicator is a versatile technical analysis tool designed to help traders identify potential trend changes and momentum shifts in the market. It combines multiple indicators and moving averages to provide a comprehensive view of price action and momentum.
Key Features:
Weighted Moving Averages (WMAs): The indicator calculates two different WMAs with user-defined lengths, providing a smoothed representation of price data.
Average True Range (ATR) Bands: ATR is used to calculate dynamic bands around the WMA Average. These bands can help traders gauge market volatility and potential breakout points. The color of the ATR bands can be seen as an early signal of trends or the continuation of current trends.
Commodity Channel Index (CCI): CCI is a momentum oscillator that measures the relative strength of price changes. The indicator calculates CCI values based on a user-defined period.
Exponential Moving Average (EMA) of CCI: An EMA of CCI is plotted to help identify trends and momentum shifts.
Color-Coded Bands: The ATR bands change colors based on CCI conditions, providing visual cues for potential trading opportunities. When ATR bands transition from narrow (indicating low volatility) to wide (indicating increased volatility), it can be seen as an early signal of a potential trend change or the continuation of the current trend.
Buy and Sell Signals: The indicator generates buy and sell signals based on crossovers of WMAs and CCI thresholds, making it easier for traders to identify entry and exit points.
Customizable Moving Averages: Traders can enable or disable different moving averages (e.g., SMA, EMA, WMA, RMA, VWMA, HMA) with various periods and colors to adapt the indicator to their trading preferences.
CCI Dot Alerts: Dots are displayed at the bottom of the chart based on CCI values, helping traders spot extreme CCI conditions.
How to Use:
Trend Identification: The WMAs and ATR bands can help identify the current trend direction and its strength. When the WMAs are in an uptrend (green) and the ATR bands widen, it may indicate a strong bullish trend. Conversely, when the WMAs are in a downtrend (red) and the ATR bands narrow, it may suggest a weakening bearish trend.
Momentum Confirmation: The CCI and its EMA provide insights into market momentum. Look for CCI crossovers above 100 for potential bullish momentum and below -100 for potential bearish momentum.
Buy and Sell Signals: Pay attention to the buy and sell signals generated by the indicator. Buy when the WMAs cross over and CCI crosses above 100. Sell when the WMAs cross under and CCI crosses below -100.
ATR Bands as Early Signals: The color changes in the ATR bands can be seen as early signals of trends or the continuation of current trends. Wide ATR bands may indicate increased volatility and potential trend changes, while narrow ATR bands suggest reduced volatility and potential trend continuation.
Moving Averages: Customize the indicator by enabling or disabling specific moving averages according to your preferred trading strategy.
CCI Dots: Use the CCI dots to identify extreme CCI conditions, which may indicate overbought or oversold market conditions.
PS:
Recommended to use Indicator with price action conecpts(eg. support and resistance) as they play important role in any market.
Buy and sell signals are not really accurate. I would personally look for trend shift in WMA middle line and confirmation from CCI dots at bottom. For example. If middle line turns green and within recent 3-4 candles (or next 3-4 candles) dots tunrns green also, that means momentum has been rised in the direction of bulls.
pls, take s/r concepts first when working. I am thinking to add more precise buy sell signal method to make it easier to trade.
Good luck with your trades :)

VARGAS"VARGAS" is an indicator that can be used in all timeframes on charts in the stock, crypto, and commodity markets. It allows trades to be opened according to the intersections of moving averages in different time periods.
It is an indicator using weighted moving averages. Using a weighted moving average has the following benefits for traders:
1) Precision and Smoothness: The WMA typically gives more weight to recent prices and therefore reacts faster to more recent data. This helps you catch price movements faster and recognize trend changes faster. On the other hand, the WMA is smoother than the simple moving average (SMA), which makes it less likely to generate false signals.
2) Trend Identification: The WMA is used to identify and analyze price trends. It is especially important for traders who want to track short-term movements. The WMA is used to assess the direction and strength of the trend.
3) Trading Signals: The WMA is used as part of various trading strategies. It is especially used in moving average crossover strategies. For example, a short-term WMA crossing the long-term WMA to the upside can be considered a buy signal, while a reversal can be interpreted as a sell signal.
4) Adaptability to Volatility: WMA can adapt to volatility by changing weighting factors. Investors can adopt a more flexible approach by assigning different weights based on market conditions and asset classes.
5) Data Correction: WMA can be helpful in reducing data noise. A single large price fluctuation can cause the SMA to be more affected, while the WMA reduces the impact of these fluctuations.
In our VARGAS coding, the intersection times of the 9-day and 15-day weighted moving averages allow us to decide the direction of the trend. The green and red cloud areas following the price candles make the strategy easy for the user to follow.
At the intersection between the 9-day weighted moving average and the 15-day weighted moving average, we can use buy and sell signals as follows:
If the 9-day weighted moving average crosses the 15-day weighted moving average upwards, buy,
Sell if the 9-day weighted moving average crosses the 15-day weighted moving average downwards.
Within the scope of this strategy, GOLDEN CROSS and DEATH CROSS intersections, which guide us for trend changes, are also included in the coding. Thus, it is aimed to add strength to our WMA 9 and WMA 15 intersection strategy as an idea.
VARGAS indicator gives better results for longer periods of 4 hours and above. As the time period increases, the probability of correct results will increase.
**
"VARGAS" hisse senedi, kripto, ve emtia piyasalarındaki grafiklerde her türlü zaman diliminde kullanılabilen bir indikatördür. Farklı zaman periyotlarındaki hareketli ortalamaların kesişimlerine göre işlem açılmasını sağlar.
Ağırlıklı hareketli ortalamalar kullanılarak hazırlanmış bir göstergedir. Ağırlıklı hareketli ortalama kullanmanın yatırımcılara aşağıdaki gibi faydaları bulunmaktadır:
1) Duyarlılık ve Pürüzsüzlük: WMA, tipik olarak son dönem fiyatlarına daha fazla ağırlık verir ve bu nedenle daha güncel verilere daha hızlı tepki verir. Bu, fiyat hareketlerini daha hızlı yakalamanıza ve daha hızlı trend değişikliklerini tanımanıza yardımcı olur. Diğer yandan, WMA, basit hareketli ortalamaya (SMA) göre daha pürüzsüzdür, bu da yanlış sinyal üretme olasılığını azaltır.
2) Trend Belirleme: WMA, fiyat trendlerini belirlemek ve analiz etmek için kullanılır. Özellikle kısa vadeli hareketleri izlemek isteyen yatırımcılar için önemlidir. WMA, trendin yönünü ve gücünü değerlendirmek için kullanılır.
3) Ticaret Sinyalleri: WMA, çeşitli ticaret stratejilerinin bir parçası olarak kullanılır. Özellikle hareketli ortalama crossover stratejilerinde kullanılır. Örneğin, kısa vadeli WMA'nın uzun vadeli WMA'yı yukarı yönlü kesmesi bir alım sinyali olarak kabul edilebilir, tersine dönmesi ise bir satış sinyali olarak yorumlanabilir.
4) Volatiliteye Uyarlanabilirlik: WMA, ağırlıklandırma faktörlerini değiştirerek volatiliteye uyum sağlayabilir. Yatırımcılar, piyasa koşullarına ve varlık sınıflarına göre farklı ağırlıklar atayarak daha esnek bir yaklaşım benimseyebilirler.
5) Veri Düzeltme: WMA, veri gürültüsünü azaltmada yardımcı olabilir. Tek bir büyük fiyat dalgalanması, SMA'nın daha fazla etkilenmesine neden olabilirken, WMA bu dalgalanmaların etkisini azaltır.
VARGAS isimli kodlamamızda ise 9 günlük ve 15 günlük ağırlıklı hareketli ortalamaların kesişme zamanları trendin yönüne karar vermemizi sağlar. Fiyat mumlarını takip eden yeşil ve kırmızı bulut alanları stratejinin kullanıcı tarafından kolaylıkla takip edilmesini sağlamaktadır.
9 Günlük Ağırlıklı hareketli ortalama, 15 Günlük Ağırlıklı hareketli ortalama arasındaki kesişimde al ve sat sinyallerini şu şekilde kullanabiliriz:
Eğer 9 günlük ağırlıklı hareketli ortalama 15 günlük ağırlıklı hareketli ortalamayı yukarı doğru kesiyorsa al,
Eğer 9 günlük ağırlıklı hareketli ortalama, 15 günlük ağırlıklı hareketli ortalamayı aşağı doğru keserse sat.
Bu strateji kapsamında trend değişimleri için bizlere yön veren GOLDEN CROSS ve DEATH CROSS kesişimleri de kodlamanın içerisinde dahil edilmiştir. Böylelikle WMA 9 ve WMA 15 kesişim stratejimize fikir olarak güç katması hedeflenmiştir.
VARGAS indikatörü 4 saat ve üzeri daha uzun periyotlarda daha iyi sonuçlar vermektedir. Zaman periyodu büyüdükçe doğru sonuç verme olasılığı artacaktır.

Ultimate RSI [LuxAlgo]The Ultimate RSI indicator is a new oscillator based on the calculation of the Relative Strength Index that aims to put more emphasis on the trend, thus having a less noisy output. Opposite to the regular RSI, this oscillator is designed for a trend trading approach instead of a contrarian one.
🔶 USAGE
While returning the same information as a regular RSI, the Ultimate RSI puts more emphasis on trends, and as such can reach overbought/oversold levels faster as well as staying longer within these areas. This can avoid the common issue of an RSI regularly crossing an overbought or oversold level while the trend makes new higher highs/lower lows.
The Ultimate RSI crossing above the overbought level can be indicative of a strong uptrend (highlighted as a green area), while an Ultimate RSI crossing under the oversold level can be indicative of a strong downtrend (highlighted as a red area).
The Ultimate RSI crossing the 50 midline can also indicate trends, with the oscillator being above indicating an uptrend, else a downtrend. Unlike a regular RSI, the Ultimate RSI will cross the midline level less often, thus generating fewer whipsaw signals.
For even more timely indications users can observe the Ultimate RSI relative to its signal line. An Ultimate RSI above its signal line can indicate it is increasing, while the opposite would indicate it is decreasing.
🔹 Smoothing Methods
Users can return more reactive or smoother results depending on the selected smoothing method used for the calculation of the Ultimate RSI. Options include:
Exponential Moving Average (EMA)
Simple Moving Average (SMA)
Wilder's Moving Average (RMA)
Triangular Moving Average (TMA)
These are ranked by the degree of reactivity of each method, with higher ones being more reactive (but less smooth).
Users can also select the smoothing method used by the signal line.
🔶 DETAILS
The RSI returns a normalized exponential average of price changes in the range (0, 100), which can be simply calculated as follows:
ema(d) / ema(|d|) × 50 + 50
where d represent the price changes. In order to put more emphasis on trends we can put higher weight on d . We can perform this on the occurrence of new higher highs/lower lows, and by replacing d with the rolling range instead (the rolling period used to detect the higher highs/lower lows is equal to the length setting).
🔶 SETTINGS
Length: Calculation period of the indicator
Method: Smoothing method used for the calculation of the indicator.
Source: Input source of the indicator
🔹 Signal Line
Smooth: Degree of smoothness of the signal line
Method: Smoothing method used to calculation the signal line.

Adaptive MA-Bollinger HistogramVisualize two of your favorite moving averages in a fun new way.
This script calculates the distance (or difference) between the price and two moving averages of your choosing and then creates two histograms.
The two histograms are plotted inversely, so if the price is over both moving averages, one will be positive above the centerline while the other still positive will be below the centerline.
(In a future update you will have the option to have them both positive at the same time)
Next, what it does is apply Bollinger Bands (optional) to each of the histograms.
This creates a very interesting effect that can highlight areas of interest you may miss with other indicators.
You have plenty of options for coloring, the type of moving average, Bollinger Band length, and toggling features on and off.
Give it a few minutes of your time to study, and see what information you can learn from watching this indicator by comparing it with the chart.
Here is a full user guide:
Adaptive MA-Bollinger Histogram Indicator User Guide
Welcome to the user guide for the **Adaptive MA-Bollinger Histogram** indicator. This custom indicator is designed to help traders analyze trends and potential reversals in a financial instrument's price movements. The indicator combines two Moving Averages (MA) and Bollinger Bands to provide valuable insights into market conditions.
### Indicator Overview
The Adaptive MA-Bollinger Histogram indicator comprises the following components:
1. **Moving Averages (MA1 and MA2):** The indicator uses two moving averages, namely MA1 and MA2, to track different time periods. MA1 has a user-defined length (default: 50) and MA2 has a longer user-defined length (default: 100). These moving averages can be calculated using different methods such as Simple Moving Average (SMA), Exponential Moving Average (EMA), Weighted Moving Average (WMA), Volume Weighted Moving Average (VWMA), or Smoothed Moving Average (RMA).
2. **Histograms:** The indicator displays histograms based on the differences between the price source and the respective moving averages. Positive values of the histogram for MA1 are plotted in one color (default: green), while negative values are plotted in another color (default: red). Similarly, positive values of the histogram for MA2 are plotted in one color (default: blue), while negative values are plotted in another color (default: yellow). It's important to note that the histogram for MA1 is plotted positively, while the histogram for MA2 is plotted inversely.
3. **Bollinger Bands:** The indicator also features Bollinger Bands calculated based on the differences between the price source and the respective moving averages (dist1 and dist2). Bollinger Bands consist of three lines: the middle band, upper band, and lower band. These bands help visualize the potential volatility and overbought/oversold levels of the instrument's price.
### Understanding the Indicator
- **Histograms:** The histograms highlight the divergence between the price and the two moving averages. When the histogram for MA1 is positive, it indicates that the price is above the MA1. Conversely, when the histogram for MA1 is negative, it suggests that the price is below the MA1. Similarly, the histogram for MA2 is plotted inversely.
- **Bollinger Bands:** The Bollinger Bands consist of three lines. The middle band represents the moving average (MA1 or MA2), while the upper and lower bands are calculated based on the standard deviation of the differences between the price source and the moving average. The bands expand during periods of higher volatility and contract during periods of lower volatility.
### Possible Trading Ideas
1. **Trend Confirmation:** When the histograms for both MA1 and MA2 are consistently positive, it may indicate a strong bullish trend. Conversely, when both histograms are consistently negative, it may suggest a strong bearish trend.
2. **Divergence:** Divergence between price and the histograms could signal potential reversals. For example, if the price is making new highs while the histogram is declining, it might indicate a bearish divergence and a possible upcoming trend reversal.
3. **Bollinger Bands Squeeze:** A narrowing of the Bollinger Bands indicates lower volatility and often precedes a significant price movement. Traders might consider a potential breakout trade when the bands start to expand again.
4. **Overbought/Oversold Levels:** Prices touching or exceeding the upper Bollinger Band could suggest overbought conditions, while prices touching or falling below the lower Bollinger Band could indicate oversold conditions. Traders might look for reversals or corrections in such scenarios.
### Customization
- You can adjust the parameters such as MA lengths, Bollinger Bands length, width, and colors to suit your preferences and trading strategy.
### Conclusion
The **Adaptive MA-Bollinger Histogram** indicator provides a comprehensive view of price trends, divergences, and potential reversal points. Traders can use the information from this indicator to make informed decisions in their trading strategies. However, like any technical tool, it's recommended to combine this indicator with other forms of analysis and risk management techniques for optimal results.

Directional Movement Index FLEXA common problem experienced by short term traders using DMI/ADX is that the session breaks results in carry-over effects from the prior session. For example, a large gap up would result in a positive DMI, even though momentum is clearly negative. Note the extremely different results in the morning session, when the gap is reversed.
The DMI-FLEX algoritm resets the +DI and -DI values to the prior session ending midpoint, so that new momentum can be observed from the indicator. (Note for Pinescript coders: rma function does not accept series int, thus the explicit pine_rma function)
DMI-FLEX has the added feature that the ADX value, instead of a separate line, is shown as shading between the +DI and -DI lines, and the color itself is determined by whether +DI is above -DI for a bullish color, or -DI is above +DI for a bearish color.
DMI Flex also gives you the flexibility of inverse colors, in case your chart has inverted scale.
Summary and How to use:
1) Green when +DI is above -DI
2) Red when -DI is above +DI
3) Deeper shading represents a higher ADX value.

Double Relative Strength Index (Double RSI)# Double Relative Strength Index (Double RSI) Indicator
The Double Relative Strength Index (Double RSI) is a custom trading indicator for the TradingView platform. It provides traders with two Relative Strength Index (RSI) bands, a fast RSI, and a slow RSI, which can be helpful in identifying potential entry and exit points in the market.
## Features
- **Uses 2 RSI Bands:** The indicator displays two RSI lines on the chart, providing insights into the short-term and long-term strength of the asset's price movement.
- **Fast and Slow RSI:** The fast RSI uses a shorter length, while the slow RSI uses a longer length, allowing traders to observe different time frames of price momentum.
- **Smoothing:** To reduce noise and improve the readability of the RSI lines, the indicator offers multiple smoothing options such as RMA, SMA, EMA, WMA, and HMA.
- **Crossover and Crossunder Signals:** The indicator identifies potential trading signals when the fast RSI crosses above or below the slow RSI. These events are visually highlighted on the chart with color-coded candlesticks.
- **RSI Bands:** The indicator also includes colored bands that represent different RSI levels, such as 80%, 75%, 60%, 50%, 45%, 25%, and 20%. These bands help visualize the RSI's current position relative to overbought and oversold conditions.
## How to Use
1. Add the "Double RSI" indicator to your TradingView chart.
2. Customize the input parameters according to your preferences, such as the lengths of the fast and slow RSIs and the smoothing method.
3. The indicator will display two RSI lines on the chart, each with its own color.
4. Look for crossover events where the fast RSI line crosses above the slow RSI line, indicating a potential bullish signal.
5. Watch for crossunder events where the fast RSI line crosses below the slow RSI line, indicating a potential bearish signal.
6. The colored bands represent different RSI levels. When the RSI is in the overbought (high) or oversold (low) regions, it may suggest a potential reversal in price direction.
## Disclaimer
Please remember that the Double RSI indicator is provided for informational purposes only and should not be considered as financial advice or a standalone trading strategy. Always perform your own research, use additional tools and indicators, and consider risk management techniques before making any trading decisions.
**Note:** This code is subject to the terms of the Mozilla Public License 2.0. For more details, refer to the (mozilla.org).
EMA Buy/Sell Alerts with ATR-based TP/SLI wanted to fill a void in the Tradingview FREE indicators. I have searched far and wide on a moving average alert with ATR based take profits and stop loss. I have attempted a rudimentary version of what I hope to improve upon in the future. Will try and add different moving average options such as simple, hull, RMA, JMA, SSL, WMA, etc. For now, a basic EMA with 3 TP and a SL based on the current ATR should suffice.
I grow tired of the ATR take profits being hidden behind a paywall. Please use the script and add to your favorite indicators as you please.
Please leave feedback for future development.
