Moving Average - TREND POWER v1.1- (AS)0)NOTE:
This is first version of this indicator. It's way more complicated than it should be. Check out Moving Average-TREND POWER v2.1-(AS), its waaaaay less complicated and might be better.Enjoy...
1)INTRODUCTION/MAIN IDEA:
In simpliest form this script is a trend indicator that rises if Moving average if below price or falling if above and going back to zero if there is a crossover with a price. To use this indicator you will have to adjust settings of MAs and choose conditions for calculation.
While using the indicator we might have to define CROSS types or which MAs to use. List of what cross types are defined in the script and Conditiones to choose from.The list will be below.
2) COMPOSITION:
-MA1 can be defined by user in settings, possible types: SMA, EMA, RMA, HMA, TEMA, DEMA, LSMA, WMA.
-MA2 is always ALMA
3) OVERLAY:
Default is false but if you want to see MA1/2 on chart you can change code to true and then turn on overlay in settings. Most plot settings are avalible only in OV=false.
if OV=true possible plots ->MA1/2, plotshape when choosen cross type
if OV=false -> main indicator,TSHs,Cross counter
4)PRESETS :
Indicator has three modes that can be selected in settings. First two are presets and do not require selecting conditions as they set be default.
-SIMPLE - most basic
-ABSOLUTE - shows only positive values when market is trending or zero when in range
-CUSTOM - main and the most advanced form that will require setting conditions to use in calculating trend
4.1)SIMPLE – this is the most basic form of conditions that uses only First MA. If MA1 is below selected source (High/Low(High for Uptrend and Low for DNtrend or OHLC4) on every bar value rises by 0.02. if it above Low or OHLC4 it falls by 0.02 with every bar. If there is a cross of MA with price value is zero. This preset uses CROSS_1_ULT(list of all cross types below)
4.2) ABSOLUTE – does not show direction of the trend unlike others and uses both MA1 and MA2. Uses CROSS type 123_ULT
4.3) CUSTOM – here we define conditions manually. This mode is defined in parts (5-8 of description)
5)SETTINGS:
SOURCE/OVERLAY(line1) – select source of calculation form MA1/MA2, select for overlay true (look point 3)
TRESHOLDS(line2). – set upper and lower THS, turn TSHs on/off
MA1(line3) – Length/type of MA/Offset(only if MA type is LSM)
MA2(line4) – length/offset/sigma -(remember to set ma in the way that in Uptrend MA2MA1 in DNtrend)
Use faster MA types for short term trends and slower types / bigger periods for longer term trends, defval MA1/2 settings
are pretty much random so using them is not recomended.
CROSSshape(line5) – choose which cross type you want to plot on chart(only in OV=true) or what type you want to use in counting via for loops,
CROSScount(line6) – set lookback for type of cross choosen above
BOOLs in lines 5 and 6 - plotshape if OV=true/plot CROSScount histogram (if OV=false)
Lines 7 and 8 – PRESET we want to use /SRC for calculation of indicator/are conditions described below/which MAs to use/Condition for
reducing value t 0 - (if PRESET is ABSOLUTE or SIMPLE only SRC should be set(Line 8 does not matter if not CUSTOM))
5)SOURCE for CONDS:
Here you can choose between H/L and OHLC. If H/L value grow when MAlow. If OHLC MAOHLC. H/L is set by default and recommended. This can be selected for all presets not only CUSTOM
6)CROSS types LIST:
“1 means MA1, 2 is MA2 and 3 I cross of MA1/MA2. L stands for low and H for high so for example 2H means cross of MA2 and high”
NAME -DEFINITION Number of possible crosses
1L - cross of MA1 and low 1
1H - cross of MA1 and high 1
1HL - cross of MA1 and low or MA1 and high 2 -1L/1H
2L - cross of MA2 and low 1
2H - cross of MA2 and high 1
2HL - cross of MA2 and low or MA1 and high 2 -2L/2H
12L - cross of MA1 and low or MA2 and low 2 -1L/2L
12H - cross of MA1 and high or MA2 and high 2 -1H/2H
12HL - MA1/2 and high/low 4 -1H/1L/2H/2L
3 -cross of MA1 and MA2 1
123HL -crosses from 12HL or 3 5 -12HL/3
1_ULT - cross of MA1 with any of price sources(close,low,high,ohlc4 etc…)
2_ULT - cross of MA2 with any of price sources(close,low,high,ohlc4 etc…)
123_ULT – all crosses possible of MA1/2 (all of the above so a lot)
7)CRS CONDS:
“conditions to reduce value back to zero”
>/< - 0 if indicator shows Uptrend and there’s a cross with high of selected MA or 0 if in DNtrend and cross with low. Better for UP/DN trend detection
ALL – 0 if cross of MA with high or low no matter the trend, better for detecting consolidation
ULT – if any cross of selected MA, most crosses so goes to 0 most often
8)MA selection and CONDS:
-MA1: only MA1 is used,if MA1 below price value grows and the other way around
MA1price =-0.02
-MA2 – only MA2 is used, same conditions as MA1 but using MA2
MA2price =-0.02
-BOTH – MA1 and MA2 used, grows when MA1 if below, grows faster if MA1 and MA2 are below and fastest when MA1 and MA2 are below and MA2price=-0.02
-MA1 and MA2 >price=-0.03
-MA1 and MA2 ?price and MA2>MA1=-0.04
9)CONDITIONS SELECTION SUMMARRY:
So when CUSTOM we choose :
1)SOURCE – H/L or OHLC
2)MAs – MA1/MA2/BOTH
3)CRS CONDS (>/<,ALL,ULT)
So for example...
if we take MA1 and ALL value will go to zero if 1HL
if MA1 and >/< - 0 if 1L or 1H (depending if value is positive or negative).(1L or 1H)
If ALL and BOTH zero when 12HL
If BOTH and ULT value goes back to zero if Theres any cross of MA1/MA2 with price or cross of MA1 and MA2.(123_ULT)
If >/< and BOTH – 0 if 12L in DNtrend or 12H if UPtrend
10) OTHERS
-script was created on EURUSD 5M and wasn't tested on different markets
-default values of MA1/MA2 aren't optimalized so do not
-There might be a logical error in the script so let me know if you find it (most probably in 'BOTH')
-thanks to @AlifeToMake for help
-if you have any ideas to improve let me know
-there are also tooltips to help
Cerca negli script per "rma"

Moving Average CandlesInspired by Ricardo Santos's " Multiple Moving Average Candle System V0" ()
This script plots 6 moving averages using the plotcandle function rather than the normal plot function. Result is a stylish indicator that shows moving average crossovers in a more visual way. Moving average type options available are , or Simple, Exponential, Hull, Relative, Volume Weighted, and Arnaud Legoux Moving Averages, Linear Regression Curve, and Median. Lengths for each can be set in settings along with selection specific parameters. Good for plotting/visualizing potential entry/exit points based on your preferred moving averages crossing over, or just as some eye candy.

Volatility Percentage MonitorVolatility Percentage Monitor (VPM)
What it’s meant for:
- VPM quickly shows asset volatility trend in percentage making easy to recognise how on-going price move compare to average. This is particularly useful in day-trading analysis too understand when the move possibly reaches it’s top.
- By default VPM shows a 1 period trend and Bollinger Bands on 20 periods.
How it works:
- VPM use a Simple Moving Average to reflect the exact percentage value in both daily and optional trend average measures. There’s also a switch in ‘Setting Menu’ to change the average method (Eg. You can choose RMA with a 14 period average and see a standard ATR graph on chart)
Settings:
- Additional averages can show short, mid and longterm volatility trends and can be adjusted from Setting Menu.
- An additional graph can be shown to display Standard Deviation from longterm period data: (Note: this is used to understand how reliable average data is on the given asset)
- Bollinger Bands can be turned on/off by the Setting Menu and adjusted in period and standard deviation (Suggestion: you can check standard deviation with longterm period average parameter and display trend)
- Average Method switch allow to change the calculation method for all averages with the most common methods
- The indicator is designed to be used with daily, weekly or monthly timeframe, but will work on any timeframe anyway.
- Works on any asset
Alerts:
- Preconfigured alerts can be activated to be notify on mid and top volatility daily reach

Bollinger Bands Lab - by InFinitoVariation of the Moving Average Lab that includes Bollinger Bands functionality for any manually created Moving Average. It includes:
- Standard Deviations for any MA
- Fixed Symmetrical Deviations for any MA that remain at a constant % away from the MA
- The same Moving Average creation settings from the Moving Average Lab
"The Moving Average Lab allows to create any possible combination of up to 3 given MAs. It is meant to help you find the perfect MA that fits your style, strategy and market type.
This script allows to average, weight, double and triple multiple types and lengths of Moving Averages
Currently supported MA types are:
SMA
EMA
VWMA
WMA
SMMA (RMA)
HMA
LSMA
DEMA
TEMA
Features:
- Double or Triple any type of Moving Average using the same logic used for calculating DEMAs and TEMAs
- Average 2 or 3 different types and lengths of Moving Average
- Weight each MA manually
- Average up to 3 personalized MAs
- Average different Moving Averages with different length each "
The preview screenshot shows:
- The combination of:
- 200 LSMA - Weight: 1
- 200 HMA - Weight: 2
- 200 VWMA - Weight: 1 - Double
- The regular Bollinger Band setting, 2 standard deviations
- Two fixed symmetrical deviations at 15% and 20% away from the XMA
MyMovingAveragesLibraryLibrary "MyMovingAveragesLibrary"
alma(src, lkbk, alma_offset, alma_sigma)
ALMA - Arnaud Legoux Moving Average
Parameters:
src (float) : float
lkbk (int) : int
alma_offset (simple float)
alma_sigma (simple float) : float
Returns: moving average
frama(src, lkbk, FC, SC)
FRAMA - Fractal Adaptive Moving Average
Parameters:
src (float) : float
lkbk (int) : int
FC (int) : int
SC (int) : int
Returns: moving average
kama(src, lkbk, kamafastend, kamaslowend)
KAMA - Kaufman Adaptive Moving Average
Parameters:
src (float) : float
lkbk (int) : int
kamafastend (int) : int
kamaslowend (int) : int
Returns: moving average
ema(src, lkbk)
EMA - Exponential Moving Average
Parameters:
src (float) : float
lkbk (simple int) : int
Returns: moving average
dema(src, lkbk)
DEMA - Double Exponential Moving Average
Parameters:
src (float) : float
lkbk (simple int) : int
Returns: moving average
tema(src, lkbk)
TEMA - Triple Exponential Moving Average
Parameters:
src (float) : float
lkbk (simple int) : int
Returns: moving average
hma(src, lkbk)
HMA - Hull Moving Average
Parameters:
src (float) : float
lkbk (simple int) : int
Returns: moving average
jma(src, lkbk, jurik_power, jurik_phase)
JMA - Jurik Moving Average
Parameters:
src (float) : float
lkbk (int) : int
jurik_power (int)
jurik_phase (float)
Returns: moving average
laguerre(src, alpha)
Laguerre Filter
Parameters:
src (float) : float
alpha (float) : float
Returns: moving average
lsma(src, lkbk, lsma_offset)
LSMA - Least Squares Moving Average
Parameters:
src (float) : float
lkbk (simple int) : int
lsma_offset (simple int) : int
Returns: moving average
mcginley(src, lkbk)
McGinley Dynamic
Parameters:
src (float) : float
lkbk (simple int) : int
Returns: moving average
mf(src, lkbk, mf_feedback, mf_beta, mf_z)
Modular Filter
Parameters:
src (float) : float
lkbk (int) : int
mf_feedback (bool) : float
mf_beta (float) : boolean
mf_z (float) : float
Returns: moving average
rdma(src)
RDMA - RexDog Moving Average (RDA, as he calls it)
Parameters:
src (float) : flot
Returns: moving average
sma(src, lkbk)
SMA - Simple Moving Average
Parameters:
src (float) : float
lkbk (int) : int
Returns: moving average
smma(src, lkbk)
SMMA - Smoothed Moving Average (known as RMA in TradingView)
Parameters:
src (float) : float
lkbk (simple int) : int
Returns: moving average
t3(src, lkbk)
T3 Moving Average
Parameters:
src (float) : float
lkbk (simple int) : int
Returns: moving average
tma(src, lkbk)
TMA - Triangular Moving Average
Parameters:
src (float) : float
lkbk (simple int) : int
Returns: moving average
vama(src, lkbk, vol_lkbk)
VAMA - Volatility-Adjusted Moving Average
Parameters:
src (float) : float
lkbk (simple int) : int
vol_lkbk (int) : int
vwma(src, lkbk)
VWMA - Volume-Weighted Moving Average
Parameters:
src (float) : float
lkbk (simple int) : int
Returns: moving average
mf_zlagma(src, lkbk)
Zero-Lag Moving Average
Parameters:
src (float) : float
lkbk (int) : int
Returns: moving average
Selective Moving Average: DemoThis indicator produces a conditional moving average based off of your chosen inputs. For example, you can create an EMA that only takes into account closing prices when the 14 period RSI is greater than 50, or a VWMA that tracks hl2 values when the hl2 value is within one standard deviation from the mean. The possibilities are highly configurable to your liking. Please comment below additional conditions you might like me to add to the moving average and I will try my best to get to your feedback.
The following parameters are configurable:
--> Source: This is the source of the moving average that you want to create. You can use external sources if you have another indicator on your chart.
--> Condition: This is the condition that you want to take into account when the moving average is calculating itself. For instance, I have the following conditions pre-built (more to come): Source within 1 standard deviation of the mean (of the source), Source within 2 standard deviations of the mean (of the source), Positive volume, Negative volume, RSI greater than 50, RSI less than 50, Candlestick length greater than body.
--> Length: The length of the selective moving average. For conditions that occur infrequently, a larger length may be necessary to improve accuracy.
--> Average type: The type of moving average (SMA, EMA, RMA, etc.) that you wish to create
--> Condition length: An optional parameter if you are using a condition that depends on a length itself, i.e. the RSI - here you can change the RSI length. The RSI source will be the moving average source, but future updates may separate the two.

Equity Curve Trading with EMAWhat Is Equity Curve Trading?
In equity curve trading, traders apply a moving average to the curve. The idea is when the equity curve drops below the moving average, the strategy is put on hold. This is done to stop losses when either the hopes of the plan working start dimming or when the trader knows he cannot afford more losses on a strategy. The trader can resume trading this particular strategy when the equity curve is above the moving average.
Equity Curve Trading puts an investor at the ease of knowing that his investment is covered even when he is not actively tracking his strategy. When the equity curve dips below a level investor is comfortable with, it can be paused until such time that the equity curve is back above the determined moving average.
Example:
Equity Curve Trading Example
Trading Strategy
I choosed the SuperTrend strategy for BTCUSDT on 4 hour time frame. That shows nice equity curve with default settings. Let's find out and check can we improve the equity curve with this modern money management trade method?
Some shift is exist in original equity curve relatively to filtered equity curve, because of array usage, but it is not affected on calculations.
Conclusion
I tested a different time frames, settings and equity curves shapes, but it not gives advantages in equity curve. You can look at the table on the top right corner of the strategy with equity curve and you will see some statistic information for the original strategy and for the modified equity curve trade strategy. In most cases we have lower Win Rate and lower Net Profit after turning on Equity curve trading method. In some cases this can be help if you have the equity curve looks like at the picture above, but this equity curve is really bad for choosing this strategy to trade. I found that EMA works better than SMA, and RMA works better then EMA applied to Equity Curve. You can test your strategy with this trade method if you want, I make the source code opened for it. Please share your results, I hope it will helps.
Conclusion 2
Equity Curve Trading definitely has its proponents in the industry, some of them quite vocal. But, the overall efficacy of the approach is certainly not crystal clear. In fact, what is clear is that it is relatively easy to take a good strategy, and significantly degrade its performance by employing equity curve trading. While the overall objective of equity curve trading is unquestionable – cease trading poor performing strategies - it is probable that there are better ways of accomplishing that goal. From this study, the conclusion is equity curve trading with simple indicators has more downside than upside.

AggBands (v1) [qrsq]The "AggBands" indicator is a custom trading indicator designed to provide a consolidated view of the price action across multiple assets or trading pairs. It combines the price data from multiple tickers and calculates an aggregated price using user-defined weights for each ticker.
The indicator starts by defining the tickers to be included in the aggregation. You can choose from predefined configurations such as "BTC PAIRS," "CRYPTO TOTAL MARKET CAP," "TOP 5 PAIRS," "TOP 5 MEMECOINS," "SPX," "DXY," or "FANG." Each configuration includes specific tickers or indices relevant to the chosen category.
The indicator then fetches the closing, high, and low prices for each ticker and applies the user-defined weights to calculate the aggregated prices. The aggregated prices are normalized within a specified length to provide a consistent scale across different assets or pairs.
Next, the indicator calculates the midpoint, which is the average of the highest high and lowest low of the aggregated prices over a specified aggregation period.
To assess the volatility, the indicator calculates the price range and applies the Average True Range (ATR) indicator to determine the volatility value. The standard deviation is then computed using the price range and aggregation period, with an additional scaling factor applied to the volatility value.
Based on the standard deviation, the indicator generates multiple bands above and below the midpoint. By default, three standard deviation bands are calculated, but the user can choose between one and five bands. The upper and lower bands are smoothed using various moving average (MA) types, such as Simple Moving Average (SMA), Exponential Moving Average (EMA), Smoothed Moving Average (SMMA/RMA), Weighted Moving Average (WMA), Volume Weighted Moving Average (VWMA), Volume Weighted Average Price (VWAP), or Arnaud Legoux Moving Average (ALMA). The user can also adjust the length, offset, and sigma parameters for the moving averages.
The indicator can optionally smooth the midpoint, upper bands, and lower bands using a separate set of moving average parameters.
The indicator can be useful for traders and analysts who want to gain a consolidated view of price movements across multiple assets or trading pairs. It helps identify trends, volatility, and potential support and resistance levels based on the aggregated price and standard deviation bands. Traders can use this information to make informed decisions about trading strategies, risk management, and market analysis.

Price Action (ValueRay)With this indicator, you gain access to up to 5 moving averages from a selection of 15 different types. This flexibility allows you to customize your trading strategy based on your preferences and market conditions. Whether you're a fan of simple moving averages, exponential moving averages, or weighted moving averages, our indicator has got you covered! Additionally, all the MAs are Multi-Time-Frame!
The indicator also provides trading signals. By analyzing market trends and price movements, it generates accurate buy and sell signals, providing you with clear entry and exit points. You can choose between Fast, Mid, and Slow signal speeds.
Trendlines are another crucial aspect of effective trading, and our indicator seamlessly integrates them, helping you visualize the market's direction.
Furthermore, the indicator empowers you with recent highs and lows. By highlighting these key levels, it becomes easier than ever to spot support and resistance areas, aiding you in making well-informed trading choices.
Additionally, you can switch the ADR% (Average Daily Range as a Percentage) on and off. This number instantly provides you with information on how much the stock usually moves per day as a percentage.
Key Features:
Up to 5 Moving Averages, each with its own timeframe.
SMA, EMA, WMA, RMA, Triangular, Volume Weighted, Elastic Volume Weighted, Least Squares, ZLEMA, Hull, Double EMA, Triple EMA, T3, ALMA, KAMA (more to come in future versions).
Recent High and Low Pivot Points acting as support/resistance.
Trendline indicating the current trend.
Buy/Sell Signals (recommended for use as exit points, stop loss, or take profit levels).
Signals can have three different speeds: Fast, Mid, and Slow. You can switch them anytime depending on how quickly or slowly you want to exit a trade.
The predefined colors are best suited for a dark background, and the predefined settings provide a solid starting point that many traders use in their daily work.
Unlock the full potential of your trading strategy with our comprehensive indicator and start making informed trading decisions today!

f_maSelectLibrary "f_maSelect"
Easy to use drop-in facade function to lots of different moving average calculations, including some that are not natively available in PineScript v5 such as Zero-Lag EMA. Simply call f_maSelect(series float serie, simple string ma_type="sma", ma_length=14) instead of a ta.*ma() call and you get access to all MAs offered by PineScript and more.
zema(src, len)
Zero-lag EMA (ZLMA)
Parameters:
src : Input series
len : Lookback period
Returns: Series smoothed with ZLMA
approximate_sma(x, ma_length)
Approximate Standard Moving Average, which substracts the average instead of popping the oldest element, hence losing the base frequency and is why it is approximative. For some reason, this appears to give the same results as a standard RMA
Parameters:
x : Input series.
ma_length : Lookback period.
Returns: Approximate SMA series.
f_maSelect(serie, ma_type, ma_length)
Generalized moving average selector
Parameters:
serie : Input series
ma_type : String describing which moving average to use
ma_length : Lookback period
Returns: Serie smoothed with the selected moving average.
generalized_dev(src, length, avg, lmode)
Generalized deviation calculation: Whereas other Bollinger Bands often just change the basis but not the stdev calculation, the correct way to change the basis is to also change it inside the stdev calculation.
Parameters:
src : Series to use (default: close)
length : Lookback period
avg : Average basis to use to calculate the standard deviation
lmode : L1 or L2 regularization? (ie, lmode=1 uses abs() to cutoff negative values hence it calculates the Mean Absolute Deviation as does the ta.dev(), lmode=2 uses sum of squares hence it calculates the true Standard Deviation as the ta.stdev() function does). See also the research works of everget:
Returns: stdev Standard deviation series
generalized_dev_discount(src, length, avg, lmode, temporal_discount)
Standard deviation calculation but with different probabilities assigned to each bar, with newer bars having more weights en.wikipedia.org
Parameters:
src : Series to use (default: close)
length : Lookback period
avg : Average basis to use to calculate the standard deviation
lmode : L1 or L2 regularization? (ie, lmode=1 uses abs() to cutoff negative values hence it calculates the Mean Absolute Deviation as does the ta.dev(), lmode=2 uses sum of squares hence it calculates the true Standard Deviation as the ta.stdev() function does). See also the research works of everget:
temporal_discount : Probabilistic gamma factor to discount old values in favor of new ones, higher value = more weight to newer bars
Returns: stdev Standard deviation series
median_absdev(src, length, median)
Median Absolute Deviation
Parameters:
src : Input series
length : Lookback period
median : Median already calculated on the input series
Returns: mad, the median absolute deviation value
+ Average Candle Bodies RangeACBR, or, Average Candle Bodies Range is a volatility and momentum indicator designed to indicate periods of increasing volatility and/or momentum. The genesis of the idea formed from my pondering what a trend trader is really looking for in terms of a volatility indicator. Most indicators I've come across haven't, in my opinion, done a satisfactory job of highlighting this. I kept thinking about the ATR (I use it for stops and targets) but I realized I didn't care about highs or lows in regards to a candle's volatility or momentum, nor do I care about their relation to a previous close. What really matters to me is candle body expansion. That is all. So, I created this.
ACBR is extremely simple at its heart. I made it more complicated of course, because why would I want anything for myself to be simple? Originally it was envisaged to be a simple volatility indicator highlighting areas of increasing and decreasing volatility. Then I decided some folks might want an indicator that could show this in a directional manner, i.e., an oscillator, so I spent some more hours tackling that
To start, the original version of the indicator simply subtracts opening price from closing price if the candle closes above the open, and subtracts the close from the open if the candle closes below the open. This way we get a positive number that simply measures candle expansion. We then apply a moving average to these values in order to smooth them (if you want). To get an oscillator we always subtract the close from the open, thus when a candle closes below its open we get a negative number.
I've naturally added an optional signal line as a helpful way of gauging volatility because obviously the values themselves may not tell you much. But I've also added something that I call a baseline. You can use this in a few ways, but first let me explain the two options for how the baseline can be calculated. And what do I mean by 'baseline?' I think of it as an area of the indicator where if the ACBR is below you will not want to enter into any trades, and if the ACBR is above then you are free to enter trades based on your system (or you might want to enter in areas of low volatility if your system calls for that). Waddah Attar Explosion is another indicator that implements something similar. The baseline is calculated in two different ways: one of which is making a Donchian Channel of the ACBR, and then using the basis as the baseline, while the other is applying an RMA to the cb_dif, which is the base unit that makes up the ACBR. Now, the basis of a Donchian Channel typically is the average of the highs and the lows. If we did that here we would have a baseline much too high (but maybe not...), however, I've made the divisor user adjustable. In this way you can adjust the height (or I guess you might say 'width' if it's an oscillator) however you like, thus making the indicator more or less sensitive. In the case of using the ACBR as the baseline we apply a multiplier to the values in order to adjust the height. Apologies if I'm being overly verbose. If you want to skip all of this I have tooltips in the settings for all of the inputs that I think need an explanation.
When using the indicator as an oscillator there are baselines above and below the zero line. One funny thing: if using the ACBR as calculation type for the baselines in oscillator mode, the baselines themselves will oscillate around the zero line. There is no way to fix this due to the calculation. That isn't necessarily bad (based on my eyeball test), but I probably wouldn't use it in such a way. But experiment! They could actually be a very fine entry or confirmation indicator. And while I'm on the topic of confirmation indicators, using this indicator as an oscillator naturally makes it a confirmation indicator. It just happens to have a volatility measurement baked into it. It may also be used as an exit and continuation indicator. And speaking of these things, there are optional shapes for indicating when you might want to exit or take a continuation trade. I've added alerts for these things too.
Lastly, oscillator mode is good for identifying divergences.
Above we have the indicator set to directional, or oscillator, mode. Baselines are Donchian Channels. I changed the default EMA length from 4 to 24 in this case, otherwise all the settings are default, as in the main image for the indicator (which is clearly set to non-directional). The indicator is set to requiring an advancing signal line for background and bar colors. Background color is not on by default. Candle colors, as you can see are aqua when above the top baseline (and only when the signal line is advancing, as per the settings), magenta when below the bottom baseline, and grey for anything else. The red and blue X's are exit signals. There are two types: one, when the signal line weakens and, two, when the ACBR crosses above or below the signal line. There are also arrows. These are continuation signals (ACBR crossing signal line).
Same image as above, but the baselines are set to ACBR rather than Donchian Channels.
Again, the same image, but with everything but the ACBR Baseline turned off. You can see how this might make for an excellent confirmation indicator, but for the areas of chap. Maybe run a second instance of the indicator on your chart as a volatility indicator, as you would not be using it in that way in this instance.
Here I have bar coloring turned off except for signal line crosses NOT requiring the signal line to be advancing. Background coloring is also turned on. You can see that these all line up with continuation signals, or exits for purple candles.
Same image as above but requiring the signal line to be advancing. You can see that continuation signals are not contingent upon the signal line to be advancing. I had it setup that way at first, but of course it still gave false signals, so I thought more signals (not that there are many) is better than fewer. To be sure, just because the indicator shows a continuation signal does not mean you should always take it.
libKageMiscLibrary "libKageMisc"
Kage's Miscelaneous library
print(_value)
Print a numerical value in a label at last historical bar.
Parameters:
_value : (float) The value to be printed.
Returns: Nothing.
barsBackToDate(_year, _month, _day)
Get the number of bars we have to go back to get data from a specific date.
Parameters:
_year : (int) Year of the specific date.
_month : (int) Month of the specific date. Optional. Default = 1.
_day : (int) Day of the specific date. Optional. Default = 1.
Returns: (int) Number of bars to go back until reach the specific date.
bodySize(_index)
Calculates the size of the bar's body.
Parameters:
_index : (simple int) The historical index of the bar. Optional. Default = 0.
Returns: (float) The size of the bar's body in price units.
shadowSize(_direction)
Size of the current bar shadow. Either "top" or "bottom".
Parameters:
_direction : (string) Direction of the desired shadow.
Returns: (float) The size of the chosen bar's shadow in price units.
shadowBodyRatio(_direction)
Proportion of current bar shadow to the bar size
Parameters:
_direction : (string) Direction of the desired shadow.
Returns: (float) Ratio of the shadow size per body size.
bodyCloseRatio(_index)
Proportion of chosen bar body size to the close price
Parameters:
_index : (simple int) The historical index of the bar. Optional. Default = 0.()
Returns: (float) Ratio of the body size per close price.
lastDayOfMonth(_month)
Returns the last day of a month.
Parameters:
_month : (int) Month number.
Returns: (int) The number (28, 30 or 31) of the last day of a given month.
nameOfMonth(_month)
Return the short name of a month.
Parameters:
_month : (int) Month number.
Returns: (string) The short name ("Jan", "Feb"...) of a given month.
pl(_initialValue, _finalValue)
Calculate Profit/Loss between two values.
Parameters:
_initialValue : (float) Initial value.
_finalValue : (float) Final value = Initial value + delta.
Returns: (float) Profit/Loss as a percentual change.
gma(_Type, _Source, _Length)
Generalist Moving Average (GMA).
Parameters:
_Type : (string) Type of average to be used. Either "EMA", "HMA", "RMA", "SMA", "SWMA", "WMA" or "VWMA".
_Source : (series float) Series of values to process.
_Length : (simple int) Number of bars (length).
Returns: (float) The value of the chosen moving average.
xFormat(_percentValue, _minXFactor)
Transform a percentual value in a X Factor value.
Parameters:
_percentValue : (float) Percentual value to be transformed.
_minXFactor : (float) Minimum X Factor to that the conversion occurs. Optional. Default = 10.
Returns: (string) A formated string.
isLong()
Check if the open trade direction is long.
Returns: (bool) True if the open position is long.
isShort()
Check if the open trade direction is short.
Returns: (bool) True if the open position is short.
lastPrice()
Returns the entry price of the last openned trade.
Returns: (float) The last entry price.
barsSinceLastEntry()
Returns the number of bars since last trade was oppened.
Returns: (series int)
getBotNameFrosty()
Return the name of the FrostyBot Bot.
Returns: (string) A string containing the name.
getBotNameZig()
Return the name of the FrostyBot Bot.
Returns: (string) A string containing the name.
getTicksValue(_currencyValue)
Converts currency value to ticks
Parameters:
_currencyValue : (float) Value to be converted.
Returns: (float) Value converted to minticks.
getSymbol(_botName, _botCustomSymbol)
Formats the symbol string to be used with a bot
Parameters:
_botName : (string) Bot name constant. Either BOT_NAME_FROSTY or BOT_NAME_ZIG. Optional. Default is empty string.
_botCustomSymbol : (string) Custom string. Optional. Default is empy string.
Returns: (string) A string containing the symbol for the bot. If all arguments are empty, the current symbol is returned in Binance format.
showProfitLossBoard()
Calculates and shows a board of Profit/Loss through the years.
Returns: Nothing.
Smart QQE ModSmart QQE - Chart Overlay
Smart QQE shows QQE Trend and RSI plot on chart to determine the trend direction and eliminate false signals.
QQE is obtained from original code by Glaz and rescaled to fit on chart. RSI 50 level acts as Zero which is plotted as a Bollinger on chart.
This is not a Bollinger band . its an RSI channel with levels 0-100 plotted around the mid band. The RSI Mid Band is calculated based on RSI value.
Trend:
Price above RSI Mid band is uptrend
Price below RSI Mid band is Down Trend
The Green line - Discount Zone - 0-RSI level - Oversold Zone
The Red Line - Premium Zone - 100 - RSI level - Overbought Zone
Buy / Sell signals
QQE Buy and Sell signals are plotted based on crossovers of RSI and Fast RSI crossovers.
QQE trend is colored based on the crossover.
Candle color:
candle color determines the Original QQE Trend.
Blue - QQE line above Threshold level in Buy Zone
Pink - QQE line below Threshold level in Sell Zone
Entries are to be made with proper confirmation.
HULL MA is provided as a MA Ribbon for additional confirmation. This MA can be changed to various forms Like EMA , SMA , WMA , HMA , RMA the open and close of the MA are plotted so it determines the exact Trend reversal of the price.
Credits to @Glaz QQE Threshold

Customizable Moving Average RibbonThis indicator is a highly customizable moving average ribbon with some unique features.
This script can utilize multiple unique sources, including a non-repainting renko closing price. Renko charts focus solely on price movement and minimize the impacts of time and the extra noise time creates. Employing the renko close helps smooth out the MA ribbon. Insignificant price movements will not cause a change in the plotted lines of the indicator unless a new threshold is breached or a "brick" is created. This is highly useful for quickly identifying consolidation areas or overall flat price movement.
There are two methods for selecting the box size when utilizing the renko source. Box size is critical for the overall function and efficacy of the plots you will visually see with this indicator. Box size is set automatically using the Average True Range "ATR" or manually using the "Traditional" setting. The simplest way to determine a manual box size is to take the ATR of the given instrument and round it to the nearest decimal place. As an example, if the ATR for the asset is 0.18, you would round that number to 0.2 and utilize this as your traditional box size.
The MA ribbon contains eleven adjustable moving average lines. Users can choose to turn off as many as they would like. Users can also adjust the length of the individual moving averages and the source for all moving averages. There are nine types of moving averages to choose from for the ribbon. The MA options are:
Exponential Moving Average = 'EMA'
Double Exponential Moving Average= 'DEMA'
Triple Exponential Moving Average = 'TEMA'
Simple Moving Average = 'SMA'
Relative Moving Average = 'RMA'
Volume Weighted Moving Average = 'VWMA'
Weighted Moving Average = 'WMA'
Smoothed Simple Moving Average = 'SSMA'
Hull Moving Average = 'HULL'
We believe that the ribbons features, including the line color change, help quickly identify trends and give users optimum customization. Users can select from five different color schemes including:
Green/Red
Purple/White
White/Blue
Silver / Orange
Teal/ Orange

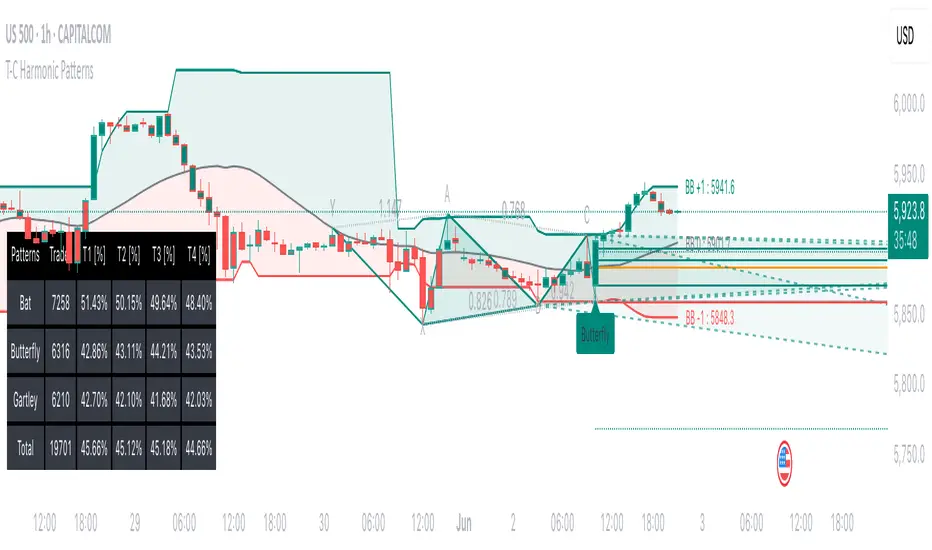
Tailored-Custom Hamonic Patterns█ OVERVIEW
We have included by default 3 known Patterns. The Bat, the Butterfly and the Gartley. But have you ever wondered how effective other,
not yet known models could be? Don't ask yourself the question anymore, it's time to find out for yourself! You have the option to customize
your own Patterns with the Backtesting tool and set Retracement Ratios and Targets for your own Patterns. In addition to this, in order to determine
the Trend at a glance and make Pattern detection more efficient, we have linked the calculation of Patterns to Bands of several types to choose
from (Bollinger, Keltner, Donchian) that you can select from a drop-down menu in the settings and play with the Multiplier
and the Adaptive Length of the Patterns to see how it affects the success rate in the Backtesting table.
█ HOW DOES IT WORK?
- Harmonic Patterns
-Pattern Names, Colors, Style etc… Everything is customizable.
-Dynamic Adaptative Length with Min/Max Length.
- XAB/ABC Ratio
-Min/Max XAB/ABC Configurable Ratio for each Pattern to create your own Patterns.
(This is really the particular option of this Indicator, because it allows you to be able to Backtest in real time
after having played at configuring your own Ratios)
- Bands
-Contrary to the original logic of the HeWhoMustNotBeNamed script, here when the price breaks out of the upper Bands
(example, Bollinger band, Keltner Channel or Donchian Channel) , with a predetermined Minimum and Maximum Length and Multiplier, we can consider
the Trend to be Bearish (and not Bullish) and similarly when the price breaks down in the lower band, we can consider the Trend
to be Bullish (not Bearish) . We have also added the middle line of the Channels (which can be useful for 'Scalper' type Traders.
-The Length of the Bands Filter is directly related to the Dynamic Length of the Patterns.
-You can use a drop-down menu to select from the following Bands Filters :
SMA, EMA, HMA, RMA, WMA, VWMA, HIGH/LOW, LINREG, MEDIAN.
-Sticky and Adaptive Bands options has been included.
- Projections
-BD/CD Projection Ratio configurable for each Pattern.
(Projections are visible as Dotted Lines which we can choose to Extend or not)
- Targets
-Target, PRZ and Stop Levels are set to optimal values based on individual Patterns. (The PRZ Level corresponds to point D
of the detected Pattern so its value should always be 0) but you can change the Targets value (defined in %) as you wish.
Again here, you have the option to fully configure the Style and Extend the Lines or not.
- Backtesting Table
-As said previously, with the possibility of testing the Success Rate of each of the 3 Customizable Patterns,
this option is part of the logic of this Indicator.
- Alerts
-We originally believe that this Indicator does not even need Alerts. But we still decided to include at least one Alert
that you can set for when a new Pattern is detected.
█ NOTES
Thanks to HeWhoMustNotBeNamed for his permission to reuse some part of his zigzag scripts.
Remember to only make a decision once you are sure of your analysis. Good trading sessions to everyone and don't forget,
risk management remains the most important!
Intrabar Analyzer [Kioseff Trading]Hello!
This indicator (Intrabar Analyzer) presents intrabar data in various derivative forms.
On-Chart Features
Traditional price data down to 1 min.
Heikin-Ashi price data down to 1 min.
Kagi price data down to 1 min.
Point & Figure price data down to 1 min.
Renko price data down to 1 min.
Linebreak price data down to 1 min.
LinReg channel
SMA
EMA
ALMA
Echomorphic Average (A @kaigouthro special!)
HMA
RMA
WMA
VWMA
VWAP
SWMA
SAR
Supertrend
On-Chart Features
Price x Volume graph
Intrabar technical rating
Positive volume index
Negative volume index
Price volume trend
RSI
%k
ROC
MFI
MFC
OBV
CCI
BBW
CMO
COG
KCW
MOM
RANGE
%r
Let's look at the objects populated by the indicator!
The image above shows what data correlates to the populated graphs!
Let's dial in on the price x volume graph.
The image above provides an example/explanation of the price x volume graph. All data is sourced from a lower timeframe (configurable - default = 1 minute).
Colors are configurable; the plot characters are configurable.
The numbers above show an alternative view of the price x volume graph!
Price graph
The price graph can populate 6 variations of price data: traditional, heikin-ashi, renko, point & figure, line break, and kagi.
The subsequent images will show all available forms of price data, in addition to a randomly selected, on-chart technical indicator!
Kagi + LinReg
Traditional + EMA
Renko + SAR
Point & Figure + ALMA
Heikin-Ashi + Supertrend
Line Break + VWAP
You can display up to three indicators concomitantly - all calculated using intrabar data!
Lastly, the indicator displays the TradingView calculated technical rating for the intrabar.
The technical ratings are multiplied by x100 and oriented left & right of the price box. Left values are negative; right values are positive. The "0" value is not shown; therefore, if the technical rating isn't highlighted then the rating is "0".
The image above shows the technical rating system in action (:
That's it!
This was a fun project and I'm certainly willing to add more - let me know if there's anything you'd like included.
Additionally, a future feature involves compatibility with any custom indicator! Stay tuned; thank you for checking this out (:
Thank you to @kaigouthro, TradingView and @PineCoders for providing some cool libraries to play with!

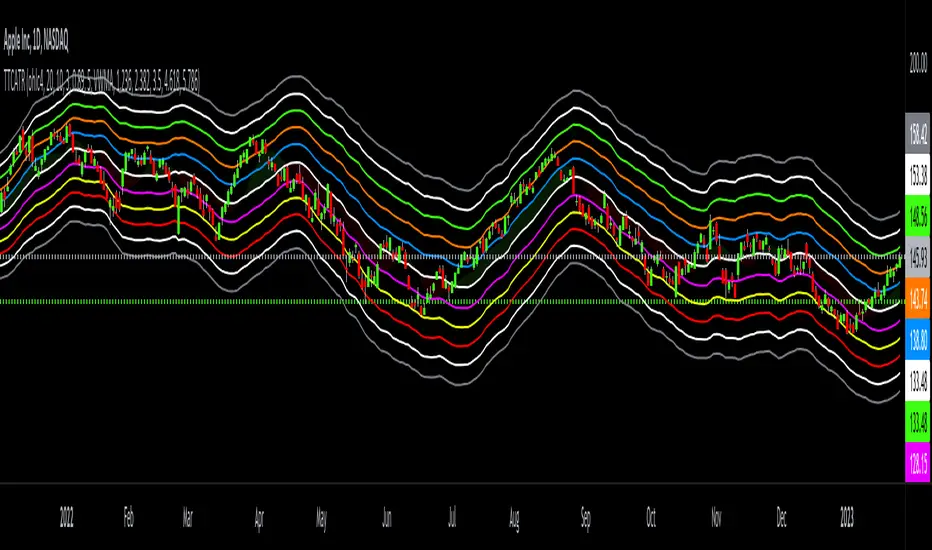
Triangular Trend Channel ATRTTCATR: Triangular Trend Channel ATR is a script to dynamically create a trend channel. It uses Moving Average & the Average True Range function to calculate support and resistance levels automatically.
The MA choices available are:
SMA = simple moving average
EMA = exponentially weighted moving average
RMA = moving average used in RSI
WMA = weighted moving average
VWMA = volume weighted moving average
VWAP = volume weighted average price
HMA = Hull moving average
SWMA = symmetrically weighted moving average
ALMA = Arnaud Legoux moving average
The default setting inputs are:
source = OHLC4
MA length = 20
MA signal = 10
ATR Multiply = 3
ALMA offset = 0.89
ALMA sigma = 5
Moving average type = VWMA
Level 1 ATR = 1.236
Level 2 ATR = 2.382
Level 3 ATR = 3.5
Level 4 ATR = 4.618
Level 5 ATR = 5.786
The default setting colors are:
Top = gray
R4 = white
R3 = green
R2 = orange
R1 = blue
pivot = white
(track pivot line = bullish is green, bearish is red)
S1 = purple
S2 = yellow
S3 = red
S4 = white
Bottom = gray
* This script uses altered pieces of code from my @Options360 TTC: Triangular Trend Channel and @TradingView "Intrabar Efficiency Ratio indicator". *
ER-Adaptive ATR Limit Channels w/ States [Loxx]As simple as it gets, channels based on high, low and ATR distances, Shows possible short term support / resistance or can be used as a take profit/stop-loss in some trading systems. It does this by comparing high/low values of price to multiplied by a multiple of ATR to determine when the trend changes. States are included to change the sensitivity to trend changes. 1 is very sensitive, 3 is least sensitive.
This uses Loxx's Expanded Source Types. You can read about them here:
What is ER Adaptive ATR?
Average True Range (ATR) is widely used indicator in many occasions for technical analysis . It is calculated as the RMA of true range. This version adds a "twist": it uses Perry Kaufman's Efficiency Ratio to calculate adaptive true range

Fair value bands / Flowly Indicators— Overview
Fair value bands, like other band tools, depict dynamic points in price where price behaviour is normal or abnormal, i.e. trading at/around mean (price at fair value) or deviating from mean (price outside fair value). Unlike constantly readjusting standard deviation based bands, fair value bands are designed to be smooth and constant, based on typical historical deviations. The script calculates pivots that take place above/below fair value basis and forms median deviation bands based on this information. These points are then multiplied up to 3, representing more extreme deviations.
By default, the script uses OHLC4 and SMA 20 as basis for the bands. Users can form their preferred fair value basis using following options:
Price source
- Standard OHLC values
- HL2 (High + low / 2)
- OHLC4 (Open + high + low + close / 4)
- HLC3 (High + low + close / 3)
- HLCC4 (High + low + close + close / 4)
Smoothing
- SMA
- EMA
- HMA
- RMA
- WMA
- VWMA
- Median
Once fair value basis is established, some additional customization options can be employed:
Trend mode
Direction based
Cross based
Trend modes affect fair value basis color that indicates trend direction. Direction based trend considers only the direction of the defined fair value basis, i.e. pointing up is considered an uptrend, vice versa for downtrend. Cross based trends activate when selected source (same options as price source) crosses fair value basis. These sources can be set individually for uptrend/downtrend cross conditions. By default, the script uses cross based trend mode with low and high as sources.
Cross based (downtrend not triggered) vs. direction based (downtrend triggered):
Threshold band
Threshold band is calculated using typical deviations when price is trading at fair value basis. In other words, a little bit of "wiggle room" is added around the mean based on expected deviation. This feature is useful for cross based trends, as it allows filtering insignificant crosses that are more likely just noise. By default, threshold band is calculated based on 1x median deviation from mean. Users can increase/decrease threshold band width via input menu for more/less noise filtering, e.g. 2x threshold band width would require price to cross wiggle room that is 2x wider than typical, 0x erases threshold band altogether.
Deviation bands
Width of deviation bands by default is based on 1x median deviations and can be increased/decreased in a similar manner to threshold bands.
Each combination of customization options produces varying behaviour in the bands. To measure the behaviour and finding fairest representation of fair and unfair value, some data is gathered.
— Fair value metrics
Space between each band is considered a lot, named +3, +2, +1, -1, -2, -3. For each lot, time spent and volume relative to volume moving average (SMA 20) is recorded each time price is trading in a given lot:
Depending on the asset, timeframe and chosen fair value basis, shape of the distributions vary. However, practically always time is distributed in a normal bell curve shape, being highest at lots +1 to -1, gradually decreasing the further price is from the mean. This is hardly surprising, but it allows accurately determining dynamic areas of normal and abnormal price behaviour (i.e. low risk area between +1 and -1, high risk area between +-2 to +-3). Volume on the other hand is typically distributed the other way around, being lowest at lots +1 to -1 and highest at +-2 to +-3. When time and volume are distributed like so, we can conclude that 1) price being outside fair value is a rare event and 2) the more price is outside fair value, the more anomaly behaviour in volume we tend to find.
Viewing metric calculations
Metric calculation highlights can be enabled from the input menu, resulting in a lot based coloring and visibility of each lot counter (time, cumulative relative volume and average relative volume) in data window:
— Alerts
Available alerts are the following:
Individual
- High crossing deviation band (bands +1 to +3 )
- Low crossing deviation band (bands -1 to -3 )
- Low at threshold band in an uptrend
- High at threshold band in a downtrend
- New uptrend
- New downtrend
Grouped
- New uptrend or downtrend
- Deviation band cross (+1 or -1)
- Deviation band cross (+2 or -2)
- Deviation band cross (+3 or -3)
— Practical guide
Example #1 : Risk on/risk off trend following
Ideal trend stays inside fair value and provides sufficient cool offs between the moves. When this is the case, fair value bands can be used for sensible entry/exit levels within the trend.
Example #2 : Mean reversions
When price shows exuberance into an extreme deviation, followed by a stall and signs of exhaustion (wicks), an opportunity for mean reversion emerges. The higher the deviation, the more volatility in the move, the more signalling of exhaustion, the better.
Example #3 : Tweaking bands for desired behaviour
The faster the length of fair value basis, the more momentum price needs to hit extreme deviation levels, as bands too are moving faster alongside price. Decreasing fair value basis length typically leads to more quick and aggressive deviations and less steady trends outside fair value.

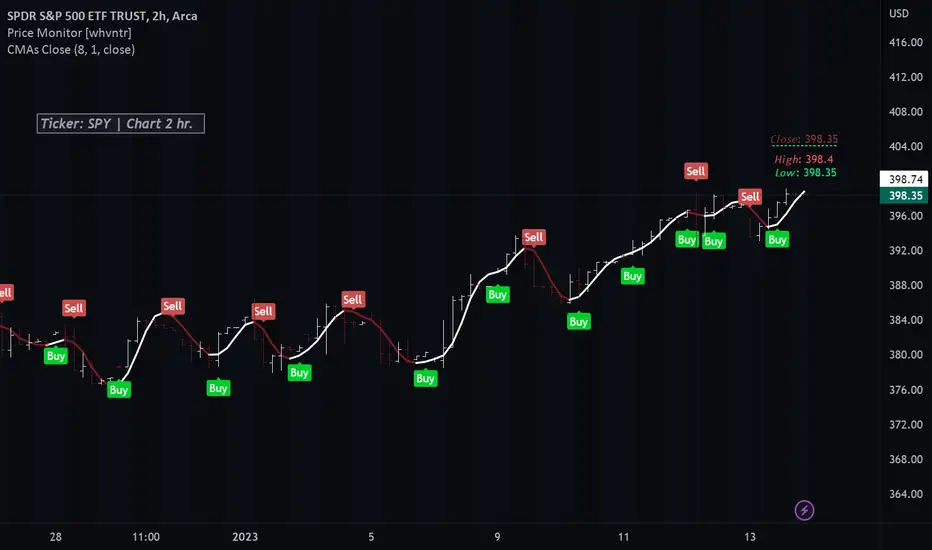
Squeeze Range: Bollinger Bands / Keltner Channels [Whvntr]Presenting Squeeze Range: Bollinger Bands / Keltner Channels
TTMSqueeze method is a volatility and momentum indicator introduced by John Carter of Simpler Trading, which capitalizes on the tendency for price to break out strongly after consolidating in a tight trading range.
How did I make this indicator? The Bollinger Bands & Keltner Channels base scripts are from the standard indicators of their class in the Technicals section... I made this indicator first then noticed there were 3 others with a similar concept, but this differs in it's unique features and application of the TTMSqueeze strategy. This indicator plots the True Range of the Keltner Channel (Customizable in 'Bands Style" in the Inputs Menu) the instances the Bollinger Bands are within the range of the Keltner channel (the market just entered a squeeze).
Featuring: customizable Moving Averages
1. Exponential (Default for both BB & KC)
2. Simple
3. RMA (MA used in RSI )
Keltner channels have a multiplier of 2 & 3 on the Chart (3 being the outer).
How do I use this indicator? Once the teal dots are inside the solid red lines this would indicate that TTMperiod of low market volatility (the market is preparing itself for an explosive move up or down). Do some research and study how to use the TTMSqueeze method by John Carter. Disclaimer: not a guarantee of future favorable results.

Forex Strength IndicatorThis indicator will display the strength of 8 currencies, EUR, AUD, NZD, JPY, USD, GBP, CHF, and CAD. Each line will represent each currency. Alongside that, Fibonacci levels will be plotted based on a standard deviation from linear regression, with customizable lengths.
For more steady Fibonacci levels, use higher lengths for both Standard Deviations and Linear Regression. All currency lines come from moving averages with options like EMA, SMA, WMA, RMA, HMA, SWMA, and Linear Regression.
When lines of the active pair are far from each other, it means higher divergence in those currency strengths among the other pairs. The closer the lines are, the lower the divergence.
You can use the Fibonacci levels as points for the reversal or end of the current trend. When the lines cross can be used as a parameter for a more accurate signal of the next movement.
All 28 pairs are loaded from the same time frame and will use the same moving average for all of them
Alerts from the line crossing are available.

Colored Moving Averages With Close Signals[Whvntr][TradeStation]Plots the first time the close price is above or below the colored portion of the chosen MA. The MA's formula is from TradeStation's indicator: "Colored Moving Averages Can Help You Spot Trends" . I modified that indicator with customizations that include: Buy and Sell signals. Each time the current bar closes above the MA, while it's red (bearish), there's a Sell label at the start of that MA trend. Likewise: each time the current bar closes below the MA, while it's white (bullish), there's a Buy label at the beginning of that MA trend. You can now, also, easily see which MA you are selecting by hovering your cursor over the tooltips icon. I've included a modified Hull MA as default because I've found this SMA combination with the WMA to be a very smooth oscillation. I've also added some different types of MA's. Colored moving averages are helpful to determine when a trend may be reversing.
MA's
1 · Modified Hull MA: (SMA of the WMAs Hull Formula)
2 · Hull MA
3 · Exponential Moving Average
4 · Weighted Moving Average
5 · RMA Moving Average used in RSI
6 · Volume Weighted MA
7 · Simple Moving Average
This indicator isn't endorsed as a guarantee of future, favorable, results.
RAINBOW_13thHi Dears!
hereby, I present you one of my indicators which is a kind of artistic indicator.
It calculates different ranks of functions and based on them suggests a buy or sell order which is depicted on right-side separately.
Inputs:
(For calculating)
+Source:
+Length: Number of previous bars in calculation
+Topology:
++EMA
++RMA
++SMA
++RSI
+OVER BOUGHT RSI: Define your boundary for overbought in RSI-TOPOLOGY.
+OVER SOLD RSI: Define your boundary for oversold in RSI-TOPOLOGY.
(Visual)
+Transparency: affect colors of rainbow!
Wish you good deals!
BY USING PLZ DO NOT FORGET TO BOOST IT!
Shakib.
