Configurable Multi MA Crossover Voting SystemThis strategy goes long when all fast moving averages that you have defined are above their counterpart slow moving averages.
Long position is closed when profit or loss target is hit and at least one of the fast moving averages is below its counterpart slow moving average.
The format of the config is simple. The format is : FASTxSLOW,FASTxSLOW,...
Example : If you want 2 moving averages fast=9,slow=14 and fast=20,slow=50 you define it like this : 9x14,20x50
Another example : 5x10,10x15,15x20 => means 3 moving average setups : first wih fast=5/slow=10, second with fast=10/slow=15, last with fast=15/slow=20
You can chose the type of moving average : SMA, WMA, VWMA (i got issues with EMA/RMA so i removed them)
You can chose the source of the moving average : high, close, hl2 etc.
You can chose the period on which ATR is calculated and ATR profit/loss factors.
Profit is calculated like : buy_price + atr_factor*atr
Loss is calculated like : buy_price - atr_factor*atr
Performance in backtest is variable depending on the timeframe, the options and the market.
Performance in backtest suggests it works better for higher timeframes like 1d, 4h etc.
Disclaimer
Please remember that past performance may not be indicative of future results.
Due to various factors, including changing market conditions, the strategy may no longer perform as well as in historical backtesting.
This post and the script don’t provide any financial advice.
Cerca negli script per "rma"

Pythagorean Means of Moving AveragesDESCRIPTION
Pythagorean Means of Moving Averages
1. Calculates a set of moving averages for high, low, close, open and typical prices, each at multiple periods.
Period values follow the Fibonacci sequence.
The "short" set includes moving average having the following periods: 5, 8, 13, 21, 34, 55, 89, 144, 233, 377.
The "mid" set includes moving average having the following periods: 5, 8, 13, 21, 34, 55, 89, 144, 233, 377, 610, 987, 1597.
The "long" set includes moving average having the following periods: 5, 8, 13, 21, 34, 55, 89, 144, 233, 377, 610, 987, 1597, 2584, 4181.
2. User selects the type of moving average: SMA, EMA, HMA, RMA, WMA, VWMA.
3. Calculates the mean of each set of moving averages.
4. User selects the type of mean to be calculated: 1) arithmetic, 2) geometric, 3) harmonic, 4) quadratic, 5) cubic. Multiple mean calculations may be displayed simultaneously, allowing for comparison.
5. Plots the mean for high, low, close, open, and typical prices.
6. User selects which plots to display: 1) high and low prices, 2) close prices, 3) open prices, and/or 4) typical prices.
7. Calculates and plots a vertical deviation from an origin mean--the mean from which the deviation is measured.
8. Deviation = origin mean x a x b^(x/y)/c.
9. User selects the deviation origin mean: 1) high and low prices plot, 2) close prices plot, or 3) typical prices plot.
10. User defines deviation variables a, b, c, x and y.
Examples of deviation:
a) Percent of the mean = 1.414213562 = 2^(1/2) = Pythagoras's constant (default).
b) Percent of the mean = 0.7071067812 = = = sin 45˚ = cos 45˚.
11. Displaces the plots horizontally +/- by a user defined number of periods.
PURPOSE
1. Identify price trends and potential levels of support and resistance.
CREDITS
1. "Fibonacci Moving Average" by Sofien Kaabar: two plots, each an arithmetic mean of EMAs of 1) high prices and 2) low prices, with periods 5, 8, 13, 21, 34, 55, 89, 144, 233, 377, 610, 987, 1597, 2584, 4181.
2. "Solarized" color scheme by Ethan Schoonover.

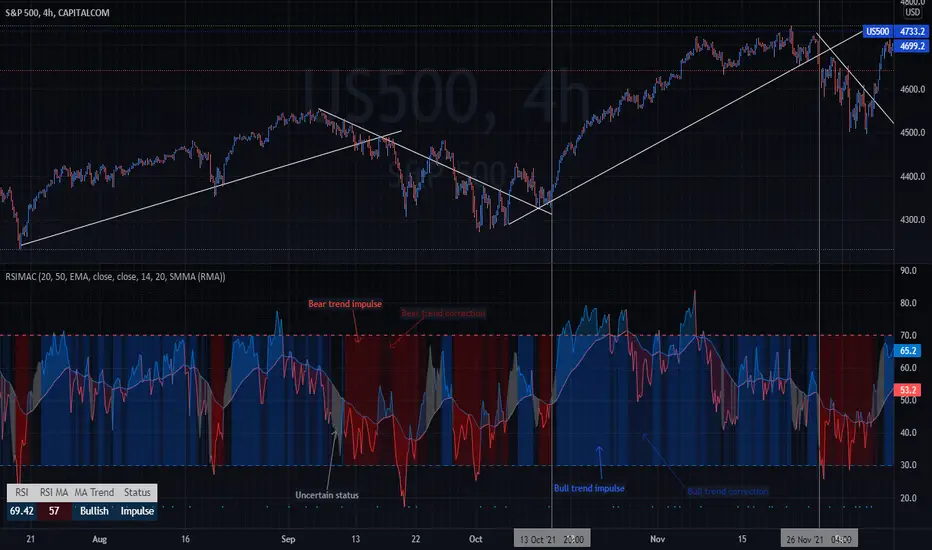
RSI Moving Average CrossoversThis script is an improved version of the RSI indicator, using a moving average on the RSI itself, as well as two other moving averages used to determine the current trend.
A small screener indicating the current movement is displayed in the bottom-left zone of the chart: trend (Bullish/Bearish/Uncertain) and status (Impulse or Correction)
Trends are simply based on moving averages crossovers, coupled to the fact that the current candle closes above the fast MA in a bull trend, and under the fast MA in a bear trend. In other cases, the trend and the movement are considered as "Uncertain" by the indicator.
Options
Various types of moving averages for the RSI and trend MA
Show/Hide crossovers between the RSI and its MA
Color the RSI normal zone with the current trend/movement colors
Show/Hide the screener indicating the current movement
Defaults Parameters
Fast MA 20
Slow MA 50
MA source: Close
RSI Length 14
RSI MA: SMMA (RMA)
RSI MA Length: 20
Don't hesitate to suggest any idea which could improve this indicator.
Moving Average Multitool CrossoverAs per request, this is a moving average crossover version of my original moving average multitool script .
It allows you to easily access and switch between different types of moving averages, without having to continuously add and remove different moving averages from your chart. This should make backtesting moving average crossovers much, much more easier. It also has the option to show buy and sell signals for the crossovers of the chosen moving averages.
It contains the following moving averages:
Exponential Moving Average (EMA)
Simple Moving Average (SMA)
Weighted Moving Average (WMA)
Double Exponential Moving Average (DEMA)
Triple Exponential Moving Average (TEMA)
Triangular Moving Average (TMA)
Volume-Weighted Moving Average (VWMA)
Smoothed Moving Average (SMMA)
Hull Moving Average (HMA)
Least Squares Moving Average (LSMA)
Kijun-Sen line from the Ichimoku Kinko-Hyo system (Kijun)
McGinley Dynamic (MD)
Rolling Moving Average (RMA)
Jurik Moving Average (JMA)
Arnaud Legoux Moving Average (ALMA)
Vector Autoregression Moving Average (VAR)
Welles Wilder Moving Average (WWMA)
Sine Weighted Moving Average (SWMA)
Leo Moving Average (LMA)
Variable Index Dynamic Average (VIDYA)
Fractal Adaptive Moving Average (FRAMA)
Variable Moving Average (VAR)
Geometric Mean Moving Average (GMMA)
Corrective Moving Average (CMA)
Moving Median (MM)
Quick Moving Average (QMA)
Kaufman's Adaptive Moving Average (KAMA)
Volatility-Adjusted Moving Average (VAMA)
Modular Filter (MF)

Keltner Channel With User Selectable Moving AvgKeltner Channel with user options to calculate the moving average basis and envelopes from a variety of different moving averages.
The user selects their choice of moving average, and the envelopes automatically adjust. The user may select a MA that reacts faster to volatility or slower/smoother.
Added additional options to color the envelopes or basis based on the current trend and alternate candle colors for envelope touches. The script has a rainbow gradient by default based on RSI.
Options (generally from slower/smoother to faster/more responsive to volatility):
SMMA,
SMA,
Donchian, (Note: Selecting Donchian will just convert this indicator to a regular Donchian Channel)
Tillson T3,
EMA,
VWMA,
WMA,
EHMA,
ALMA,
LSMA,
HMA,
TEMA
Value Added:
Allows Keltner Channel to be calculated from a variety of moving averages other than EMA/SMA, including ones that are well liked by traders such as Tillson T3, ALMA, Hull MA, and TEMA.
Glossary:
The Hull Moving Average ( HMA ), developed by Alan Hull, is an extremely fast and smooth moving average . In fact, the HMA almost eliminates lag altogether and manages to improve smoothing at the same time.
The Exponential Hull Moving Average is similar to the standard Hull MA, but with superior smoothing. The standard Hull Moving Average is derived from the weighted moving average ( WMA ). As other moving average built from weighted moving averages it has a tendency to exaggerate price movement.
Weighted Moving Average: A Weighted Moving Average ( WMA ) is similar to the simple moving average ( SMA ), except the WMA adds significance to more recent data points.
Arnaud Legoux Moving Average: ALMA removes small price fluctuations and enhances the trend by applying a moving average twice, once from left to right, and once from right to left. At the end of this process the phase shift (price lag) commonly associated with moving averages is significantly reduced. Zero-phase digital filtering reduces noise in the signal. Conventional filtering reduces noise in the signal, but adds a delay.
Least Squares: Based on sum of least squares method to find a straight line that best fits data for the selected period. The end point of the line is plotted and the process is repeated on each succeeding period.
Triple EMA (TEMA) : The triple exponential moving average (TEMA) was designed to smooth price fluctuations, thereby making it easier to identify trends without the lag associated with traditional moving averages (MA). It does this by taking multiple exponential moving averages (EMA) of the original EMA and subtracting out some of the lag.
Running (SMoothed) Moving Average: A Modified Moving Average (MMA) (otherwise known as the Running Moving Average (RMA), or SMoothed Moving Average (SMMA)) is an indicator that shows the average value of a security's price over a period of time. It works very similar to the Exponential Moving Average, they are equivalent but for different periods (e.g., the MMA value for a 14-day period will be the same as EMA-value for a 27-days period).
Volume-Weighted Moving Average: The Volume-weighted Moving Average (VWMA) emphasizes volume by weighing prices based on the amount of trading activity in a given period of time. Users can set the length, the source and an offset. Prices with heavy trading activity get more weight than prices with light trading activity.
Tillson T3: The Tillson moving average a.k.a. the Tillson T3 indicator is one of the smoothest moving averages and is both composite and adaptive.

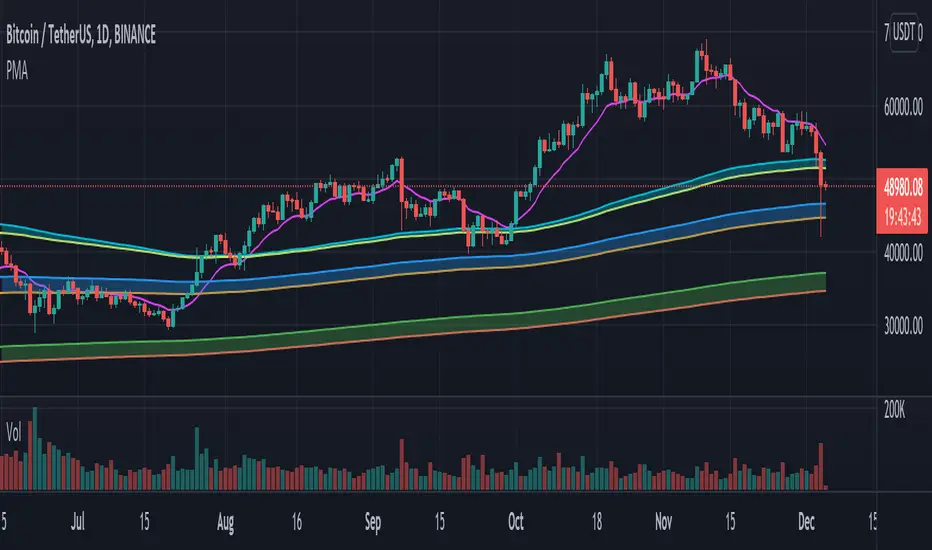
Pulu's Moving AveragesPulu's Moving Averages
This script allows you to customize sets of moving averages. It is configured default as 3 Vegas tunnels + an MA12. You can re-configure it for any of your moving average studies. At the first release, it supports up to 7 moving averages, many parameters, and eight types of algorithms:
ALMA, Arnaud Legoux Moving Average
EMA, Exponential Moving Average
RMA, Adjusted exponential moving average (aka Wilder’s EMA)
SMA, Simple Moving Average
SWMA, Symmetrically-Weighted Moving Average
VWAP, Volume-Weighted Average Price
VWMA, Volume-Weighted Moving Average
WMA, Weighted Moving Average
If you are looking for only 3 moving averages, there is another script "Pulu's 3 Moving Averages".
Dominion - Bitcoin Altcoin Dominance [mutantdog]A simple and easy reference tool displaying a plot of the market cap dominance values for several significant cryptocurrencies.
The most widely used of these is bitcoin dominance (the top indicator shown above) which calculates the total market cap of bitcoin in relation to the total cryptocurrency market cap, displayed as a percentage. This is commonly used by traders to assess the strength of bitcoin in relation to the broader crypto market; increasing values being indicative of larger bitcoin moves and decreasing values often indicative of potential altcoin cycles. Likewise, ethereum dominance (the bottom indicator shown above) is frequently used as a means to indicate the strength of ethereum in relation to the broader crypto market.
Included options for marketcap dominance values are:
Bitcoin : CRYPTOCAP:BTC.D
Ethereum : CRYPTOCAP:ETH.D
Total DeFi (a composite of multiple top defi tokens): CRYPTOCAP:TOTALDEFI.D
Stablecoins (shows the combined dominance values for usdt and usdc): CRYPTOCAP:USDT.D + CRYPTOCAP:USDC.D
Flippening (shows the difference between bitcoin and ethereum dominance values): CRYPTOCAP:BTC.D - CRYPTOCAP:ETH.D
When used in combination with each other, these can provide a good overview of the general flow of capital within the crypto market.
Additional functionality:
up to three optional moving averages with a choice of SMA, EMA, WMA and RMA for each.
multi timeframe selector
alert condition presets for various moving average crosses.
Please be aware that, while useful as reference, dominance calculations are known to repaint frequently. As such the use of this indicator and its alerts should require caution.

Bollinger bands and Keltner bands
█ OVERVIEW
This is a Bollinger band Script, with Keltner Channel Bands and for scalping.
█ CONCEPTS
1 — Bollinger Bands, The Bollinger band component is make out from two part, the standard component represented by a white cloud.
This is the 2nd deviation and 3rd deviation filled.
The second part linear weight
This is the 2nd deviation, and is filled from the 3rd deviation from the standard bands. This give the effect of cutting in and out to proved a support and resistance cloud.
2 — Keltner bands, this is the normal calculation, nothing special, by default this is off and can be turned back on in styles.
3 Deviations with ALMA as the Basis
3 — Non-traditional basis
Like with you can change the base moving average
but to a lesser extent.
option are:
sma = Simple Moving Average
ema = Exponential Moving Average
wma = Weighted Moving Average
vwma = Volume Weighted Moving Average
rma = Running Moving Average
alma = Arnaud Legoux Moving Average
hma = Hull Moving Average
█ OTHER SECTIONS
• LIMITATIONS: again this is base on moving average so there is a lag factor, the cloud do not work without volume so if the indicator can not pull volume data you are left with the standard bands.
• NOTE this is a trimmed version of still functions the same.
• THANKS: rumpypumpydumpy for the inspiration

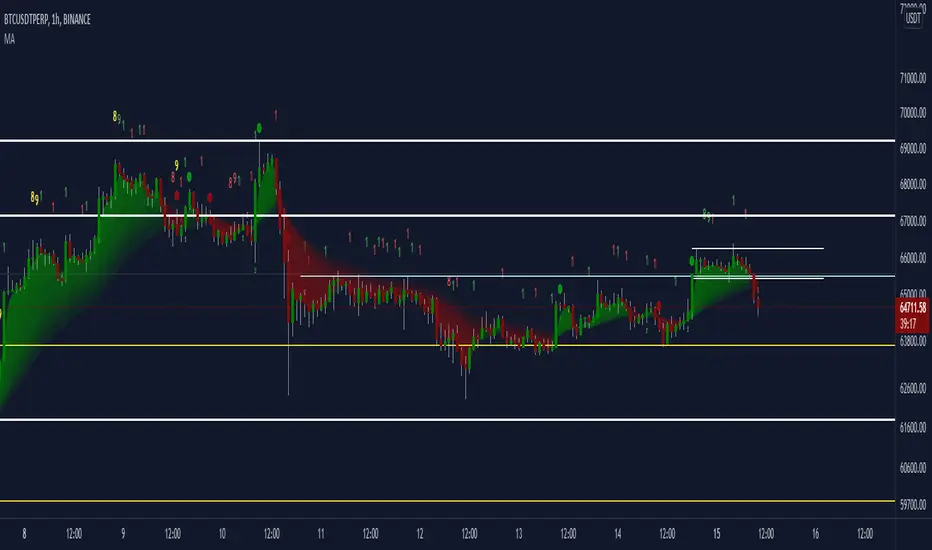
Moving Average Trend█ OVERVIEW
This is a Moving Average Script that contains both a cloud and a ribbon that has independent MA-type selection.
⬆ green arrow up = up trend flip
⬇ red arrow down = down trend flip
🟢 Green Dot = Potential Long
🔴 Red Dot = Potential Short
█ CONCEPTS
1 — Cloud, like most trading algo, the cloud is made of 8 short term MA , with MA cross and MA cross (longema)
2 — Ribbon, this is by default turned off, the default values , an option in setting to change longema to look for ribbon cross
3 — Sequence, It goes from 1 – 9 at 9 the sequence resets. The sequence changes colour depending on if it’s a down trend(red) or uptrend(green) or an over extended trend (yellow)
Setup definitions
Red sell start = current close < the close 4 candles back
Yellow sell extended = current close < last close and current close < two closes back
Green buy start = current close > the close 4 candles back
Yellow buy extended = current close last close and current close < two closes back
This can help you find when it’s time to get out, or sit out of a choppy trend.
4 - Moving Average types:
sma = Simple Moving Average
ema = Exponential Moving Average
wma = Weighted Moving Average
vwma = Volume Weighted Moving Average
rma = Running Moving Average
alma = Arnaud Legoux Moving Average
hma = Hull Moving Average
jma = Jurik Moving Average
frama-o = frama
frama-m = frama mod
dema = Double Exponential Moving Average
tema = Triple Exponential Moving Average
zlema = Zero lag Exponential Moving Average
smma = Smoothed Moving Average
kma = kaufman Moving Average
tma = triangular Moving Average
gmma = Geometric Mean Moving Average
vida = Variable Index Dynamic Average
cma = Corrective Moving average
rema = Range Exponential Moving average
█ OTHER SECTIONS
• FEATURES: to describe the detailed features of the script, usually arranged in the same order as users will find them in the script's inputs.
• HOW TO USE
• LIMITATIONS: Like with any MA script there is a lag factor associated with is.
• RAMBLINGS: Experiment to your hearts content with all the MA types, I'm impartial to HMA as is
• NOTES: some of the MA's are more taxing, therefore take longer to load, be patience, this is a trimmed down version of an existing invite only script i have
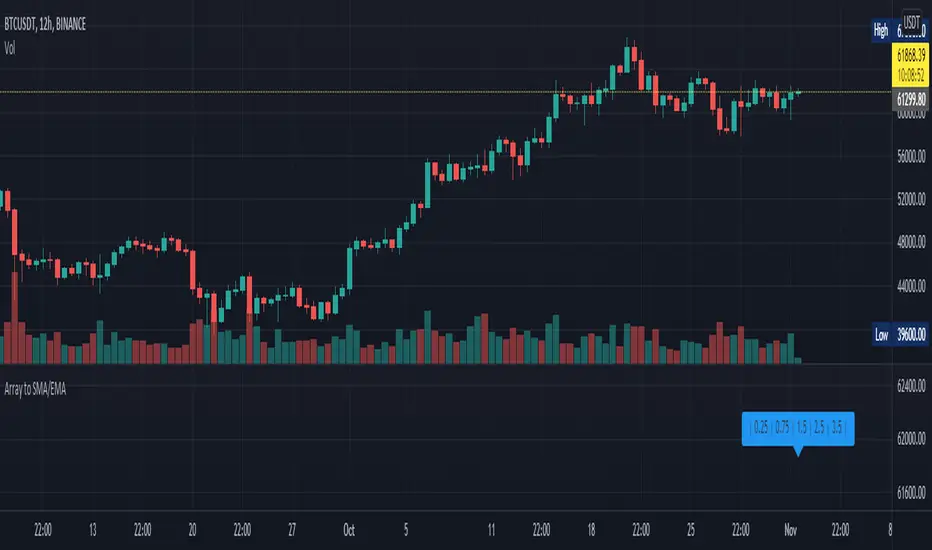
Array to SMA/EMAThis script is to help people with converting arrays to Simple Moving Average and Exponential Moving Average arrays. It is the same as using ta.sma() or ta.ema() in v5 with series but it takes an array as input instead. Both functions have inbuilt bad-input checking logic to ensure that the period length is not too high or too low - which could give unwanted results. If such values are used, the functions will output an array of the same length with NaN values. The EMA function also has an optional argument called sma_seed , which determines whether the first value in the output array will be the SMA of the first value from the input array (true) or the first value itself (false). Both functions work independently of one another, all you have to do is copy the entire function into your code and off you go! I can add more functions such as RMA or VWMA if there is demand, let me know and leave a like! ~ if you want.
Hx MTF Moving AverageThis script provides a quick and easy access to different timeframes of a moving average in one indicator and one tab.
It handles up to 4 different timeframes and the current timeframe if it is different from the preset timeframes.
The moving average is not displayed if the current timeframe is higher than the preset timeframe, as per TradingView recommandations.
Available moving average types: sma , wma , ema , vwma , rma (RSI), hma (Hull) and smma (Smoothed).
The default settings provide an example of commonly used timeframes with associated colors ranked from Hot (shorter, more nervous) to Cold (longer, less nervous) while the current timeframe is displayed in gray.
These settings are just an example and are NOT meant to be used as a trading system! DYOR!

lib_Indicators_DTLibrary "lib_Indicators_DT"
This library functions returns some Moving averages and indicators.
Created it to feed my indicator/strategy "INDICATOR & CONDITIONS COMBINATOR FRAMEWORK v1 " which I will publish it as soon as possible.
Credits: Library includes some public indicators, snippets from tradingview & @03.freeman's ("All MAs displayed") scripts.
(I hope, I dont break Tradingview's House Rules on Script Publishing)
f_plotPrep(src_, src_, src_, src_) Prepare Indicator Plot Type
Parameters:
src_ : Source
src_ : plotingType_ "Original, Stochastic, Percent"
src_ : stochlen_ Stochasting plottingtype length
src_ : plotSWMA_ Use SWMA for the output
Returns: Return the prepared indicator
f_funcPlot(string, float, simple, string, simple, bool) f_funcPlot(string f, float src_, simple int length_, string plotingType_ = "Original", simple int stochlen_=50, bool plotSWMA=false) Return selected indicator value with different parameters
Parameters:
string : f indicator-> options=
float : src_ close,open.....
simple : int length_ indicator length
string : plotingType return param-> options= ['Original', 'Stochastic', 'PercentRank')
simple : int stochlen_ length for return Param
bool : plotSWMA Use SWMA on Plot
Returns: float

taLibrary "ta"
█ OVERVIEW
This library holds technical analysis functions calculating values for which no Pine built-in exists.
Look first. Then leap.
█ FUNCTIONS
cagr(entryTime, entryPrice, exitTime, exitPrice)
It calculates the "Compound Annual Growth Rate" between two points in time. The CAGR is a notional, annualized growth rate that assumes all profits are reinvested. It only takes into account the prices of the two end points — not drawdowns, so it does not calculate risk. It can be used as a yardstick to compare the performance of two instruments. Because it annualizes values, the function requires a minimum of one day between the two end points (annualizing returns over smaller periods of times doesn't produce very meaningful figures).
Parameters:
entryTime : The starting timestamp.
entryPrice : The starting point's price.
exitTime : The ending timestamp.
exitPrice : The ending point's price.
Returns: CAGR in % (50 is 50%). Returns `na` if there is not >=1D between `entryTime` and `exitTime`, or until the two time points have not been reached by the script.
█ v2, Mar. 8, 2022
Added functions `allTimeHigh()` and `allTimeLow()` to find the highest or lowest value of a source from the first historical bar to the current bar. These functions will not look ahead; they will only return new highs/lows on the bar where they occur.
allTimeHigh(src)
Tracks the highest value of `src` from the first historical bar to the current bar.
Parameters:
src : (series int/float) Series to track. Optional. The default is `high`.
Returns: (float) The highest value tracked.
allTimeLow(src)
Tracks the lowest value of `src` from the first historical bar to the current bar.
Parameters:
src : (series int/float) Series to track. Optional. The default is `low`.
Returns: (float) The lowest value tracked.
█ v3, Sept. 27, 2022
This version includes the following new functions:
aroon(length)
Calculates the values of the Aroon indicator.
Parameters:
length (simple int) : (simple int) Number of bars (length).
Returns: ( [float, float ]) A tuple of the Aroon-Up and Aroon-Down values.
coppock(source, longLength, shortLength, smoothLength)
Calculates the value of the Coppock Curve indicator.
Parameters:
source (float) : (series int/float) Series of values to process.
longLength (simple int) : (simple int) Number of bars for the fast ROC value (length).
shortLength (simple int) : (simple int) Number of bars for the slow ROC value (length).
smoothLength (simple int) : (simple int) Number of bars for the weigted moving average value (length).
Returns: (float) The oscillator value.
dema(source, length)
Calculates the value of the Double Exponential Moving Average (DEMA).
Parameters:
source (float) : (series int/float) Series of values to process.
length (simple int) : (simple int) Length for the smoothing parameter calculation.
Returns: (float) The double exponentially weighted moving average of the `source`.
dema2(src, length)
An alternate Double Exponential Moving Average (Dema) function to `dema()`, which allows a "series float" length argument.
Parameters:
src : (series int/float) Series of values to process.
length : (series int/float) Length for the smoothing parameter calculation.
Returns: (float) The double exponentially weighted moving average of the `src`.
dm(length)
Calculates the value of the "Demarker" indicator.
Parameters:
length (simple int) : (simple int) Number of bars (length).
Returns: (float) The oscillator value.
donchian(length)
Calculates the values of a Donchian Channel using `high` and `low` over a given `length`.
Parameters:
length (int) : (series int) Number of bars (length).
Returns: ( [float, float, float ]) A tuple containing the channel high, low, and median, respectively.
ema2(src, length)
An alternate ema function to the `ta.ema()` built-in, which allows a "series float" length argument.
Parameters:
src : (series int/float) Series of values to process.
length : (series int/float) Number of bars (length).
Returns: (float) The exponentially weighted moving average of the `src`.
eom(length, div)
Calculates the value of the Ease of Movement indicator.
Parameters:
length (simple int) : (simple int) Number of bars (length).
div (simple int) : (simple int) Divisor used for normalzing values. Optional. The default is 10000.
Returns: (float) The oscillator value.
frama(source, length)
The Fractal Adaptive Moving Average (FRAMA), developed by John Ehlers, is an adaptive moving average that dynamically adjusts its lookback period based on fractal geometry.
Parameters:
source (float) : (series int/float) Series of values to process.
length (int) : (series int) Number of bars (length).
Returns: (float) The fractal adaptive moving average of the `source`.
ft(source, length)
Calculates the value of the Fisher Transform indicator.
Parameters:
source (float) : (series int/float) Series of values to process.
length (simple int) : (simple int) Number of bars (length).
Returns: (float) The oscillator value.
ht(source)
Calculates the value of the Hilbert Transform indicator.
Parameters:
source (float) : (series int/float) Series of values to process.
Returns: (float) The oscillator value.
ichimoku(conLength, baseLength, senkouLength)
Calculates values of the Ichimoku Cloud indicator, including tenkan, kijun, senkouSpan1, senkouSpan2, and chikou. NOTE: offsets forward or backward can be done using the `offset` argument in `plot()`.
Parameters:
conLength (int) : (series int) Length for the Conversion Line (Tenkan). The default is 9 periods, which returns the mid-point of the 9 period Donchian Channel.
baseLength (int) : (series int) Length for the Base Line (Kijun-sen). The default is 26 periods, which returns the mid-point of the 26 period Donchian Channel.
senkouLength (int) : (series int) Length for the Senkou Span 2 (Leading Span B). The default is 52 periods, which returns the mid-point of the 52 period Donchian Channel.
Returns: ( [float, float, float, float, float ]) A tuple of the Tenkan, Kijun, Senkou Span 1, Senkou Span 2, and Chikou Span values. NOTE: by default, the senkouSpan1 and senkouSpan2 should be plotted 26 periods in the future, and the Chikou Span plotted 26 days in the past.
ift(source)
Calculates the value of the Inverse Fisher Transform indicator.
Parameters:
source (float) : (series int/float) Series of values to process.
Returns: (float) The oscillator value.
kvo(fastLen, slowLen, trigLen)
Calculates the values of the Klinger Volume Oscillator.
Parameters:
fastLen (simple int) : (simple int) Length for the fast moving average smoothing parameter calculation.
slowLen (simple int) : (simple int) Length for the slow moving average smoothing parameter calculation.
trigLen (simple int) : (simple int) Length for the trigger moving average smoothing parameter calculation.
Returns: ( [float, float ]) A tuple of the KVO value, and the trigger value.
pzo(length)
Calculates the value of the Price Zone Oscillator.
Parameters:
length (simple int) : (simple int) Length for the smoothing parameter calculation.
Returns: (float) The oscillator value.
rms(source, length)
Calculates the Root Mean Square of the `source` over the `length`.
Parameters:
source (float) : (series int/float) Series of values to process.
length (int) : (series int) Number of bars (length).
Returns: (float) The RMS value.
rwi(length)
Calculates the values of the Random Walk Index.
Parameters:
length (simple int) : (simple int) Lookback and ATR smoothing parameter length.
Returns: ( [float, float ]) A tuple of the `rwiHigh` and `rwiLow` values.
stc(source, fast, slow, cycle, d1, d2)
Calculates the value of the Schaff Trend Cycle indicator.
Parameters:
source (float) : (series int/float) Series of values to process.
fast (simple int) : (simple int) Length for the MACD fast smoothing parameter calculation.
slow (simple int) : (simple int) Length for the MACD slow smoothing parameter calculation.
cycle (simple int) : (simple int) Number of bars for the Stochastic values (length).
d1 (simple int) : (simple int) Length for the initial %D smoothing parameter calculation.
d2 (simple int) : (simple int) Length for the final %D smoothing parameter calculation.
Returns: (float) The oscillator value.
stochFull(periodK, smoothK, periodD)
Calculates the %K and %D values of the Full Stochastic indicator.
Parameters:
periodK (simple int) : (simple int) Number of bars for Stochastic calculation. (length).
smoothK (simple int) : (simple int) Number of bars for smoothing of the %K value (length).
periodD (simple int) : (simple int) Number of bars for smoothing of the %D value (length).
Returns: ( [float, float ]) A tuple of the slow %K and the %D moving average values.
stochRsi(lengthRsi, periodK, smoothK, periodD, source)
Calculates the %K and %D values of the Stochastic RSI indicator.
Parameters:
lengthRsi (simple int) : (simple int) Length for the RSI smoothing parameter calculation.
periodK (simple int) : (simple int) Number of bars for Stochastic calculation. (length).
smoothK (simple int) : (simple int) Number of bars for smoothing of the %K value (length).
periodD (simple int) : (simple int) Number of bars for smoothing of the %D value (length).
source (float) : (series int/float) Series of values to process. Optional. The default is `close`.
Returns: ( [float, float ]) A tuple of the slow %K and the %D moving average values.
supertrend(factor, atrLength, wicks)
Calculates the values of the SuperTrend indicator with the ability to take candle wicks into account, rather than only the closing price.
Parameters:
factor (float) : (series int/float) Multiplier for the ATR value.
atrLength (simple int) : (simple int) Length for the ATR smoothing parameter calculation.
wicks (simple bool) : (simple bool) Condition to determine whether to take candle wicks into account when reversing trend, or to use the close price. Optional. Default is false.
Returns: ( [float, int ]) A tuple of the superTrend value and trend direction.
szo(source, length)
Calculates the value of the Sentiment Zone Oscillator.
Parameters:
source (float) : (series int/float) Series of values to process.
length (simple int) : (simple int) Length for the smoothing parameter calculation.
Returns: (float) The oscillator value.
t3(source, length, vf)
Calculates the value of the Tilson Moving Average (T3).
Parameters:
source (float) : (series int/float) Series of values to process.
length (simple int) : (simple int) Length for the smoothing parameter calculation.
vf (simple float) : (simple float) Volume factor. Affects the responsiveness.
Returns: (float) The Tilson moving average of the `source`.
t3Alt(source, length, vf)
An alternate Tilson Moving Average (T3) function to `t3()`, which allows a "series float" `length` argument.
Parameters:
source (float) : (series int/float) Series of values to process.
length (float) : (series int/float) Length for the smoothing parameter calculation.
vf (simple float) : (simple float) Volume factor. Affects the responsiveness.
Returns: (float) The Tilson moving average of the `source`.
tema(source, length)
Calculates the value of the Triple Exponential Moving Average (TEMA).
Parameters:
source (float) : (series int/float) Series of values to process.
length (simple int) : (simple int) Length for the smoothing parameter calculation.
Returns: (float) The triple exponentially weighted moving average of the `source`.
tema2(source, length)
An alternate Triple Exponential Moving Average (TEMA) function to `tema()`, which allows a "series float" `length` argument.
Parameters:
source (float) : (series int/float) Series of values to process.
length (float) : (series int/float) Length for the smoothing parameter calculation.
Returns: (float) The triple exponentially weighted moving average of the `source`.
trima(source, length)
Calculates the value of the Triangular Moving Average (TRIMA).
Parameters:
source (float) : (series int/float) Series of values to process.
length (int) : (series int) Number of bars (length).
Returns: (float) The triangular moving average of the `source`.
trima2(src, length)
An alternate Triangular Moving Average (TRIMA) function to `trima()`, which allows a "series int" length argument.
Parameters:
src : (series int/float) Series of values to process.
length : (series int) Number of bars (length).
Returns: (float) The triangular moving average of the `src`.
trix(source, length, signalLength, exponential)
Calculates the values of the TRIX indicator.
Parameters:
source (float) : (series int/float) Series of values to process.
length (simple int) : (simple int) Length for the smoothing parameter calculation.
signalLength (simple int) : (simple int) Length for smoothing the signal line.
exponential (simple bool) : (simple bool) Condition to determine whether exponential or simple smoothing is used. Optional. The default is `true` (exponential smoothing).
Returns: ( [float, float, float ]) A tuple of the TRIX value, the signal value, and the histogram.
uo(fastLen, midLen, slowLen)
Calculates the value of the Ultimate Oscillator.
Parameters:
fastLen (simple int) : (series int) Number of bars for the fast smoothing average (length).
midLen (simple int) : (series int) Number of bars for the middle smoothing average (length).
slowLen (simple int) : (series int) Number of bars for the slow smoothing average (length).
Returns: (float) The oscillator value.
vhf(source, length)
Calculates the value of the Vertical Horizontal Filter.
Parameters:
source (float) : (series int/float) Series of values to process.
length (simple int) : (simple int) Number of bars (length).
Returns: (float) The oscillator value.
vi(length)
Calculates the values of the Vortex Indicator.
Parameters:
length (simple int) : (simple int) Number of bars (length).
Returns: ( [float, float ]) A tuple of the viPlus and viMinus values.
vzo(length)
Calculates the value of the Volume Zone Oscillator.
Parameters:
length (simple int) : (simple int) Length for the smoothing parameter calculation.
Returns: (float) The oscillator value.
williamsFractal(period)
Detects Williams Fractals.
Parameters:
period (int) : (series int) Number of bars (length).
Returns: ( [bool, bool ]) A tuple of an up fractal and down fractal. Variables are true when detected.
wpo(length)
Calculates the value of the Wave Period Oscillator.
Parameters:
length (simple int) : (simple int) Length for the smoothing parameter calculation.
Returns: (float) The oscillator value.
█ v7, Nov. 2, 2023
This version includes the following new and updated functions:
atr2(length)
An alternate ATR function to the `ta.atr()` built-in, which allows a "series float" `length` argument.
Parameters:
length (float) : (series int/float) Length for the smoothing parameter calculation.
Returns: (float) The ATR value.
changePercent(newValue, oldValue)
Calculates the percentage difference between two distinct values.
Parameters:
newValue (float) : (series int/float) The current value.
oldValue (float) : (series int/float) The previous value.
Returns: (float) The percentage change from the `oldValue` to the `newValue`.
donchian(length)
Calculates the values of a Donchian Channel using `high` and `low` over a given `length`.
Parameters:
length (int) : (series int) Number of bars (length).
Returns: ( [float, float, float ]) A tuple containing the channel high, low, and median, respectively.
highestSince(cond, source)
Tracks the highest value of a series since the last occurrence of a condition.
Parameters:
cond (bool) : (series bool) A condition which, when `true`, resets the tracking of the highest `source`.
source (float) : (series int/float) Series of values to process. Optional. The default is `high`.
Returns: (float) The highest `source` value since the last time the `cond` was `true`.
lowestSince(cond, source)
Tracks the lowest value of a series since the last occurrence of a condition.
Parameters:
cond (bool) : (series bool) A condition which, when `true`, resets the tracking of the lowest `source`.
source (float) : (series int/float) Series of values to process. Optional. The default is `low`.
Returns: (float) The lowest `source` value since the last time the `cond` was `true`.
relativeVolume(length, anchorTimeframe, isCumulative, adjustRealtime)
Calculates the volume since the last change in the time value from the `anchorTimeframe`, the historical average volume using bars from past periods that have the same relative time offset as the current bar from the start of its period, and the ratio of these volumes. The volume values are cumulative by default, but can be adjusted to non-accumulated with the `isCumulative` parameter.
Parameters:
length (simple int) : (simple int) The number of periods to use for the historical average calculation.
anchorTimeframe (simple string) : (simple string) The anchor timeframe used in the calculation. Optional. Default is "D".
isCumulative (simple bool) : (simple bool) If `true`, the volume values will be accumulated since the start of the last `anchorTimeframe`. If `false`, values will be used without accumulation. Optional. The default is `true`.
adjustRealtime (simple bool) : (simple bool) If `true`, estimates the cumulative value on unclosed bars based on the data since the last `anchor` condition. Optional. The default is `false`.
Returns: ( [float, float, float ]) A tuple of three float values. The first element is the current volume. The second is the average of volumes at equivalent time offsets from past anchors over the specified number of periods. The third is the ratio of the current volume to the historical average volume.
rma2(source, length)
An alternate RMA function to the `ta.rma()` built-in, which allows a "series float" `length` argument.
Parameters:
source (float) : (series int/float) Series of values to process.
length (float) : (series int/float) Length for the smoothing parameter calculation.
Returns: (float) The rolling moving average of the `source`.
supertrend2(factor, atrLength, wicks)
An alternate SuperTrend function to `supertrend()`, which allows a "series float" `atrLength` argument.
Parameters:
factor (float) : (series int/float) Multiplier for the ATR value.
atrLength (float) : (series int/float) Length for the ATR smoothing parameter calculation.
wicks (simple bool) : (simple bool) Condition to determine whether to take candle wicks into account when reversing trend, or to use the close price. Optional. Default is `false`.
Returns: ( [float, int ]) A tuple of the superTrend value and trend direction.
vStop(source, atrLength, atrFactor)
Calculates an ATR-based stop value that trails behind the `source`. Can serve as a possible stop-loss guide and trend identifier.
Parameters:
source (float) : (series int/float) Series of values that the stop trails behind.
atrLength (simple int) : (simple int) Length for the ATR smoothing parameter calculation.
atrFactor (float) : (series int/float) The multiplier of the ATR value. Affects the maximum distance between the stop and the `source` value. A value of 1 means the maximum distance is 100% of the ATR value. Optional. The default is 1.
Returns: ( [float, bool ]) A tuple of the volatility stop value and the trend direction as a "bool".
vStop2(source, atrLength, atrFactor)
An alternate Volatility Stop function to `vStop()`, which allows a "series float" `atrLength` argument.
Parameters:
source (float) : (series int/float) Series of values that the stop trails behind.
atrLength (float) : (series int/float) Length for the ATR smoothing parameter calculation.
atrFactor (float) : (series int/float) The multiplier of the ATR value. Affects the maximum distance between the stop and the `source` value. A value of 1 means the maximum distance is 100% of the ATR value. Optional. The default is 1.
Returns: ( [float, bool ]) A tuple of the volatility stop value and the trend direction as a "bool".
Removed Functions:
allTimeHigh(src)
Tracks the highest value of `src` from the first historical bar to the current bar.
allTimeLow(src)
Tracks the lowest value of `src` from the first historical bar to the current bar.
trima2(src, length)
An alternate Triangular Moving Average (TRIMA) function to `trima()`, which allows a
"series int" length argument.

Moving Average Band - Taylor V1A Very Simple Strategy From Moving Average
- Price Breakout Upper Band = Long
- Price Breakout Lower Band = Short
Moving Average Type = Able to Change RMA, EMA, SMA, WMA
Moving Average Period = Able to Change
Upper Band & Lower Band Gap = Able to Change
With Stop Lose & Take Profit = Able to Change

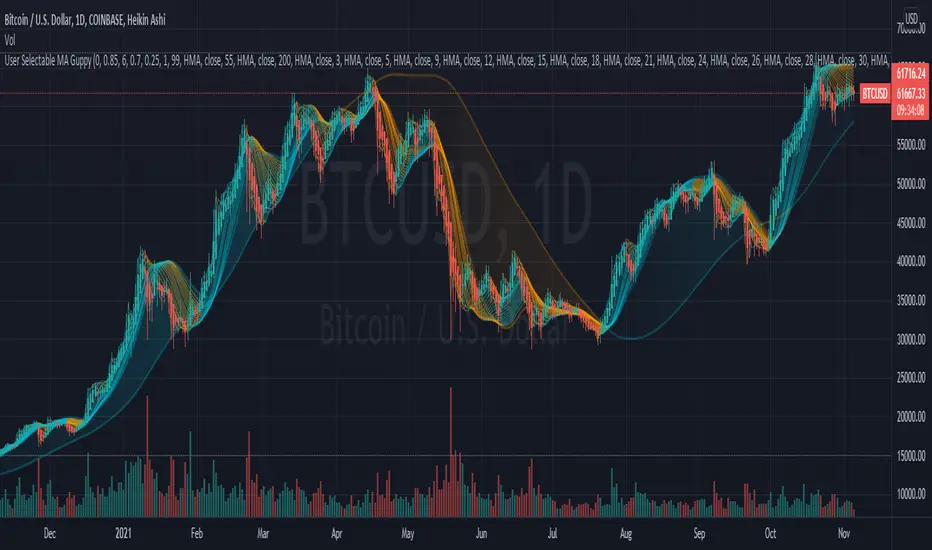
User Selectable Moving Average GuppyA version of the popular "Moving Average Ribbon" or "Guppy" indicators, except nearly everything about it is user selectable. The user can change the source, period, and type of moving average used for every single line on the chart. Note: The visuals are fairly intensive and may take a moment to catch up after adjusting settings.
Credit: This script utilizes the "Color Gradient Framework" tutorial by LucF (PineCoders) to create gradient visuals, which are also customizable for the user.
Moving Average Options:
Running (SMoothed) Moving Average (RMA or SMMA) - Slowest
Simple Moving Average (SMA) - Slow
Exponential Moving Average (EMA) - Responds faster to price than SMA
Weighted Moving Average (WMA)
Volume-Weighted Moving Average (VWMA)
Triple EMA (TEMA)
Exponential Hull Moving Average (EHMA) - Hull with Smoothing (Slower than Hull)
Least Squares Moving Average (LSMA) - Simple Linear Regression
Arnaud Legoux Moving Average (ALMA) - Adjustable, set offset=1 to be current, offset=0.85 for good smoothing (Slower)
Hull Moving Average (HMA) - Normally responds fastest to price of all options
Value Added :
This script is unique in that it allows the user to chart the "Guppy", except nearly everything about it is customizable. The user can change the source, period, and type of moving average used for every single line.
Typically, the Guppy is plotted with simple moving average or exponential moving average, which respond much slower to price than the Hull Moving Average, which this indicator uses as default. (Elimination of lag)
The Hull MA settings for the highest time frame moving averages should work well for assessing the overall macro trend, with a nice visual presentation. Additional labels and alerts for the macro trend are available.
Furthermore, this script provides many more options for type of moving average than is typical for a moving average indicator that provides the user with options, including advanced options such as Hull, TEMA, and ALMA.
The visual presentation is customizable and should provide some entertainment for users who want to create pretty charts.
Bollinger Bands With User Selectable MABollinger Bands with user selection options to calculate the moving average basis and bands from a variety of different moving averages.
The user selects their choice of moving average, and the bands automatically adjust. The user may select a MA that reacts faster to volatility or slower/smoother.
Added additional options to color the bands or basis based on the current trend and alternate candle colors for band touches. Options:
REACT SLOW/SMOOTH TO VOLATILITY
simple moving average (Regular Bollinger Bands)
REACT SMOOTH TO VOLATILITY
exponential moving average (EMA Bollinger Bands)
weighted moving average (Weighted MA Bollinger Bands)
exponential hull moving average (Hull Bollinger Bands with better smoothing)
HIGHLY ADJUSTABLE TO VOLATILITY
Arnaud Legoux Moving average (ALMA Bollinger Bands)
Note: 0.85 ALMA default for more smoothing, set offset=1 to turn off smoothing
REACT HARSH TO VOLATILITY
least squares moving average (Least Squares Bollinger Bands)
REACT VERY FAST TO VOLATILITY
hull moving average (Hull Bollinger Bands or Hullinger Bands)
VALUE ADDED: This script is unique in that no other Bollinger Bands indicator offers a user selection for moving average, and some of the options do not exist yet as Bollinger Bands indicators.
Definitions:
Bollinger Bands: A Bollinger Band® is a technical analysis tool defined by a set of trendlines plotted two standard deviations (positively and negatively) away from a simple moving average (SMA) of a security's price, but which can be adjusted to user preferences.
Exponential Bollinger Bands: The most important characteristics of the Exponential Bollinger Bands indicator are: When the market is flat, the bands will stay much closer to prices. When the volatility is high, the bands move away from prices faster.
Hull Bollinger Bands: Bollinger Bands calculated by Hull moving average, rather than simple moving average or ema. The Hull Moving Average (HMA), developed by Alan Hull, is an extremely fast and smooth moving average. In fact, the HMA almost eliminates lag altogether and manages to improve smoothing at the same time.
Exponential Hull Bollinger Bands: Bollinger Bands calculated by Exponential Hull moving average, rather than simple moving average or ema. The Exponential Hull Moving Average is similar to the standard Hull MA, but with superior smoothing. The standard Hull Moving Average is derived from the weighted moving average (WMA). As other moving average built from weighted moving averages it has a tendency to exaggerate price movement.
Weighted Moving Average Bollinger Bands: A Weighted Moving Average (WMA) is similar to the simple moving average (SMA), except the WMA adds significance to more recent data points.
Arnaud Legoux Moving Average Bollinger Bands: ALMA removes small price fluctuations and enhances the trend by applying a moving average twice, once from left to right, and once from right to left. At the end of this process the phase shift (price lag) commonly associated with moving averages is significantly reduced. Zero-phase digital filtering reduces noise in the signal. Conventional filtering reduces noise in the signal, but adds a delay.
Least Squares Bollinger Bands: The indicator is based on sum of least squares method to find a straight line that best fits data for the selected period. The end point of the line is plotted and the process is repeated on each succeeding period.

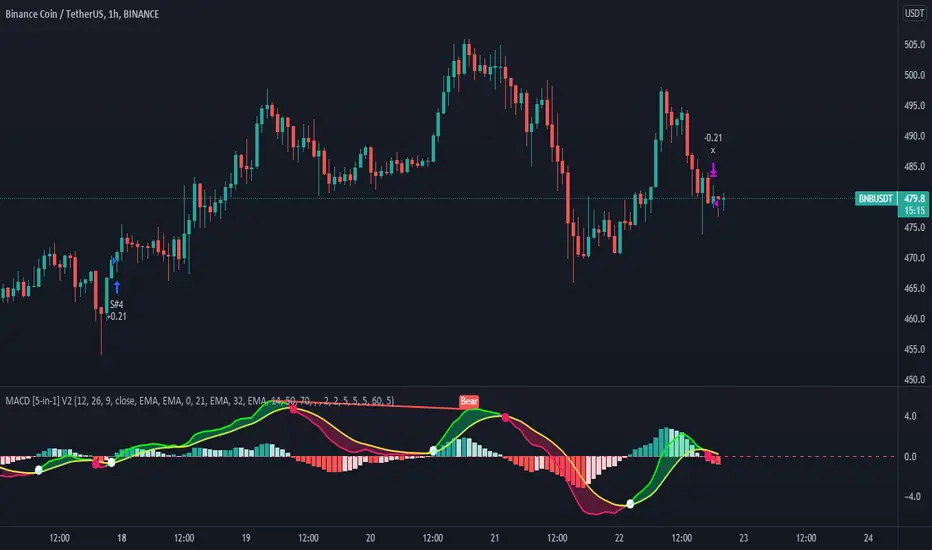
MACD 5 iN 1 [Pro-Tool]introducing MACD Which has different indicators inside,
And not only that, five different strategies have also been included in this indicator.
Strategy №1:👉 MACD Crossover Signal Line
Strategy №2:👉 MACD Crossover + MACD Overbought Section (for ignore false Crossover signals)
Strategy №3:👉 MACD Crossover + Market Close should b greater tha MOVING AVERAGE
Strategy №4:👉 MACD Crossover + Market Close should b greater tha MOVING AVERAGE ZONE
Strategy №5:👉 MACD Crossover + RSI Close should b greater tha 50 Level (or whatever level you choose)
also 5 types of MOVING AVERAGE you can choose
1: Simple Moving Average ( SMA )
2: Exponential Moving Average ( EMA )
3: Weighted Moving Average ( WMA )
4: Volume Weighted Moving Average ( VWMA )
5: Relative Moving Average (RMA)
and you can customize MACD Colors + Widths + Signals and MACD lines, and also can Hide or Unhide Histogram / Cross Sign / MACD Zone Color
hope so you like it, 🥰
Investing and trading in cryptocurrencies is very risky, as anything can happen at any time.
***NOT FINANCIAL, LEGAL, OR TAX ADVICE! JUST OPINION! I AM NOT AN EXPERT! I DO NOT GUARANTEE A PARTICULAR OUTCOME I HAVE NO INSIDE KNOWLEDGE! YOU NEED TO DO YOUR OWN RESEARCH AND MAKE YOUR OWN DECISIONS! THIS IS JUST EDUCATION & ENTERTAINMENT! USE ALTCOIN DAILY AS A STARTING OFF POINT!
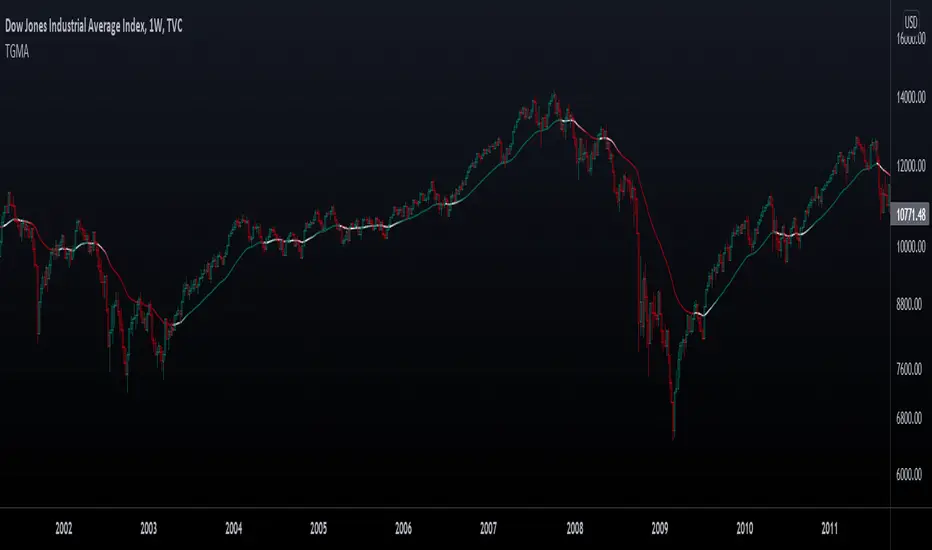
Trend Gradient Moving Average This moving average uses a gradient function which calculates the number of advances/declines of the moving average to change the intensity of the colors, meaning a longer trend in either direction will show a stronger color. You can choose 3 colors to build the gradient: a bullish, bearish & neutral/transition color. The number of steps chosen will change the speed of color change, with a lower number of steps meaning a faster transition and viceversa.
Furthermore, you can choose between many different types of moving averages:
-SMA (Simple Moving Average)
-EMA (Exponential Moving Average)
-RMA (Rolling Moving Average)
-WMA (Weighted Moving Average)
-HMA (Hull Moving Average)
-VWMA (Volume Weighted Moving Average)
-TMA (Triangular Moving Average)
Enjoy!
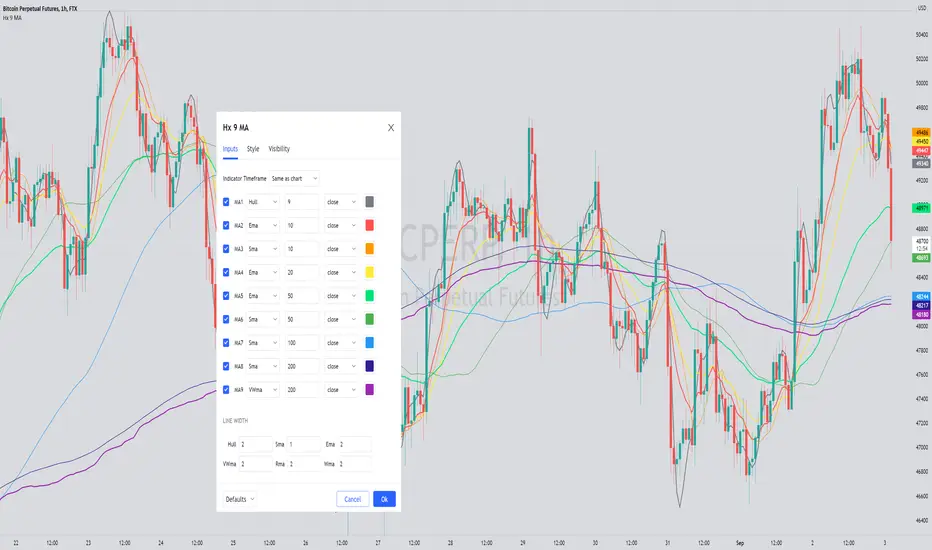
Hx 9 Moving AveragesThis script is designed to handle and provide quick and easy access to up to 9 different moving averages in one indicator and one tab.
Basically, it leverages the 'inline' and 'group' arguments of the 'input' function to provide you with a simple and straightforward way to:
- define your favorite moving averages by choosing type, length, source and color in the same tab and
- decide which moving averages to display in one click on a checkbox.
I do not like to have to select the color of an indicator in another tab. So, I put everything in the Inputs tab.
In addition, I like to "linewidth code" my moving averages so that a sma has a different thickness than an ema for example.
To do so, just define the line width that you want to associate with a moving average type in the "LINE WIDTH" section.
Once parameters are set to your liking, just check / uncheck the moving averages you want to display / hide (and save your settings as default).
This script handles 9 different moving averages and implements sma, wma, ema, vwma, rma (RSI) and hma (Hull).
It can easily be modified to change the number of available moving averages or include other types of moving averages.
The default settings provide an example of commonly used moving averages with associated colors ranked from Hot (more nervous) to Cold (less nervous) with the exception of Hull moving average displayed in gray.
These settings are just an example and are NOT meant to be used as a trading system! DYOR!
Hope it will be useful.
Enjoy and please let me know what you think in the comments.
10 in 1 Different Moving Averages ( SMA/EMA/WMA/RMA )This indicator is a combination of different types of moving averages where you can select which kind of moving average you want according to your need.
It consists of 10 moving averages none of which is fixed by default, you can change the properties of any MA according to your will.
I hope you all will like it.

KINSKI Volume Regression TrendRegression trends are typically used to determine when a price is unusually far from its baseline. The script calculates the linear regression of volume and price to determine the trend direction and strength. This can be used to determine the volume support for upward/downward trends.
As a special feature, this indicator allows you to choose from three (as of 07/20/2021) templates with special presets.
The following templates are available:
"Precise" (Period: 4, Smoothing Factor Type: "DISABLED", Smoothing Factor Length = 1).
"Smooth" (Period: 4, Smoothing Factor Type: "RMA", Smoothing Factor Length = 2)
"Long Term (Period: 20, Smoothing Factor Type: "DISABLED", Smoothing Factor Length = 1)
In the selection for templates, the option "DISABLED" can also be selected. Then the user-defined settings selectable under it take effect. There are the following setting options.
"Length": Adjustable period
"Smoothing Factor: Type": Type of moving average
"Smoothing Factor: Length": Adjustable period
Other setting options are:
Color codes: The color codes are explained in the settings
Display types: "Columns", "Histogram", "Area", "Line", "Stepline"

KINSKI Flexible Volume OscillatorThe Volume Oscillator is a trend-oriented indicator that shows the strength or weakness of price trends. This indicator calculates the volume from two moving averages (MA). The value of the slow volume MA is then subtracted from the value of the fast moving average. The Volume Oscillator measures volume by analyzing the relationship between these two moving averages.
The special feature of this indicator is that the type of moving average can be selected as the basis for calculation. Currently, it is possible to choose between the following MA variants:
"COVWMA", "DEMA", "EMA", "EHMA", "FRAMA", "HMA", "KAMA", "RMA", "SMA", "SMMA", "VIDYA", "VWMA", "WMA".
Upward and downward movements are represented in different colors. The following color variants are available:
Color green: Strong upward trend
Color green/dark: weakening upward trend
Color red: strong downward trend
Color red/dark: weakening downward trend
The colors, as well as the style can be adjusted in the settings according to your own needs.

ATR SLHi traders,
As you know, ATR trailing stop is very popular indicator. So I decided to make my own one.
The logic is simple.
If the price is above the RMA(src,len), then put a SL at OPEN - ATR value of that time period
otherwise, put a SL at OPEN + ATR value of that time period.
Stay safe ^^
