3 EMA + RSI with Trail Stop [Free990] (LOW TF)This trading strategy combines three Exponential Moving Averages (EMAs) to identify trend direction, uses RSI to signal exit conditions, and applies both a fixed percentage stop-loss and a trailing stop for risk management. It aims to capture momentum when the faster EMAs cross the slower EMA, then uses RSI thresholds, time-based exits, and stops to close trades.
Short Explanation of the Logic
Trend Detection: When the 10 EMA crosses above the 20 EMA and both are above the 100 EMA (and the current price bar closes higher), it triggers a long entry signal. The reverse happens for a short (the 10 EMA crosses below the 20 EMA and both are below the 100 EMA).
RSI Exit: RSI crossing above a set threshold closes long trades; crossing below another threshold closes short trades.
Time-Based Exit: If a trade is in profit after a set number of bars, the strategy closes it.
Stop-Loss & Trailing Stop: A fixed stop-loss based on a percentage from the entry price guards against large drawdowns. A trailing stop dynamically tightens as the trade moves in favor, locking in potential gains.
Detailed Explanation of the Strategy Logic
Exponential Moving Average (EMA) Setup
Short EMA (out_a, length=10)
Medium EMA (out_b, length=20)
Long EMA (out_c, length=100)
The code calculates three separate EMAs to gauge short-term, medium-term, and longer-term trend behavior. By comparing their relative positions, the strategy infers whether the market is bullish (EMAs stacked positively) or bearish (EMAs stacked negatively).
Entry Conditions
Long Entry (entryLong): Occurs when:
The short EMA (10) crosses above the medium EMA (20).
Both EMAs (short and medium) are above the long EMA (100).
The current bar closes higher than it opened (close > open).
This suggests that momentum is shifting to the upside (short-term EMAs crossing up and price action turning bullish). If there’s an existing short position, it’s closed first before opening a new long.
Short Entry (entryShort): Occurs when:
The short EMA (10) crosses below the medium EMA (20).
Both EMAs (short and medium) are below the long EMA (100).
The current bar closes lower than it opened (close < open).
This indicates a potential shift to the downside. If there’s an existing long position, that gets closed first before opening a new short.
Exit Signals
RSI-Based Exits:
For long trades: When RSI exceeds a specified threshold (e.g., 70 by default), it triggers a long exit. RSI > short_rsi generally means overbought conditions, so the strategy exits to lock in profits or avoid a pullback.
For short trades: When RSI dips below a specified threshold (e.g., 30 by default), it triggers a short exit. RSI < long_rsi indicates oversold conditions, so the strategy closes the short to avoid a bounce.
Time-Based Exit:
If the trade has been open for xBars bars (configurable, e.g., 24 bars) and the trade is in profit (current price above entry for a long, or current price below entry for a short), the strategy closes the position. This helps lock in gains if the move takes too long or momentum stalls.
Stop-Loss Management
Fixed Stop-Loss (% Based): Each trade has a fixed stop-loss calculated as a percentage from the average entry price.
For long positions, the stop-loss is set below the entry price by a user-defined percentage (fixStopLossPerc).
For short positions, the stop-loss is set above the entry price by the same percentage.
This mechanism prevents catastrophic losses if the market moves strongly against the position.
Trailing Stop:
The strategy also sets a trail stop using trail_points (the distance in price points) and trail_offset (how quickly the stop “catches up” to price).
As the market moves in favor of the trade, the trailing stop gradually tightens, allowing profits to run while still capping potential drawdowns if the price reverses.
Order Execution Flow
When the conditions for a new position (long or short) are triggered, the strategy first checks if there’s an opposite position open. If there is, it closes that position before opening the new one (prevents going “both long and short” simultaneously).
RSI-based and time-based exits are checked on each bar. If triggered, the position is closed.
If the position remains open, the fixed stop-loss and trailing stop remain in effect until the position is exited.
Why This Combination Works
Multiple EMA Cross: Combining 10, 20, and 100 EMAs balances short-term momentum detection with a longer-term trend filter. This reduces false signals that can occur if you only look at a single crossover without considering the broader trend.
RSI Exits: RSI provides a momentum oscillator view—helpful for detecting overbought/oversold conditions, acting as an extra confirmation to exit.
Time-Based Exit: Prevents “lingering trades.” If the position is in profit but failing to advance further, it takes profit rather than risking a trend reversal.
Fixed & Trailing Stop-Loss: The fixed stop-loss is your safety net to cap worst-case losses. The trailing stop allows the strategy to lock in gains by following the trade as it moves favorably, thus maximizing profit potential while keeping risk in check.
Overall, this approach tries to capture momentum from EMA crossovers, protect profits with trailing stops, and limit risk through both a fixed percentage stop-loss and exit signals from RSI/time-based logic.
Cerca negli script per "rsi"

RSI Risk | AlgoFy TraderRSI Risk | AlgoFy Trader
Overview
The RSI Risk | AlgoFy Trader is a trading system that combines RSI-based entry signals with automated capital management. This strategy identifies potential momentum shifts while controlling risk through calculated position sizing.
Key Features
Dynamic Risk Management:
Fixed Risk Per Trade: Users set maximum risk percentage per trade.
Automatic Position Sizing: Calculates position size based on stop-loss distance.
Capital Protection: Limits each trade's risk to user-defined percentage.
RSI Entry System:
Momentum Detection: Uses RSI crossovers above/below defined thresholds.
Clear Signals: Provides long/short entries on momentum transitions.
Multiple Exit Layers:
Dynamic Stop Loss: Stop based on recent price structure.
Fixed Safety Stop: Optional percentage-based stop loss.
Partial Take Profit: Optional early profit-taking.
Trailing Stop: Optional dynamic profit protection.
Performance Tracking:
Trade Statistics: Tracks win/loss streaks and performance metrics.
Monthly Dashboard: Shows monthly/yearly P&L with equity views.
Trade Details: Displays risk percentage and position size.
How It Works
Signal Detection: Monitors RSI for crossover events.
Risk Calculation: Determines stop-loss based on recent volatility.
Position Sizing: Calculates exact position to match risk percentage.
Example:
Account: $10,000 | Risk: 2% ($200 max)
Stop loss at 4% distance
Position size: $5,000
Result: 4% loss on $5,000 = $200 (2% of account)
Recommended Settings
Risk: 1-2% per trade
Enable fixed stop at 3-4%
Consider trailing stop activation
This script provides disciplined RSI trading with automated risk control, adjusting exposure while maintaining strict risk limits.

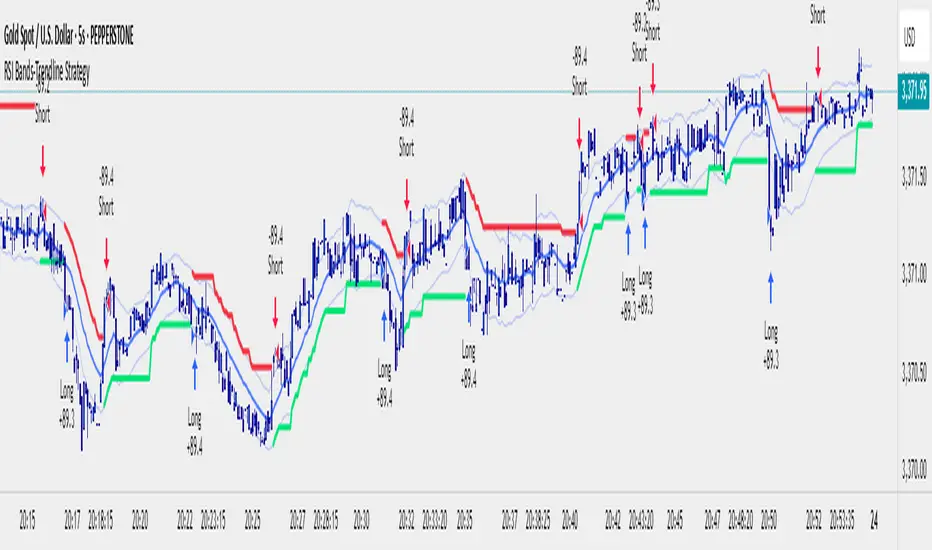
RSI Bands With RSI - ATR Trend StrategyRSI Bands With RSI-ATR Trend Line Strategy
Overview
A trend-following strategy that combines RSI regime detection with a smoothed baseline and ATR bands. Works similar to Supertrend: the line flips bullish or bearish only when price closes beyond the band, aiming to filter noise and catch clean moves.
How It Works
RSI above 50 = bullish bias, below 50 = bearish bias
A dynamic baseline is calculated from RSI and price range, then smoothed
ATR bands expand/contract with volatility
Close above the upper band → bullish flip → long entry
Close below the lower band → bearish flip → short entry
Between bands → prior trend continues
Features
Automatic Buy/Sell entries on confirmed flips
Configurable RSI, Smoothing, ATR, and Multiplier inputs
Visual trend line (green = bull, red = bear)
Backtest ready with initial capital and commission settings
Best Use Cases
Trending markets across Forex, Crypto, Indices, Commodities
Works on multiple timeframes (higher TFs = cleaner flips)
Flexible settings for conservative swing trading or aggressive scalping
⚠️ For testing/education only. Always manage risk and confirm with higher-timeframe or structure filters.
RSI + MACD Long-Only StrategyRSI + MACD Long-Only Strategy
Overview: Momentum-based, long-only strategy combining RSI and MACD. Entries favor upside momentum; exits trigger on momentum fades or risk targets. Signals are state-gated so you get one exit per entry (no multiple exits without a prior entry).
Entry conditions:
RSI crosses above the midline (default 50) while MACD is bullish (MACD > Signal, optionally MACD > 0), OR
MACD crosses above its Signal while RSI is at/above the midline.
Optional filters:
EMA trend filter: only enter if price > EMA(n).
Oversold context: only enter within N bars after RSI dipped below the oversold threshold.
Exit conditions:
RSI crosses below the midline, OR
MACD crosses below its Signal with MACD histogram ≤ 0.
Optional risk exit: Take Profit / Stop Loss based on percentage from average entry price.
Risk management:
Inputs: Use TP/SL (on/off), TP% (default 3.0), SL% (default 1.5).
Implements protective strategy.exit (limit/stop) while in position.
Signal-based exit uses strategy.close to flatten.
Position management:
Long-only, no pyramiding (single position at a time).
Internal state ensures entries occur only when flat and exits only when in a position.
Inputs you can tune:
RSI: length, overbought, oversold, midline.
MACD: fast length, slow length, signal length; toggle “Require MACD > 0”.
Signals: oversold lookback window; EMA trend on/off and EMA length.
Risk: TP% and SL%.
Visuals: show entry/exit markers, bar coloring; optional debug background on raw triggers.
Visuals and alerts:
Plots EMA (optional), draws entry/exit markers, optional bar coloring, and a faint background on raw long triggers to aid tuning.
Alert conditions provided for entries and exits.
Notes:
Designed for bar-close evaluation; performance varies by symbol/timeframe—tune inputs accordingly.
Long-only; intended for trend-following momentum with basic risk control.
Not financial advice.

Negroni MA & RSI Strategy, plus trade entry and SL/TP optionsI will start with the context, and some things to think about when using a strategy tool to back-test ideas.
CONTEXT
FIRST: This is derived from other people's work, but I honestly hadn't found a mixed indicator MA strategy tool that does what this now does. If it is out there, apologies!!
This tool can help back-test various MA trends (SMA, EMA, HMA, VWMA); as well as factoring in RSI levels (or not); and can factor in a fixed HTF MA (or not). You can apply a 'retest entry' or a 'breakout entry', and you can also apply various risk mgt for SL/TP orders: 1) No SL/TP; or 2) a fixed %, or 3) dynamic ATR multipliers.
Find below, some details explaining what this tool is attempting to do.
Thank you, tack, salute!
THINGS TO REVIEW (it is not just about 'profitability'!!)
Whilst discretion is always highly encouraged as a trader, and a 100% indicator-driven strategy is VERY unlikely to yield sustainable results going forward, at the very least back-testing your strategies can help provide some guidance, not just on win rate Vs profit factor, but other things including:
a) Trade frequency: if a strategy has an 75% win rate and profit factor of 4, with all your parameters and confluence checks, but only triggers 3 trades every 5 years, is that realistically implementable to your trading situation if you have a $10,000 account?
b) Trade entry type: is it consistently better to wait for a retest of an 'MA zone', or is it better to market buy/sell on breakout of the 'MA zone'?
c) Risk management (SL/TP): is it consistently better to have a fixed static % for SL/TP ("I always place my stops 2% away, whether it is EURUSD or BTCUSDT"), or would you be better placed to try using an ATR multiplier of the respective assets?
d) Moving average type: is your old faithful 100 EMA really serving you well, or is the classic SMA more reliable, or how about the HMA, or the VWMA? Is the 100/200 cross holding up, or do you need something more sensitive? Is there any significant difference between a 10 EMA/20 EMA trend zone compared to a 13 EMA /25 EMA zone?
e) Confluence: Do added confluence checks (RSI, higher timeframe MA) actually improve profitability? But even if they do, is at the cost of cutting too many trades?
INPUTS AND PARAMETERS
Choice 1) Entry Strategy: Retest or Breakout - You can select both!
[ ]:
a) RETEST entry strat: price crosses UNDER FastMA INTO the 'MA trend zone'.
b) BREAKOUT entry strat: price crosses OVER FastMA OUT the 'MA trend zone'.
Choice 2) Risk Management (SL and TP) - You can select more than 1 strategy!
a) No SL/TP: Long trades are closed when the LOW crosses back UNDER the fastMA again, and shorts are closed when the HIGH crosses back OVER the fastMA again.
b) Static % SL/TP: Your SL/TP will be a fixed % away from avg. position price... WARNING: You should change this for various asset classes; FX vol is not the same as crypto altcoin vol!
c) Dynamic ATR SL/TP: Your SL/TP is a multiple of your selected ATR range (default is 50, see 'info' when you select ATR range). ATR accounts for the change in vol of different asset classes somewhat, HOWEVER... you should probably still not have the same multiplier trading S&P500 as you would trading crypto altcoins!
Then select your preferred parameters: EMA, SMA, HMA, VWMA, etc. You can mix and match, and most options have a info/tooltip guide.
RSI note: If you don't care for RSI levels, then set buy signal at 1... i.e always buys! Similarly set sell signal at 99.
ATR note: standard ATR length is usually 14, however... your SL/TP will move POST entry, and can tighten or widen your initial SL/TP... for better AND usually for worse! Go find a trade (strat 3) on the chart, look at the SL/TP lines, now change the number to 5, you'll see.
Fixed HTF MA note: If you don't care for HTF MA confluence, just change the timeframe/options to match the 'Slow MA' options you've chosen.

RSI, Volume, MACD, EMA ComboRSI + Volume + MACD + EMA Trading System
This script combines four powerful indicators—Relative Strength Index (RSI), Volume, Moving Average Convergence Divergence (MACD), and Exponential Moving Average (EMA)—to create a comprehensive trading strategy for better trend confirmation and trade entries.
How It Works
RSI (Relative Strength Index)
Helps identify overbought and oversold conditions.
Used to confirm momentum strength before taking a trade.
Volume
Confirms the strength of price movements.
Avoids false signals by ensuring there is sufficient trading activity.
MACD (Moving Average Convergence Divergence)
Confirms trend direction and momentum shifts.
Provides buy/sell signals through MACD line crossovers.
EMA (Exponential Moving Average)
Acts as a dynamic support and resistance level.
Helps filter out trades that go against the overall trend.
Trading Logic
Buy Signal:
RSI is above 50 (bullish momentum).
MACD shows a bullish crossover.
The price is above the EMA (trend confirmation).
Volume is increasing (strong participation).
Sell Signal:
RSI is below 50 (bearish momentum).
MACD shows a bearish crossover.
The price is below the EMA (downtrend confirmation).
Volume is increasing (intense selling pressure).
Backtesting & Risk Management
The strategy is optimized for scalping on the 1-minute timeframe (adjustable for other timeframes).
Default settings use realistic commission and slippage to simulate actual trading conditions.
A stop-loss and take-profit system is integrated to manage risk effectively.
This script is designed to help traders filter out false signals, improve trend confirmation, and increase trade accuracy by combining multiple indicators in a structured way.

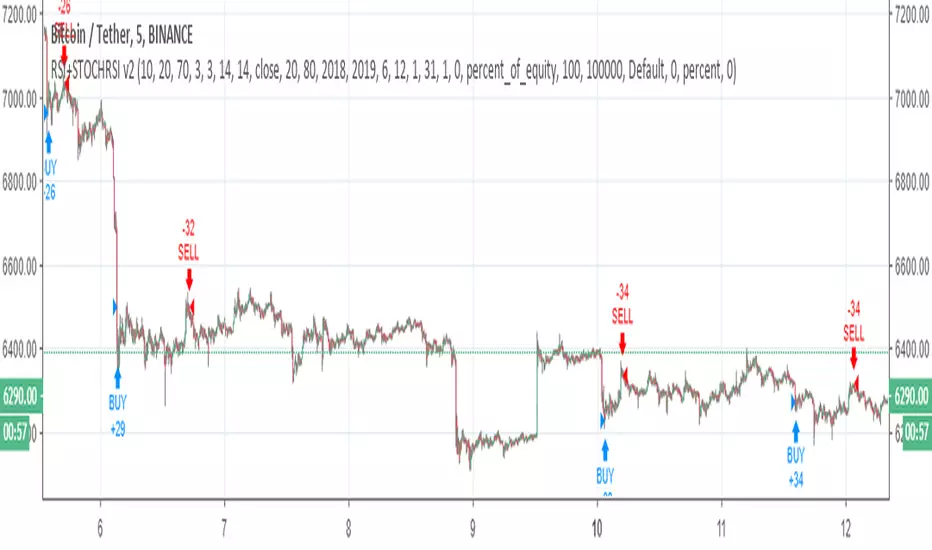
RSI+STOCHRSI v2RSI + STOCHASTIC RSI combination v2 ( for v1 )
For 5 min
Changes
Stcoh RSI creates signal with crossover
RSI created signal with an equation ( above or below the line) ,crossover was added.
Triple RSI strategyThis strategy is commonly used both in forex and stock markets for reversal trading. when the rsi line reaches and crosses simultaneously at 3 rsi setups i.e at 7, 14, and 21, a signal is generated.
This strategy works best in 1-hour timeframe. It provides over 60 to 80 percent accuracy in 1-hour timeframe.
In the stock market, this strategy provides an excellent entry point, if one is seeking small profits.
One can expect to make around 10 to 50 pips in the forex market easily. However, I advise seeking support from price action from the lower timeframe in the forex market.
I hope you like it.
Follow for more strategies and scripts like this.

Simple RSI-MA Algo Beats DOW By Huge Margin Over Past 100 Years!This simple RSI-MA long/short algorithm beats the Dow by a FREAKING HUGE margin over the past century (excluding dividends and trading costs).
The algorithm uses a fast SMA of the RSI as a buy/cover signal and a slow SMA of the RSI as a sell/short signal.
Backtest period = 09/17/1916 - 11/02/2015
Dow = 98 --> 17,830 = +18,094% = 5.38% CAGR
Algorithm = net profit + open P/L = +43,349% = 6.31% CAGR
Notice how the algorithm dodged both the 30s' Great Depression and the 2008 Crisis. Pretty cool huh? :)
ALGORITHM'S FORMULA (use weekly chart):
Buy/Cover = MA10(RSI10) cross> 50
Sell/Short = MA50(RSI10) cross< 50
STRATEGY TESTER'S SETTINGS:
- Initial cash = $10,000
- Pyramiding disabled
- Re-investment enabled (order size = 100% of equity )
- Trade re-calculations disabled
DISCLAIMER: None of my ideas and posts are investment advice. Past performance is not an indication of future results. This strategy was constructed with the benefit of hindsight and its future performance cannot be guaranteed.

RSI Fibonacci Levels StrategyRSI with Fibonacci Levels
Visually can be used as:
- Countertrend indicator at extreme green/red lines
- Follow trend indicator
- Fibonacci supports and resistantes zones
The strategy works as a follow trend
How to trade:
The indicator is more reliable in longer time frames, at least 4H
Choose a fibonacci level as reference
Buy when the RSI line turns green
Sell when the RSI line turns red

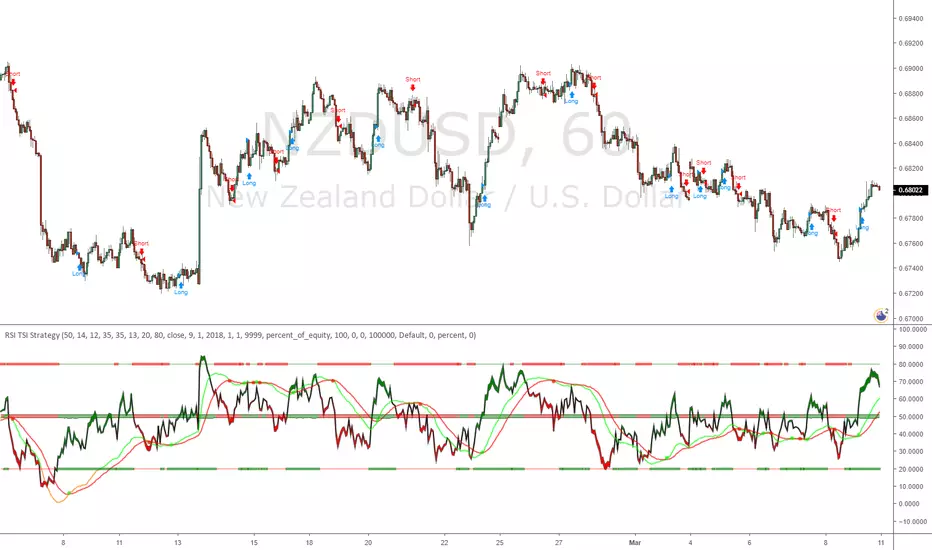
RSI TSI StrategyRSI & TSI combination, with Hull MA for a center Line.
Order entry with either RSI TSI or Hull MA
Experimental strategy for possible use as bot

RSI+STOCHRSI StrategyRSI + STOCHASTIC RSI combination . It is useful for 5 min charts .
Profitable in EOS/BTC and BTC/USDT , don't apply all cryptocurrency.

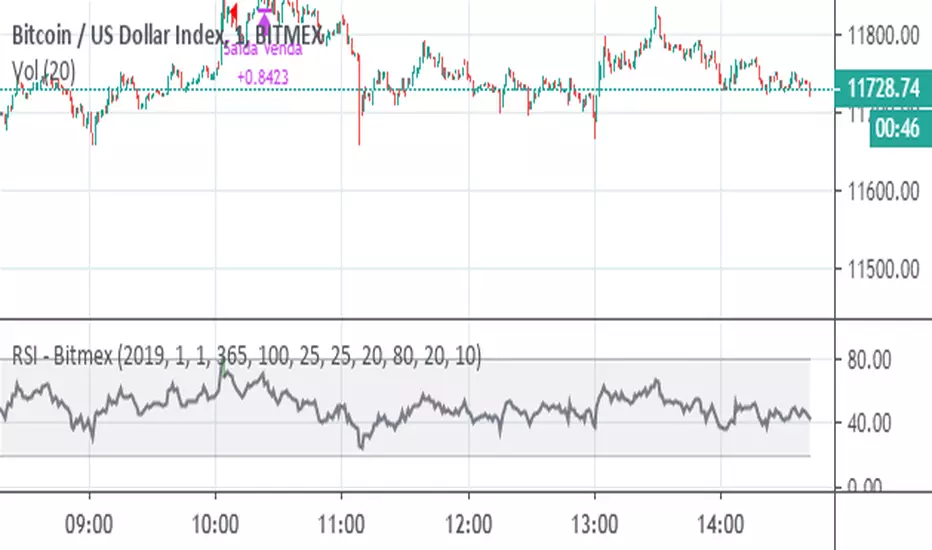
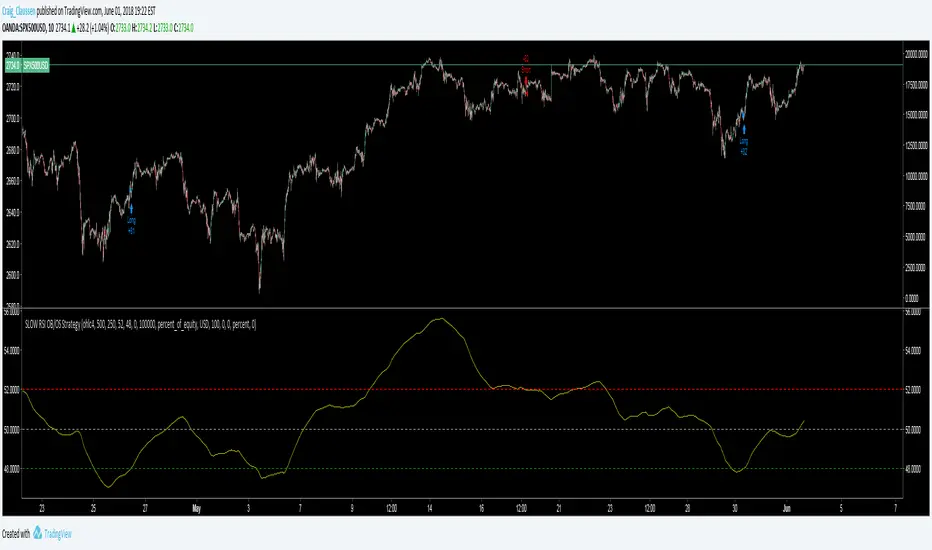
SLOW RSI OB/OS StrategySlowing the RSI down opens up a whole new world of possibilities.
This concept can work for a lot of TA indicators including the MACD.
See script source code for further description. Feel free to add pyramid trades at your own discretion in your format menu.
No this doesn't repaint!
RSI potente 2.0rsi mas refinado e indicadores correctos a corto ,mediano y largo plazo .. el mejor indicador


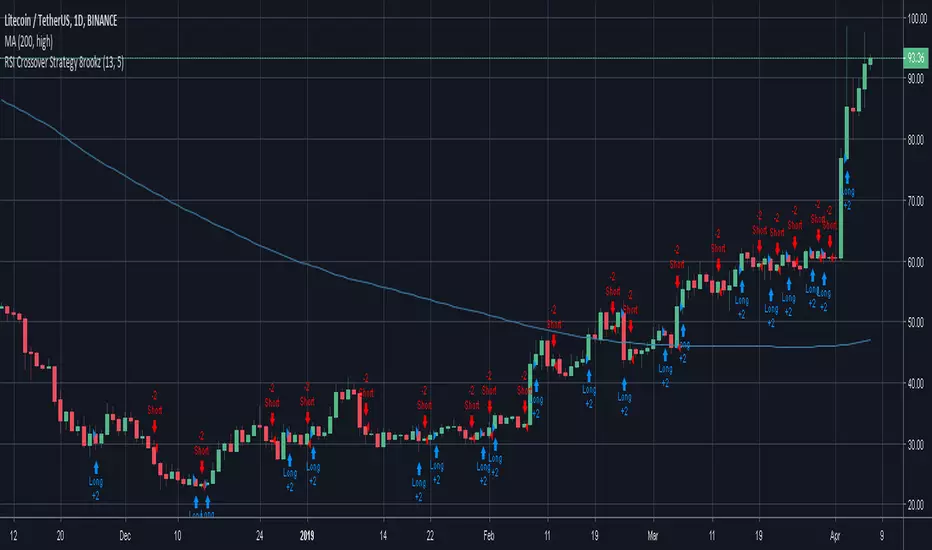
RSI Crossover Strategy 8rookzRSI Crossover Strategy
used to create entry points for increasing relative strength