Cerca negli script per "rsi"

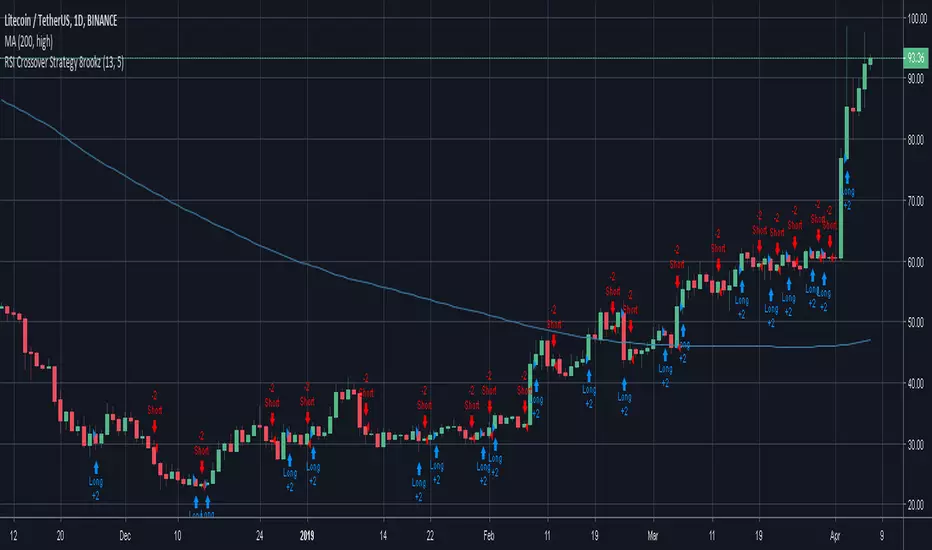
RSI Crossover Strategy 8rookzRSI Crossover Strategy
used to create entry points for increasing relative strength
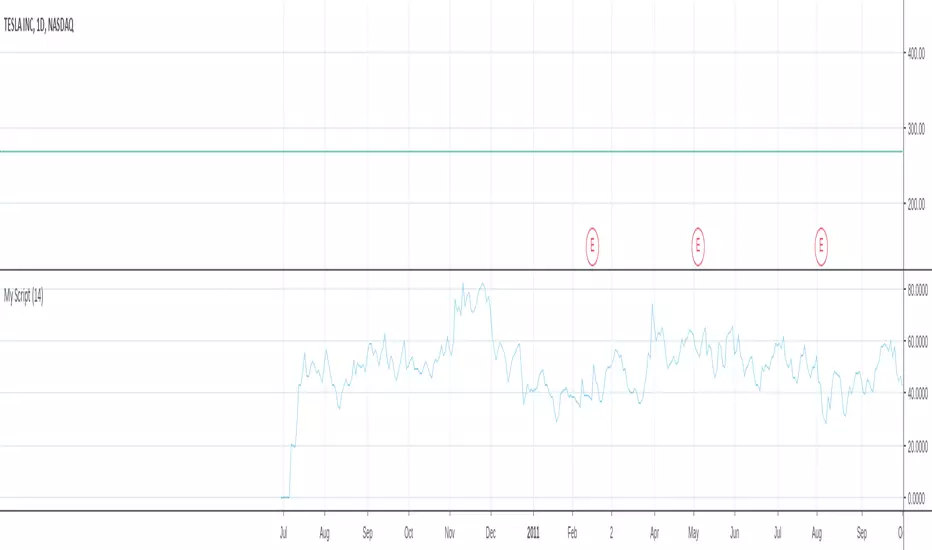


RSI TRI With Mid Point and HighlightsRSI that has the 50 line plotted plus it highlights overbought and oversold conditions.


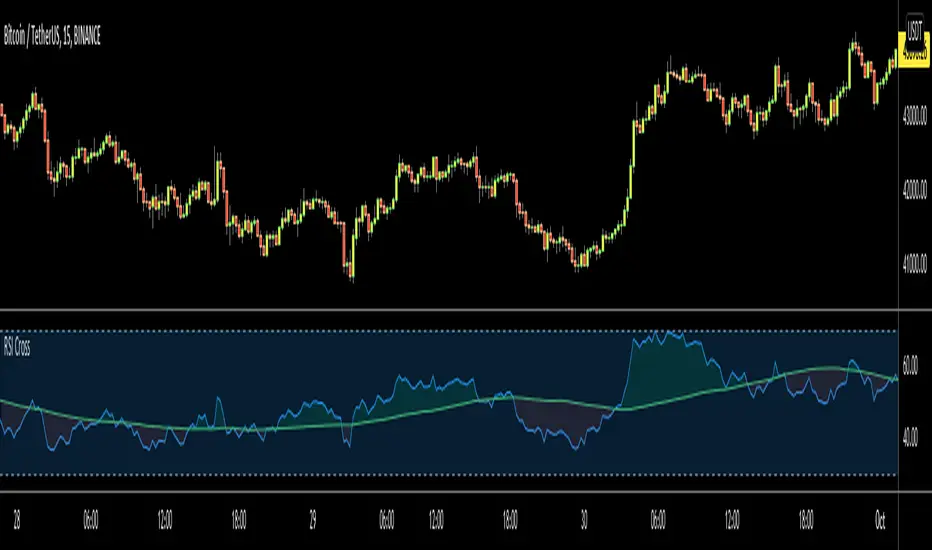
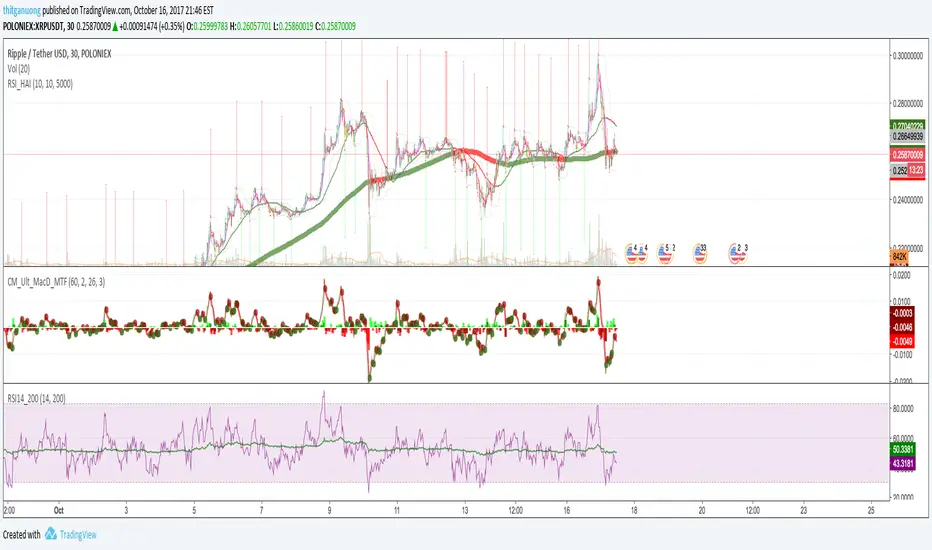
RSI+Bollinger Bands+ EMARSI on pivot points (you can chose the source) with Bollinger Bands and a EMA


RSI Currency Strength IndicatorRSI based currency strength indicator. Other indicators only give 7 currencies, leaving NZD. This one is an updated version which gives all 8 major currencies.


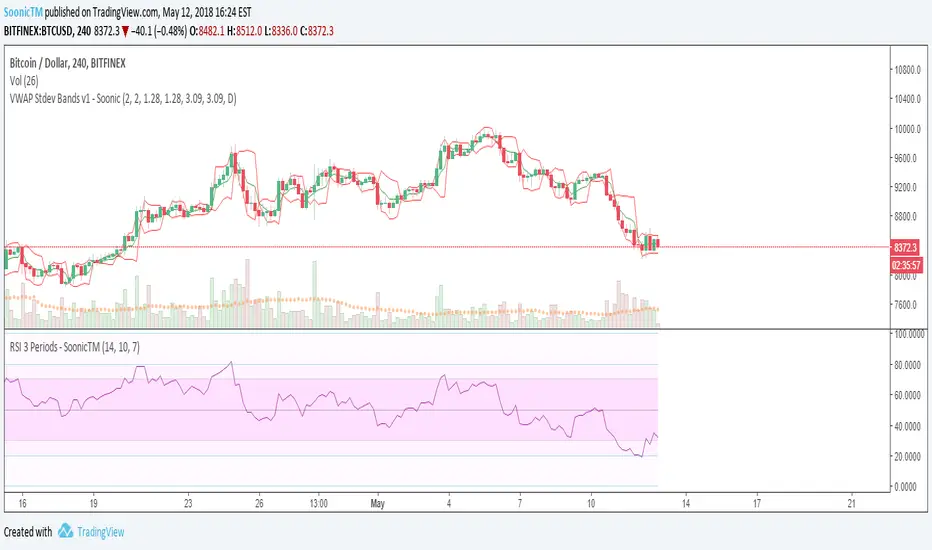
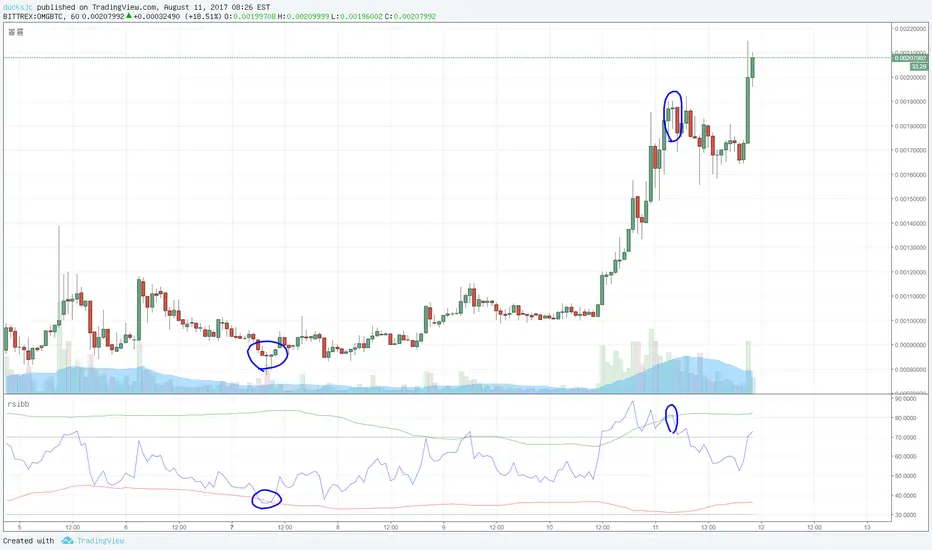
RSI with Bollinger Bands [Erionis]RSI + Bollinger Bands. Usefull to see possible reversal points. Use it accordingly.
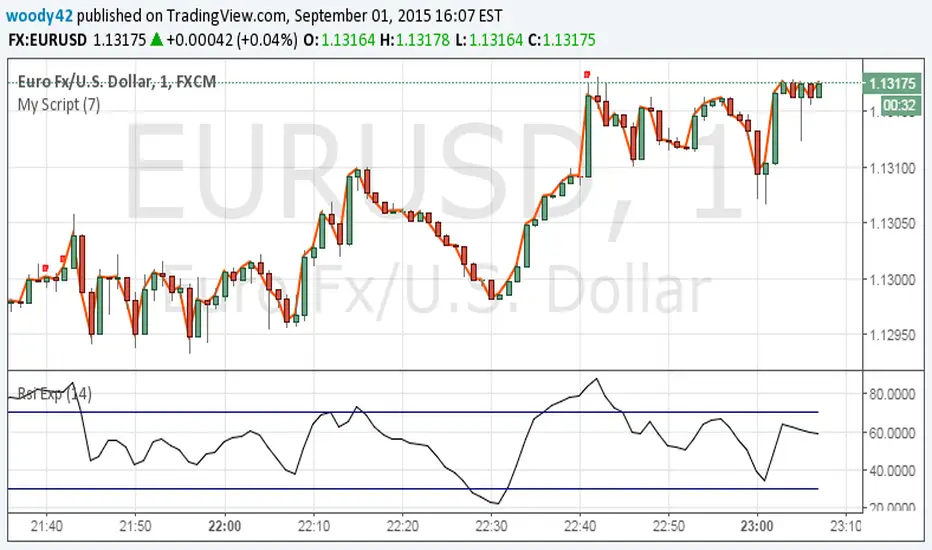
rsi with bb [or]rsi has 2 line. 30 and 70.
but we can use BB instead of that.
i dont know it is good idea or not.
cause i rarely use rsi.
anyway if you are interested in it, you can try :)
enjoy and earn money.
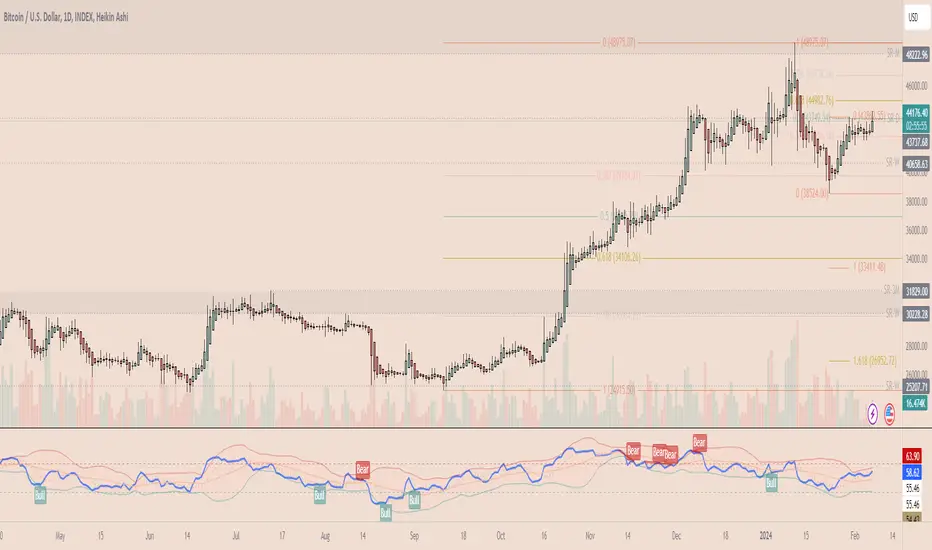
RSI in Bull and Bear Market V2.0RSI oversold at 60/40 in bullish market
And Overbought at 40/60 in Bearish market
for more info of this Strategy