Cerca negli script per "rsi"


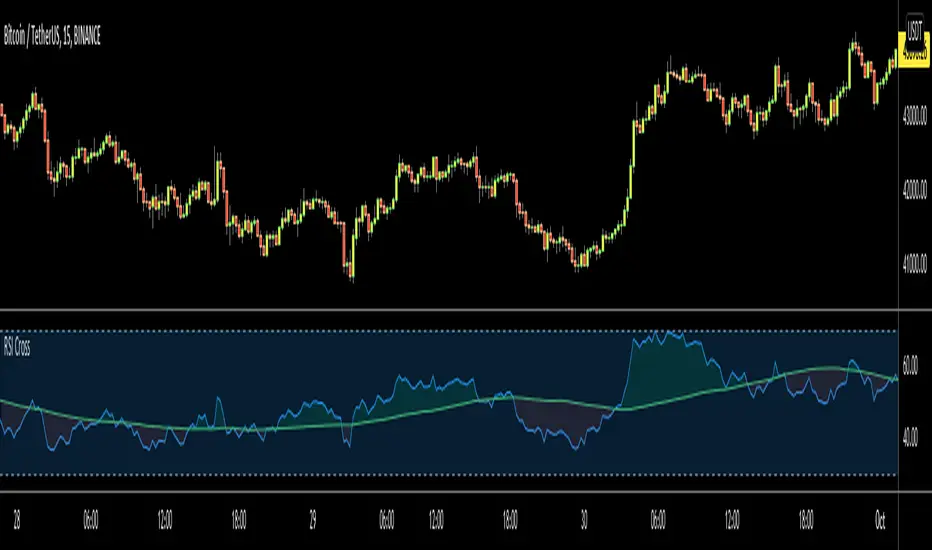


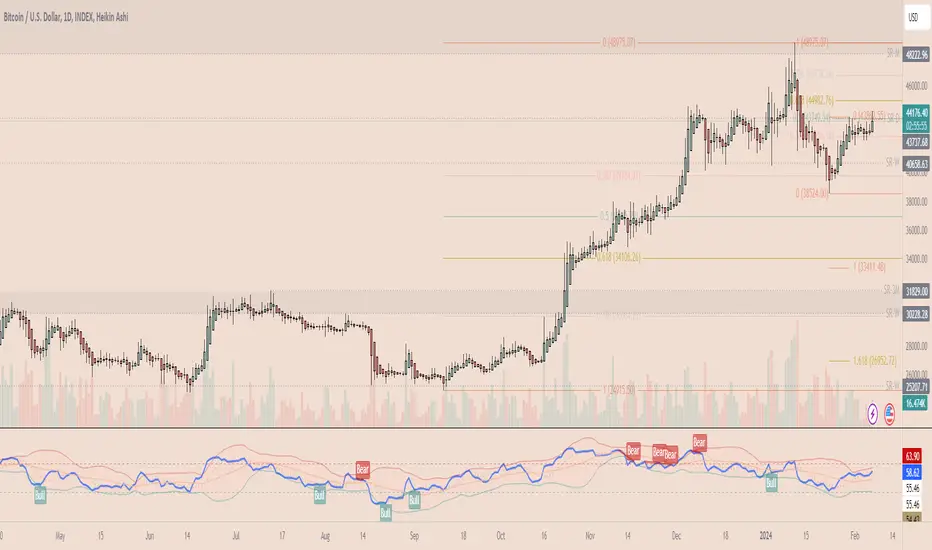
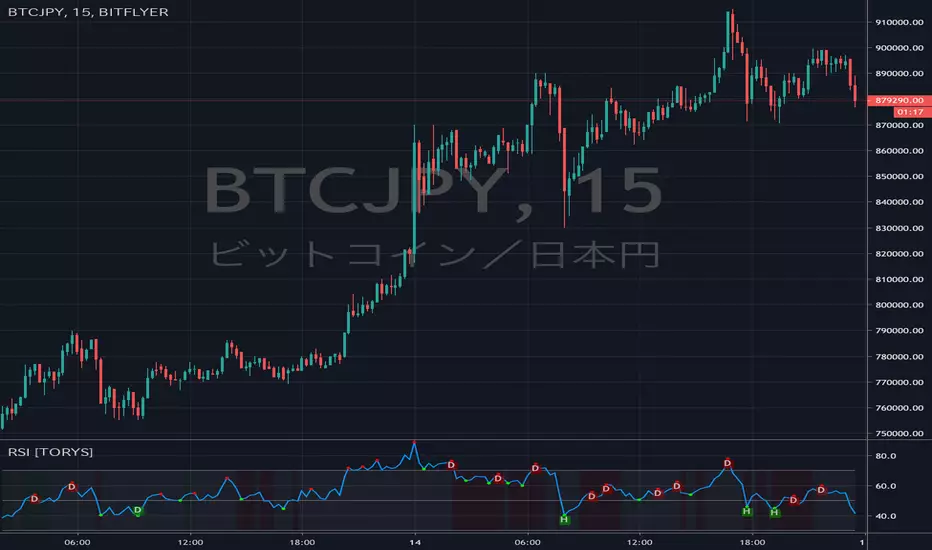
RSI Divergence [TORYS]RSI divergence indicator
green back : suggestion of rising
red back : suggestion of falling

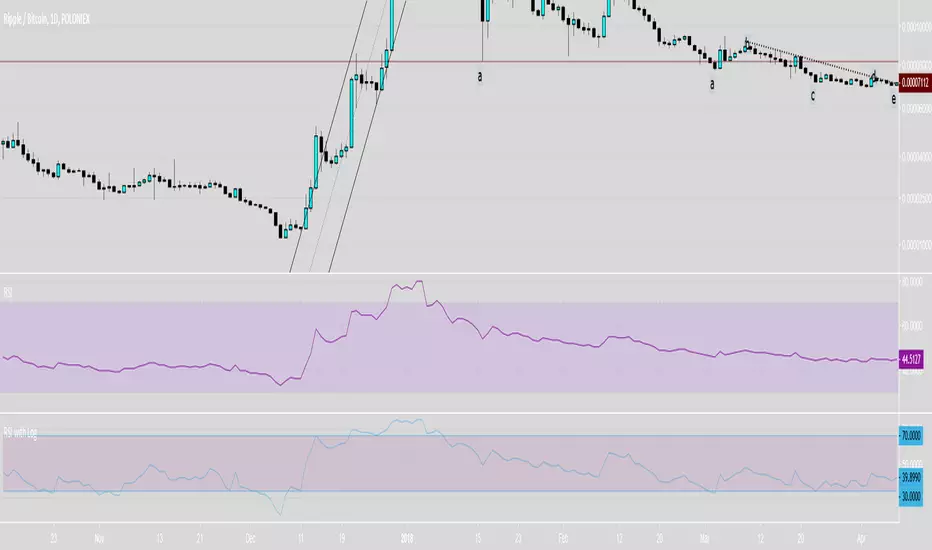
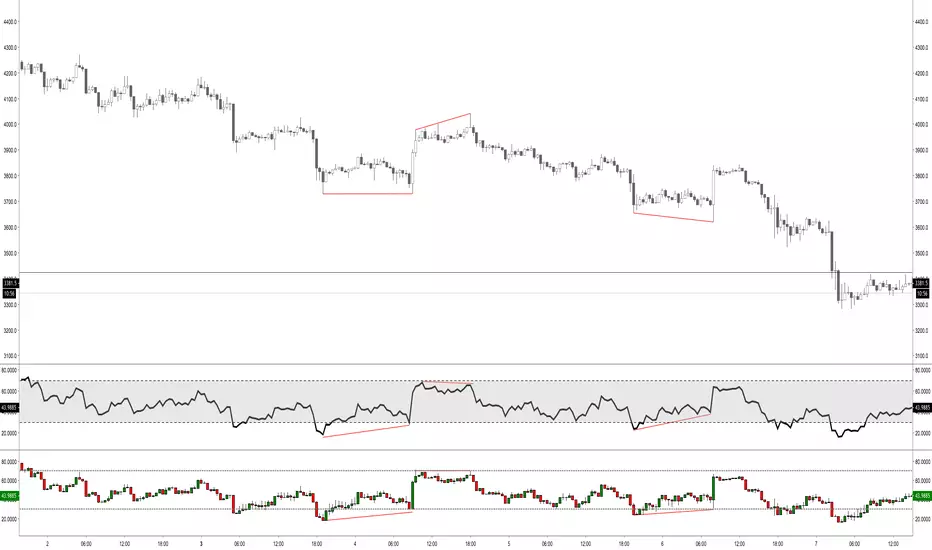
RSI DivergenceRSI Indicator with the following additions:
- highlighting the overbought/oversold conditions
- show divergences


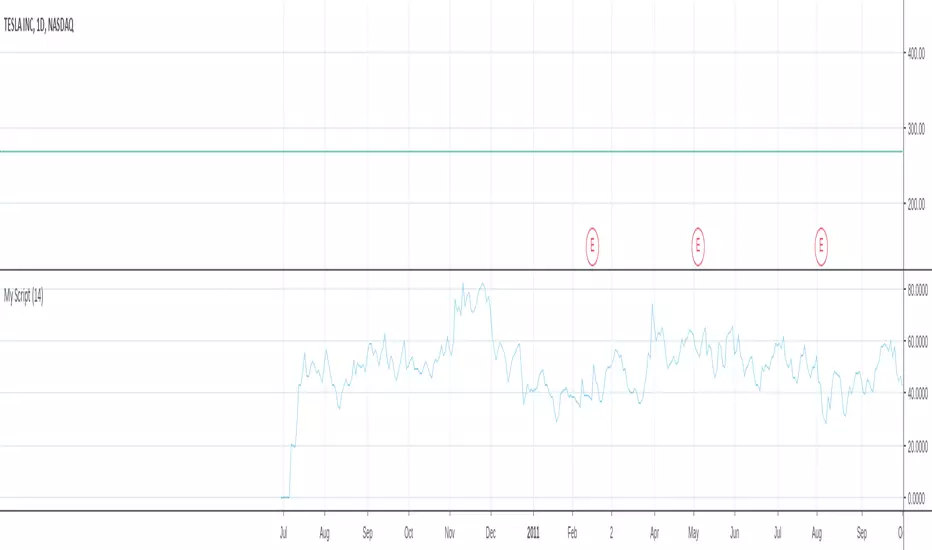
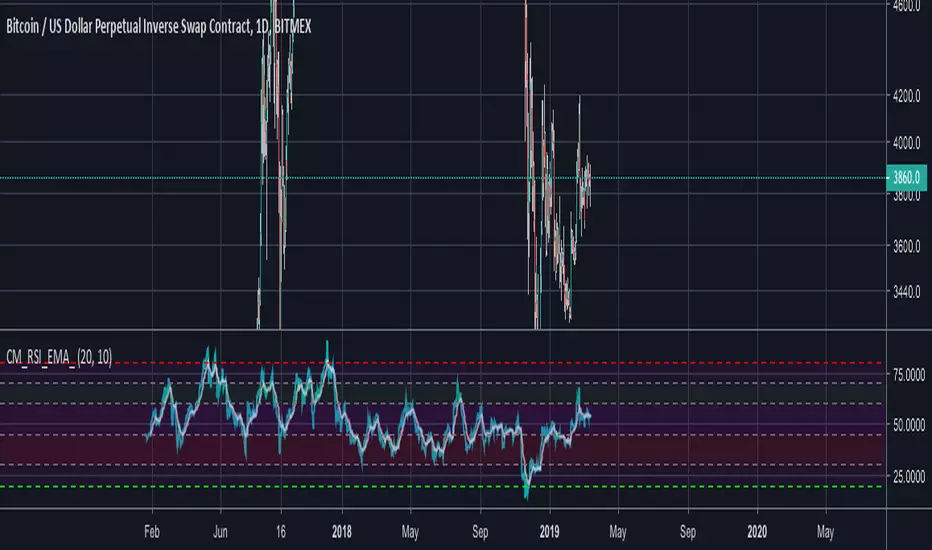
RSI TRI With Mid Point and HighlightsRSI that has the 50 line plotted plus it highlights overbought and oversold conditions.