Cerca negli script per "rsi"

RSI Forecast Colorful [DiFlip]RSI Forecast Colorful
Introducing one of the most complete RSI indicators available — a highly customizable analytical tool that integrates advanced prediction capabilities. RSI Forecast Colorful is an evolution of the classic RSI, designed to anticipate potential future RSI movements using linear regression. Instead of simply reacting to historical data, this indicator provides a statistical projection of the RSI’s future behavior, offering a forward-looking view of market conditions.
⯁ Real-Time RSI Forecasting
For the first time, a public RSI indicator integrates linear regression (least squares method) to forecast the RSI’s future behavior. This innovative approach allows traders to anticipate market movements based on historical trends. By applying Linear Regression to the RSI, the indicator displays a projected trendline n periods ahead, helping traders make more informed buy or sell decisions.
⯁ Highly Customizable
The indicator is fully adaptable to any trading style. Dozens of parameters can be optimized to match your system. All 28 long and short entry conditions are selectable and configurable, allowing the construction of quantitative, statistical, and automated trading models. Full control over signals ensures precise alignment with your strategy.
⯁ Innovative and Science-Based
This is the first public RSI indicator to apply least-squares predictive modeling to RSI calculations. Technically, it incorporates machine-learning logic into a classic indicator. Using Linear Regression embeds strong statistical foundations into RSI forecasting, making this tool especially valuable for traders seeking quantitative and analytical advantages.
⯁ Scientific Foundation: Linear Regression
Linear regression is a fundamental statistical method that models the relationship between a dependent variable y and one or more independent variables x. The general formula for simple linear regression is:
y = β₀ + β₁x + ε
where:
y = predicted variable (e.g., future RSI value)
x = explanatory variable (e.g., bar index or time)
β₀ = intercept (value of y when x = 0)
β₁ = slope (rate of change of y relative to x)
ε = random error term
The goal is to estimate β₀ and β₁ by minimizing the sum of squared errors. This is achieved using the least squares method, ensuring the best linear fit to historical data. Once the coefficients are calculated, the model extends the regression line forward, generating the RSI projection based on recent trends.
⯁ Least Squares Estimation
To minimize the error between predicted and observed values, we use the formulas:
β₁ = Σ((xᵢ - x̄)(yᵢ - ȳ)) / Σ((xᵢ - x̄)²)
β₀ = ȳ - β₁x̄
Σ denotes summation; x̄ and ȳ are the means of x and y; and i ranges from 1 to n (number of observations). These equations produce the best linear unbiased estimator under the Gauss–Markov assumptions — constant variance (homoscedasticity) and a linear relationship between variables.
⯁ Linear Regression in Machine Learning
Linear regression is a foundational component of supervised learning. Its simplicity and precision in numerical prediction make it essential in AI, predictive algorithms, and time-series forecasting. Applying regression to RSI is akin to embedding artificial intelligence inside a classic indicator, adding a new analytical dimension.
⯁ Visual Interpretation
Imagine a time series of RSI values like this:
Time →
RSI →
The regression line smooths these historical values and projects itself n periods forward, creating a predictive trajectory. This projected RSI line can cross the actual RSI, generating sophisticated entry and exit signals. In summary, the RSI Forecast Colorful indicator provides both the current RSI and the forecasted RSI, allowing comparison between past and future trend behavior.
⯁ Summary of Scientific Concepts Used
Linear Regression: Models relationships between variables using a straight line.
Least Squares: Minimizes squared prediction errors for optimal fit.
Time-Series Forecasting: Predicts future values from historical patterns.
Supervised Learning: Predictive modeling based on known output values.
Statistical Smoothing: Reduces noise to highlight underlying trends.
⯁ Why This Indicator Is Revolutionary
Scientifically grounded: Built on statistical and mathematical theory.
First of its kind: The first public RSI with least-squares predictive modeling.
Intelligent: Incorporates machine-learning logic into RSI interpretation.
Forward-looking: Generates predictive, not just reactive, signals.
Customizable: Exceptionally flexible for any strategic framework.
⯁ Conclusion
By combining RSI and linear regression, the RSI Forecast Colorful allows traders to predict market momentum rather than simply follow it. It's not just another indicator: it's a scientific advancement in technical analysis technology. Offering 28 configurable entry conditions and advanced signals, this open-source indicator paves the way for innovative quantitative systems.
⯁ Example of simple linear regression with one independent variable
This example demonstrates how a basic linear regression works when there is only one independent variable influencing the dependent variable. This type of model is used to identify a direct relationship between two variables.
⯁ In linear regression, observations (red) are considered the result of random deviations (green) from an underlying relationship (blue) between a dependent variable (y) and an independent variable (x)
This concept illustrates that sampled data points rarely align perfectly with the true trend line. Instead, each observed point represents the combination of the true underlying relationship and a random error component.
⯁ Visualizing heteroscedasticity in a scatterplot with 100 random fitted values using Matlab
Heteroscedasticity occurs when the variance of the errors is not constant across the range of fitted values. This visualization highlights how the spread of data can change unpredictably, which is an important factor in evaluating the validity of regression models.
⯁ The datasets in Anscombe’s quartet were designed to have nearly the same linear regression line (as well as nearly identical means, standard deviations, and correlations) but look very different when plotted
This classic example shows that summary statistics alone can be misleading. Even with identical numerical metrics, the datasets display completely different patterns, emphasizing the importance of visual inspection when interpreting a model.
⯁ Result of fitting a set of data points with a quadratic function
This example illustrates how a second-degree polynomial model can better fit certain datasets that do not follow a linear trend. The resulting curve reflects the true shape of the data more accurately than a straight line.
⯁ What Is RSI?
The RSI (Relative Strength Index) is a technical indicator developed by J. Welles Wilder. It measures the velocity and magnitude of recent price movements to identify overbought and oversold conditions. The RSI ranges from 0 to 100 and is commonly used to identify potential reversals and evaluate trend strength.
⯁ How RSI Works
RSI is calculated from average gains and losses over a set period (commonly 14 bars) and plotted on a 0–100 scale. It consists of three key zones:
Overbought: RSI above 70 may signal an overbought market.
Oversold: RSI below 30 may signal an oversold market.
Neutral Zone: RSI between 30 and 70, indicating no extreme condition.
These zones help identify potential price reversals and confirm trend strength.
⯁ Entry Conditions
All conditions below are fully customizable and allow detailed control over entry signal creation.
📈 BUY
🧲 Signal Validity: Signal remains valid for X bars.
🧲 Signal Logic: Configurable using AND or OR.
🧲 RSI > Upper
🧲 RSI < Upper
🧲 RSI > Lower
🧲 RSI < Lower
🧲 RSI > Middle
🧲 RSI < Middle
🧲 RSI > MA
🧲 RSI < MA
🧲 MA > Upper
🧲 MA < Upper
🧲 MA > Lower
🧲 MA < Lower
🧲 RSI (Crossover) Upper
🧲 RSI (Crossunder) Upper
🧲 RSI (Crossover) Lower
🧲 RSI (Crossunder) Lower
🧲 RSI (Crossover) Middle
🧲 RSI (Crossunder) Middle
🧲 RSI (Crossover) MA
🧲 RSI (Crossunder) MA
🧲 MA (Crossover)Upper
🧲 MA (Crossunder)Upper
🧲 MA (Crossover) Lower
🧲 MA (Crossunder) Lower
🧲 RSI Bullish Divergence
🧲 RSI Bearish Divergence
🔮 RSI (Crossover) Forecast MA
🔮 RSI (Crossunder) Forecast MA
📉 SELL
🧲 Signal Validity: Signal remains valid for X bars.
🧲 Signal Logic: Configurable using AND or OR.
🧲 RSI > Upper
🧲 RSI < Upper
🧲 RSI > Lower
🧲 RSI < Lower
🧲 RSI > Middle
🧲 RSI < Middle
🧲 RSI > MA
🧲 RSI < MA
🧲 MA > Upper
🧲 MA < Upper
🧲 MA > Lower
🧲 MA < Lower
🧲 RSI (Crossover) Upper
🧲 RSI (Crossunder) Upper
🧲 RSI (Crossover) Lower
🧲 RSI (Crossunder) Lower
🧲 RSI (Crossover) Middle
🧲 RSI (Crossunder) Middle
🧲 RSI (Crossover) MA
🧲 RSI (Crossunder) MA
🧲 MA (Crossover)Upper
🧲 MA (Crossunder)Upper
🧲 MA (Crossover) Lower
🧲 MA (Crossunder) Lower
🧲 RSI Bullish Divergence
🧲 RSI Bearish Divergence
🔮 RSI (Crossover) Forecast MA
🔮 RSI (Crossunder) Forecast MA
🤖 Automation
All BUY and SELL conditions can be automated using TradingView alerts. Every configurable condition can trigger alerts suitable for fully automated or semi-automated strategies.
⯁ Unique Features
Linear Regression Forecast
Signal Validity: Keep signals active for X bars
Signal Logic: AND/OR configuration
Condition Table: BUY/SELL
Condition Labels: BUY/SELL
Chart Labels: BUY/SELL markers above price
Automation & Alerts: BUY/SELL
Background Colors: bgcolor
Fill Colors: fill
Linear Regression Forecast
Signal Validity: Keep signals active for X bars
Signal Logic: AND/OR configuration
Condition Table: BUY/SELL
Condition Labels: BUY/SELL
Chart Labels: BUY/SELL markers above price
Automation & Alerts: BUY/SELL
Background Colors: bgcolor
Fill Colors: fill

RSI Overbought/Oversold + Divergence Indicator (new)//@version=5
indicator('CryptoSignalScanner - RSI Overbought/Oversold + Divergence Indicator (new)',
//---------------------------------------------------------------------------------------------------------------------------------
//--- Define Colors ---------------------------------------------------------------------------------------------------------------
//---------------------------------------------------------------------------------------------------------------------------------
vWhite = #FFFFFF
vViolet = #C77DF3
vIndigo = #8A2BE2
vBlue = #009CDF
vGreen = #5EBD3E
vYellow = #FFB900
vRed = #E23838
longColor = color.green
shortColor = color.red
textColor = color.white
bullishColor = color.rgb(38,166,154,0) //Used in the display table
bearishColor = color.rgb(239,83,79,0) //Used in the display table
nomatchColor = color.silver //Used in the display table
//---------------------------------------------------------------------------------------------------------------------------------------------------------------------
//--- Functions--------------------------------------------------------------------------------------------------------------------------------------------------------
//---------------------------------------------------------------------------------------------------------------------------------------------------------------------
TF2txt(TF) =>
switch TF
"S" => "RSI 1s:"
"5S" => "RSI 5s:"
"10S" => "RSI 10s:"
"15S" => "RSI 15s:"
"30S" => "RSI 30s"
"1" => "RSI 1m:"
"3" => "RSI 3m:"
"5" => "RSI 5m:"
"15" => "RSI 15m:"
"30" => "RSI 30m"
"45" => "RSI 45m"
"60" => "RSI 1h:"
"120" => "RSI 2h:"
"180" => "RSI 3h:"
"240" => "RSI 4h:"
"480" => "RSI 8h:"
"D" => "RSI 1D:"
"1D" => "RSI 1D:"
"2D" => "RSI 2D:"
"3D" => "RSI 2D:"
"3D" => "RSI 3W:"
"W" => "RSI 1W:"
"1W" => "RSI 1W:"
"M" => "RSI 1M:"
"1M" => "RSI 1M:"
"3M" => "RSI 3M:"
"6M" => "RSI 6M:"
"12M" => "RSI 12M:"
//---------------------------------------------------------------------------------------------------------------------------------------------------------------------
//--- Show/Hide Settings ----------------------------------------------------------------------------------------------------------------------------------------------
//---------------------------------------------------------------------------------------------------------------------------------------------------------------------
rsiShowInput = input(true, title='Show RSI', group='Show/Hide Settings')
maShowInput = input(false, title='Show MA', group='Show/Hide Settings')
showRSIMAInput = input(true, title='Show RSIMA Cloud', group='Show/Hide Settings')
rsiBandShowInput = input(true, title='Show Oversold/Overbought Lines', group='Show/Hide Settings')
rsiBandExtShowInput = input(true, title='Show Oversold/Overbought Extended Lines', group='Show/Hide Settings')
rsiHighlightShowInput = input(true, title='Show Oversold/Overbought Highlight Lines', group='Show/Hide Settings')
DivergenceShowInput = input(true, title='Show RSI Divergence Labels', group='Show/Hide Settings')
//---------------------------------------------------------------------------------------------------------------------------------------------------------------------
//--- Table Settings --------------------------------------------------------------------------------------------------------------------------------------------------
//---------------------------------------------------------------------------------------------------------------------------------------------------------------------
rsiShowTable = input(true, title='Show RSI Table Information box', group="RSI Table Settings")
rsiTablePosition = input.string(title='Location', defval='middle_right', options= , group="RSI Table Settings", inline='1')
rsiTextSize = input.string(title=' Size', defval='small', options= , group="RSI Table Settings", inline='1')
rsiShowTF1 = input(true, title='Show TimeFrame1', group="RSI Table Settings", inline='tf1')
rsiTF1 = input.timeframe("15", title=" Time", group="RSI Table Settings", inline='tf1')
rsiShowTF2 = input(true, title='Show TimeFrame2', group="RSI Table Settings", inline='tf2')
rsiTF2 = input.timeframe("60", title=" Time", group="RSI Table Settings", inline='tf2')
rsiShowTF3 = input(true, title='Show TimeFrame3', group="RSI Table Settings", inline='tf3')
rsiTF3 = input.timeframe("240", title=" Time", group="RSI Table Settings", inline='tf3')
rsiShowTF4 = input(true, title='Show TimeFrame4', group="RSI Table Settings", inline='tf4')
rsiTF4 = input.timeframe("D", title=" Time", group="RSI Table Settings", inline='tf4')
rsiShowHist = input(true, title='Show RSI Historical Columns', group="RSI Table Settings", tooltip='Show the information of the 2 previous closed candles')
//---------------------------------------------------------------------------------------------------------------------------------------------------------------------
//--- RSI Input Settings ----------------------------------------------------------------------------------------------------------------------------------------------
//---------------------------------------------------------------------------------------------------------------------------------------------------------------------
rsiSourceInput = input.source(close, 'Source', group='RSI Settings')
rsiLengthInput = input.int(14, minval=1, title='RSI Length', group='RSI Settings', tooltip='Here we set the RSI lenght')
rsiColorInput = input.color(#26a69a, title="RSI Color", group='RSI Settings')
rsimaColorInput = input.color(#ef534f, title="RSIMA Color", group='RSI Settings')
rsiBandColorInput = input.color(#787B86, title="RSI Band Color", group='RSI Settings')
rsiUpperBandExtInput = input.int(title='RSI Overbought Extended Line', defval=80, minval=50, maxval=100, group='RSI Settings')
rsiUpperBandInput = input.int(title='RSI Overbought Line', defval=70, minval=50, maxval=100, group='RSI Settings')
rsiLowerBandInput = input.int(title='RSI Oversold Line', defval=30, minval=0, maxval=50, group='RSI Settings')
rsiLowerBandExtInput = input.int(title='RSI Oversold Extended Line', defval=20, minval=0, maxval=50, group='RSI Settings')
//---------------------------------------------------------------------------------------------------------------------------------------------------------------------
//--- MA Input Settings -----------------------------------------------------------------------------------------------------------------------------------------------
//---------------------------------------------------------------------------------------------------------------------------------------------------------------------
maTypeInput = input.string("EMA", title="MA Type", options= , group="MA Settings")
maLengthInput = input.int(14, title="MA Length", group="MA Settings")
maColorInput = input.color(color.yellow, title="MA Color", group='MA Settings') //#7E57C2
//---------------------------------------------------------------------------------------------------------------------------------------------------------------------
//--- Divergence Input Settings ---------------------------------------------------------------------------------------------------------------------------------------
//---------------------------------------------------------------------------------------------------------------------------------------------------------------------
lbrInput = input(title="Pivot Lookback Right", defval=2, group='RSI Divergence Settings')
lblInput = input(title="Pivot Lookback Left", defval=2, group='RSI Divergence Settings')
lbRangeMaxInput = input(title="Max of Lookback Range", defval=10, group='RSI Divergence Settings')
lbRangeMinInput = input(title="Min of Lookback Range", defval=2, group='RSI Divergence Settings')
plotBullInput = input(title="Plot Bullish", defval=true, group='RSI Divergence Settings')
plotHiddenBullInput = input(title="Plot Hidden Bullish", defval=true, group='RSI Divergence Settings')
plotBearInput = input(title="Plot Bearish", defval=true, group='RSI Divergence Settings')
plotHiddenBearInput = input(title="Plot Hidden Bearish", defval=true, group='RSI Divergence Settings')
//---------------------------------------------------------------------------------------------------------------------------------------------------------------------
//--- RSI Calculation -------------------------------------------------------------------------------------------------------------------------------------------------
//---------------------------------------------------------------------------------------------------------------------------------------------------------------------
rsi = ta.rsi(rsiSourceInput, rsiLengthInput)
rsiprevious = rsi
= request.security(syminfo.tickerid, rsiTF1, [rsi, rsi , rsi ], lookahead=barmerge.lookahead_on)
= request.security(syminfo.tickerid, rsiTF2, [rsi, rsi , rsi ], lookahead=barmerge.lookahead_on)
= request.security(syminfo.tickerid, rsiTF3, [rsi, rsi , rsi ], lookahead=barmerge.lookahead_on)
= request.security(syminfo.tickerid, rsiTF4, [rsi, rsi , rsi ], lookahead=barmerge.lookahead_on)
//---------------------------------------------------------------------------------------------------------------------------------------------------------------------
//--- MA Calculation -------------------------------------------------------------------------------------------------------------------------------------------------
//---------------------------------------------------------------------------------------------------------------------------------------------------------------------
ma(source, length, type) =>
switch type
"SMA" => ta.sma(source, length)
"Bollinger Bands" => ta.sma(source, length)
"EMA" => ta.ema(source, length)
"SMMA (RMA)" => ta.rma(source, length)
"WMA" => ta.wma(source, length)
"VWMA" => ta.vwma(source, length)
rsiMA = ma(rsi, maLengthInput, maTypeInput)
rsiMAPrevious = rsiMA
//---------------------------------------------------------------------------------------------------------------------------------------------------------------------
//--- Stoch RSI Settings + Calculation --------------------------------------------------------------------------------------------------------------------------------
//---------------------------------------------------------------------------------------------------------------------------------------------------------------------
showStochRSI = input(false, title="Show Stochastic RSI", group='Stochastic RSI Settings')
smoothK = input.int(title="Stochastic K", defval=3, minval=1, maxval=10, group='Stochastic RSI Settings')
smoothD = input.int(title="Stochastic D", defval=4, minval=1, maxval=10, group='Stochastic RSI Settings')
lengthRSI = input.int(title="Stochastic RSI Lenght", defval=14, minval=1, group='Stochastic RSI Settings')
lengthStoch = input.int(title="Stochastic Lenght", defval=14, minval=1, group='Stochastic RSI Settings')
colorK = input.color(color.rgb(41,98,255,0), title="K Color", group='Stochastic RSI Settings', inline="1")
colorD = input.color(color.rgb(205,109,0,0), title="D Color", group='Stochastic RSI Settings', inline="1")
StochRSI = ta.rsi(rsiSourceInput, lengthRSI)
k = ta.sma(ta.stoch(StochRSI, StochRSI, StochRSI, lengthStoch), smoothK) //Blue Line
d = ta.sma(k, smoothD) //Red Line
//---------------------------------------------------------------------------------------------------------------------------------------------------------------------
//--- Divergence Settings ------------------------------------------------------------------------------------------------------------------------------------------
//---------------------------------------------------------------------------------------------------------------------------------------------------------------------
bearColor = color.red
bullColor = color.green
hiddenBullColor = color.new(color.green, 50)
hiddenBearColor = color.new(color.red, 50)
//textColor = color.white
noneColor = color.new(color.white, 100)
osc = rsi
plFound = na(ta.pivotlow(osc, lblInput, lbrInput)) ? false : true
phFound = na(ta.pivothigh(osc, lblInput, lbrInput)) ? false : true
_inRange(cond) =>
bars = ta.barssince(cond == true)
lbRangeMinInput <= bars and bars <= lbRangeMaxInput
//---------------------------------------------------------------------------------------------------------------------------------------------------------------------
//--- Define Plot & Line Colors ---------------------------------------------------------------------------------------------------------------------------------------
//---------------------------------------------------------------------------------------------------------------------------------------------------------------------
rsiColor = rsi >= rsiMA ? rsiColorInput : rsimaColorInput
//---------------------------------------------------------------------------------------------------------------------------------------------------------------------
//--- Plot Lines ------------------------------------------------------------------------------------------------------------------------------------------------------
//---------------------------------------------------------------------------------------------------------------------------------------------------------------------
// Create a horizontal line at a specific price level
myLine = line.new(bar_index , 75, bar_index, 75, color = color.rgb(187, 14, 14), width = 2)
bottom = line.new(bar_index , 50, bar_index, 50, color = color.rgb(223, 226, 28), width = 2)
mymainLine = line.new(bar_index , 60, bar_index, 60, color = color.rgb(13, 154, 10), width = 3)
hline(50, title='RSI Baseline', color=color.new(rsiBandColorInput, 50), linestyle=hline.style_solid, editable=false)
hline(rsiBandExtShowInput ? rsiUpperBandExtInput : na, title='RSI Upper Band', color=color.new(rsiBandColorInput, 10), linestyle=hline.style_dashed, editable=false)
hline(rsiBandShowInput ? rsiUpperBandInput : na, title='RSI Upper Band', color=color.new(rsiBandColorInput, 10), linestyle=hline.style_dashed, editable=false)
hline(rsiBandShowInput ? rsiLowerBandInput : na, title='RSI Upper Band', color=color.new(rsiBandColorInput, 10), linestyle=hline.style_dashed, editable=false)
hline(rsiBandExtShowInput ? rsiLowerBandExtInput : na, title='RSI Upper Band', color=color.new(rsiBandColorInput, 10), linestyle=hline.style_dashed, editable=false)
bgcolor(rsiHighlightShowInput ? rsi >= rsiUpperBandExtInput ? color.new(rsiColorInput, 70) : na : na, title="Show Extended Oversold Highlight", editable=false)
bgcolor(rsiHighlightShowInput ? rsi >= rsiUpperBandInput ? rsi < rsiUpperBandExtInput ? color.new(#64ffda, 90) : na : na: na, title="Show Overbought Highlight", editable=false)
bgcolor(rsiHighlightShowInput ? rsi <= rsiLowerBandInput ? rsi > rsiLowerBandExtInput ? color.new(#F43E32, 90) : na : na : na, title="Show Extended Oversold Highlight", editable=false)
bgcolor(rsiHighlightShowInput ? rsi <= rsiLowerBandInput ? color.new(rsimaColorInput, 70) : na : na, title="Show Oversold Highlight", editable=false)
maPlot = plot(maShowInput ? rsiMA : na, title='MA', color=color.new(maColorInput,0), linewidth=1)
rsiMAPlot = plot(showRSIMAInput ? rsiMA : na, title="RSI EMA", color=color.new(rsimaColorInput,0), editable=false, display=display.none)
rsiPlot = plot(rsiShowInput ? rsi : na, title='RSI', color=color.new(rsiColor,0), linewidth=1)
fill(rsiPlot, rsiMAPlot, color=color.new(rsiColor, 60), title="RSIMA Cloud")
plot(showStochRSI ? k : na, title='Stochastic K', color=colorK, linewidth=1)
plot(showStochRSI ? d : na, title='Stochastic D', color=colorD, linewidth=1)
//---------------------------------------------------------------------------------------------------------------------------------------------------------------------
//--- Plot Divergence -------------------------------------------------------------------------------------------------------------------------------------------------
//---------------------------------------------------------------------------------------------------------------------------------------------------------------------
// Regular Bullish
// Osc: Higher Low
oscHL = osc > ta.valuewhen(plFound, osc , 1) and _inRange(plFound )
// Price: Lower Low
priceLL = low < ta.valuewhen(plFound, low , 1)
bullCond = plotBullInput and priceLL and oscHL and plFound
plot(
plFound ? osc : na,
offset=-lbrInput,
title="Regular Bullish",
linewidth=2,
color=(bullCond ? bullColor : noneColor)
)
plotshape(
DivergenceShowInput ? bullCond ? osc : na : na,
offset=-lbrInput,
title="Regular Bullish Label",
text=" Bull ",
style=shape.labelup,
location=location.absolute,
color=bullColor,
textcolor=textColor
)
//------------------------------------------------------------------------------
// Hidden Bullish
// Osc: Lower Low
oscLL = osc < ta.valuewhen(plFound, osc , 1) and _inRange(plFound )
// Price: Higher Low
priceHL = low > ta.valuewhen(plFound, low , 1)
hiddenBullCond = plotHiddenBullInput and priceHL and oscLL and plFound
plot(
plFound ? osc : na,
offset=-lbrInput,
title="Hidden Bullish",
linewidth=2,
color=(hiddenBullCond ? hiddenBullColor : noneColor)
)
plotshape(
DivergenceShowInput ? hiddenBullCond ? osc : na : na,
offset=-lbrInput,
title="Hidden Bullish Label",
text=" H Bull ",
style=shape.labelup,
location=location.absolute,
color=bullColor,
textcolor=textColor
)
//------------------------------------------------------------------------------
// Regular Bearish
// Osc: Lower High
oscLH = osc < ta.valuewhen(phFound, osc , 1) and _inRange(phFound )
// Price: Higher High
priceHH = high > ta.valuewhen(phFound, high , 1)
bearCond = plotBearInput and priceHH and oscLH and phFound
plot(
phFound ? osc : na,
offset=-lbrInput,
title="Regular Bearish",
linewidth=2,
color=(bearCond ? bearColor : noneColor)
)
plotshape(
DivergenceShowInput ? bearCond ? osc : na : na,
offset=-lbrInput,
title="Regular Bearish Label",
text=" Bear ",
style=shape.labeldown,
location=location.absolute,
color=bearColor,
textcolor=textColor
)
//------------------------------------------------------------------------------
// Hidden Bearish
// Osc: Higher High
oscHH = osc > ta.valuewhen(phFound, osc , 1) and _inRange(phFound )
// Price: Lower High
priceLH = high < ta.valuewhen(phFound, high , 1)
hiddenBearCond = plotHiddenBearInput and priceLH and oscHH and phFound
plot(
phFound ? osc : na,
offset=-lbrInput,
title="Hidden Bearish",
linewidth=2,
color=(hiddenBearCond ? hiddenBearColor : noneColor)
)
plotshape(
DivergenceShowInput ? hiddenBearCond ? osc : na : na,
offset=-lbrInput,
title="Hidden Bearish Label",
text=" H Bear ",
style=shape.labeldown,
location=location.absolute,
color=bearColor,
textcolor=textColor
)
//---------------------------------------------------------------------------------------------------------------------------------------------------------------------
//--- Check RSI Lineup ------------------------------------------------------------------------------------------------------------------------------------------------
//---------------------------------------------------------------------------------------------------------------------------------------------------------------------
bullTF = rsi > rsi and rsi > rsi
bearTF = rsi < rsi and rsi < rsi
bullTF1 = rsi1 > rsi1_1 and rsi1_1 > rsi1_2
bearTF1 = rsi1 < rsi1_1 and rsi1_1 < rsi1_2
bullTF2 = rsi2 > rsi2_1 and rsi2_1 > rsi2_2
bearTF2 = rsi2 < rsi2_1 and rsi2_1 < rsi2_2
bullTF3 = rsi3 > rsi3_1 and rsi3_1 > rsi3_2
bearTF3 = rsi3 < rsi3_1 and rsi3_1 < rsi3_2
bullTF4 = rsi4 > rsi4_1 and rsi4_1 > rsi4_2
bearTF4 = rsi4 < rsi4_1 and rsi4_1 < rsi4_2
bbTxt(bull,bear) =>
bull ? "BULLISH" : bear ? "BEARISCH" : 'NO LINEUP'
bbColor(bull,bear) =>
bull ? bullishColor : bear ? bearishColor : nomatchColor
newTC(tBox, col, row, txt, width, txtColor, bgColor, txtHA, txtSize) =>
table.cell(table_id=tBox,column=col, row=row, text=txt, width=width,text_color=txtColor,bgcolor=bgColor, text_halign=txtHA, text_size=txtSize)
//---------------------------------------------------------------------------------------------------------------------------------------------------------------------
//--- Define RSI Table Setting ----------------------------------------------------------------------------------------------------------------------------------------
//---------------------------------------------------------------------------------------------------------------------------------------------------------------------
width_c0 = 0
width_c1 = 0
if rsiShowTable
var tBox = table.new(position=rsiTablePosition, columns=5, rows=6, bgcolor=color.rgb(18,22,33,50), frame_color=color.black, frame_width=1, border_color=color.black, border_width=1)
newTC(tBox, 0,1,"RSI Current",width_c0,color.orange,color.rgb(0,0,0,100),'right',rsiTextSize)
newTC(tBox, 1,1,str.format(" {0,number,#.##} ", rsi),width_c0,vWhite,rsi < 50 ? bearishColor:bullishColor,'left',rsiTextSize)
newTC(tBox, 4,1,bbTxt(bullTF, bearTF),width_c0,vWhite,bbColor(bullTF, bearTF),'center',rsiTextSize)
if rsiShowHist
newTC(tBox, 2,1,str.format(" {0,number,#.##} ", rsi ),width_c0,vWhite,rsi < 50 ? bearishColor:bullishColor,'left',rsiTextSize)
newTC(tBox, 3,1,str.format(" {0,number,#.##} ", rsi ),width_c0,vWhite,rsi < 50 ? bearishColor:bullishColor,'left',rsiTextSize)
if rsiShowTF1
newTC(tBox, 0,2,TF2txt(rsiTF1),width_c0,vWhite,color.rgb(0,0,0,100),'right',rsiTextSize)
newTC(tBox, 1,2,str.format(" {0,number,#.##} ", rsi1),width_c0,vWhite,rsi1 < 50 ? bearishColor:bullishColor,'left',rsiTextSize)
newTC(tBox, 4,2,bbTxt(bullTF1, bearTF1),width_c0,vWhite,bbColor(bullTF1,bearTF1),'center',rsiTextSize)
if rsiShowHist
newTC(tBox, 2,2,str.format(" {0,number,#.##} ", rsi1_1),width_c0,vWhite,rsi1_1 < 50 ? bearishColor:bullishColor,'left',rsiTextSize)
newTC(tBox, 3,2,str.format(" {0,number,#.##} ", rsi1_2),width_c0,vWhite,rsi1_2 < 50 ? bearishColor:bullishColor,'left',rsiTextSize)
if rsiShowTF2
newTC(tBox, 0,3,TF2txt(rsiTF2),width_c0,vWhite,color.rgb(0,0,0,100),'right',rsiTextSize)
newTC(tBox, 1,3,str.format(" {0,number,#.##} ", rsi2),width_c0,vWhite,rsi2 < 50 ? bearishColor:bullishColor,'left',rsiTextSize)
newTC(tBox, 4,3,bbTxt(bullTF2, bearTF2),width_c0,vWhite,bbColor(bullTF2,bearTF2),'center',rsiTextSize)
if rsiShowHist
newTC(tBox, 2,3,str.format(" {0,number,#.##} ", rsi2_1),width_c0,vWhite,rsi2_1 < 50 ? bearishColor:bullishColor,'left',rsiTextSize)
newTC(tBox, 3,3,str.format(" {0,number,#.##} ", rsi2_2),width_c0,vWhite,rsi2_2 < 50 ? bearishColor:bullishColor,'left',rsiTextSize)
if rsiShowTF3
newTC(tBox, 0,4,TF2txt(rsiTF3),width_c0,vWhite,color.rgb(0,0,0,100),'right',rsiTextSize)
newTC(tBox, 1,4,str.format(" {0,number,#.##} ", rsi3),width_c0,vWhite,rsi3 < 50 ? bearishColor:bullishColor,'left',rsiTextSize)
newTC(tBox, 4,4,bbTxt(bullTF3, bearTF3),width_c0,vWhite,bbColor(bullTF3,bearTF3),'center',rsiTextSize)
if rsiShowHist
newTC(tBox, 2,4,str.format(" {0,number,#.##} ", rsi3_1),width_c0,vWhite,rsi3_1 < 50 ? bearishColor:bullishColor,'left',rsiTextSize)
newTC(tBox, 3,4,str.format(" {0,number,#.##} ", rsi3_2),width_c0,vWhite,rsi3_2 < 50 ? bearishColor:bullishColor,'left',rsiTextSize)
if rsiShowTF4
newTC(tBox, 0,5,TF2txt(rsiTF4),width_c0,vWhite,color.rgb(0,0,0,100),'right',rsiTextSize)
newTC(tBox, 1,5,str.format(" {0,number,#.##} ", rsi4),width_c0,vWhite,rsi4 < 50 ? bearishColor:bullishColor,'left',rsiTextSize)
newTC(tBox, 4,5,bbTxt(bullTF4, bearTF4),width_c0,vWhite,bbColor(bullTF4,bearTF4),'center',rsiTextSize)
if rsiShowHist
newTC(tBox, 2,5,str.format(" {0,number,#.##} ", rsi4_1),width_c0,vWhite,rsi4_1 < 50 ? bearishColor:bullishColor,'left',rsiTextSize)
newTC(tBox, 3,5,str.format(" {0,number,#.##} ", rsi4_2),width_c0,vWhite,rsi4_2 < 50 ? bearishColor:bullishColor,'left',rsiTextSize)
//------------------------------------------------------
//--- Alerts -------------------------------------------
//------------------------------------------------------

RSI Bollinger Bands [DCAUT]█ RSI Bollinger Bands
📊 ORIGINALITY & INNOVATION
The RSI Bollinger Bands indicator represents a meaningful advancement in momentum analysis by combining two proven technical tools: the Relative Strength Index (RSI) and Bollinger Bands. This combination addresses a significant limitation in traditional RSI analysis - the use of fixed overbought/oversold thresholds (typically 70/30) that fail to adapt to changing market volatility conditions.
Core Innovation:
Rather than relying on static threshold levels, this indicator applies Bollinger Bands statistical analysis directly to RSI values, creating dynamic zones that automatically adjust based on recent momentum volatility. This approach helps reduce false signals during low volatility periods while remaining sensitive to genuine extremes during high volatility conditions.
Key Enhancements Over Traditional RSI:
Dynamic Thresholds: Overbought/oversold zones adapt to market conditions automatically, eliminating the need for manual threshold adjustments across different instruments and timeframes
Volatility Context: Band width provides immediate visual feedback about momentum volatility, helping traders distinguish between stable trends and erratic movements
Reduced False Signals: During ranging markets, narrower bands filter out minor RSI fluctuations that would trigger traditional fixed-threshold signals
Breakout Preparation: Band squeeze patterns (similar to price-based BB) signal potential momentum regime changes before they occur
Self-Referencing Analysis: By measuring RSI against its own statistical behavior rather than arbitrary levels, the indicator provides more relevant context
📐 MATHEMATICAL FOUNDATION
Two-Stage Calculation Process:
Stage 1: RSI Calculation
RSI = 100 - (100 / (1 + RS))
where RS = Average Gain / Average Loss over specified period
The RSI normalizes price momentum into a bounded 0-100 scale, making it ideal for statistical band analysis.
Stage 2: Bollinger Bands on RSI
Basis = MA(RSI, BB Length)
Upper Band = Basis + (StdDev(RSI, BB Length) × Multiplier)
Lower Band = Basis - (StdDev(RSI, BB Length) × Multiplier)
Band Width = Upper Band - Lower Band
The Bollinger Bands measure RSI's standard deviation from its own moving average, creating statistically-derived dynamic zones.
Statistical Interpretation:
Under normal distribution assumptions with default 2.0 multiplier, approximately 95% of RSI values should fall within the bands
Band touches represent statistically significant momentum extremes relative to recent behavior
Band width expansion indicates increasing momentum volatility (strengthening trend or increasing uncertainty)
Band width contraction signals momentum consolidation and potential regime change preparation
📊 COMPREHENSIVE SIGNAL ANALYSIS
Visual Color Signals:
This indicator features dynamic color fills that highlight extreme momentum conditions:
Green Fill (Above Upper Band):
Appears when RSI breaks above the upper band, indicating exceptionally strong bullish momentum
Represents dynamic overbought zone - not necessarily a reversal signal but a warning of extreme conditions
In strong uptrends, green fills can persist as RSI "rides the band" - this indicates sustained momentum strength
Exit of green zone (RSI falling back below upper band) often signals initial momentum weakening
Red Fill (Below Lower Band):
Appears when RSI breaks below the lower band, indicating exceptionally weak bearish momentum
Represents dynamic oversold zone - potential reversal or continuation signal depending on trend context
In strong downtrends, red fills can persist as RSI "rides the band" - this indicates sustained selling pressure
Exit of red zone (RSI rising back above lower band) often signals initial momentum recovery
Position-Based Signals:
Upper Band Interactions:
RSI Touching Upper Band: Dynamic overbought condition - momentum is extremely strong relative to recent volatility, potential exhaustion or continuation depending on trend context
RSI Riding Upper Band: Sustained strong momentum, often seen in powerful trends, not necessarily an immediate reversal signal but warrants monitoring for exhaustion
RSI Crossing Below Upper Band: Initial momentum weakening signal, particularly significant if accompanied by price divergence
Lower Band Interactions:
RSI Touching Lower Band: Dynamic oversold condition - momentum is extremely weak relative to recent volatility, potential reversal or continuation of downtrend
RSI Riding Lower Band: Sustained weak momentum, common in strong downtrends, monitor for potential exhaustion
RSI Crossing Above Lower Band: Initial momentum strengthening signal, early indication of potential reversal or consolidation
Basis Line Signals:
RSI Above Basis: Bullish momentum regime - upward pressure dominant
RSI Below Basis: Bearish momentum regime - downward pressure dominant
Basis Crossovers: Momentum regime shifts, more significant when accompanied by band width changes
RSI Oscillating Around Basis: Balanced momentum, often indicates ranging market conditions
Volatility-Based Signals:
Band Width Patterns:
Narrow Bands (Squeeze): Momentum volatility compression, often precedes significant directional moves, similar to price coiling patterns
Expanding Bands: Increasing momentum volatility, indicates trend acceleration or growing uncertainty
Narrowest Band in 100 Bars: Extreme compression alert, high probability of upcoming volatility expansion
Advanced Pattern Recognition:
Divergence Analysis:
Bullish Divergence: Price makes lower lows while RSI touches or stays above previous lower band touch, suggests downward momentum weakening
Bearish Divergence: Price makes higher highs while RSI touches or stays below previous upper band touch, suggests upward momentum weakening
Hidden Bullish: Price makes higher lows while RSI makes lower lows at the lower band, indicates strong underlying bullish momentum
Hidden Bearish: Price makes lower highs while RSI makes higher highs at the upper band, indicates strong underlying bearish momentum
Band Walk Patterns:
Upper Band Walk: RSI consistently touching or staying near upper band indicates exceptionally strong trend, wait for clear break below basis before considering reversal
Lower Band Walk: RSI consistently at lower band signals very weak momentum, requires break above basis for reversal confirmation
🎯 STRATEGIC APPLICATIONS
Strategy 1: Mean Reversion Trading
Setup Conditions:
Market Type: Ranging or choppy markets with no clear directional trend
Timeframe: Works best on lower timeframes (5m-1H) or during consolidation phases
Band Characteristic: Normal to narrow band width
Entry Rules:
Long Entry: RSI touches or crosses below lower band, wait for RSI to start rising back toward basis before entry
Short Entry: RSI touches or crosses above upper band, wait for RSI to start falling back toward basis before entry
Confirmation: Use price action confirmation (candlestick reversal patterns) at band touches
Exit Rules:
Target: RSI returns to basis line or opposite band
Stop Loss: Fixed percentage or below recent swing low/high
Time Stop: Exit if position not profitable within expected timeframe
Strategy 2: Trend Continuation Trading
Setup Conditions:
Market Type: Clear trending market with higher highs/lower lows
Timeframe: Medium to higher timeframes (1H-Daily)
Band Characteristic: Expanding or wide bands indicating strong momentum
Entry Rules:
Long Entry in Uptrend: Wait for RSI to pull back to basis line or slightly below, enter when RSI starts rising again
Short Entry in Downtrend: Wait for RSI to rally to basis line or slightly above, enter when RSI starts falling again
Avoid Counter-Trend: Do not fade RSI at bands during strong trends (band walk patterns)
Exit Rules:
Trailing Stop: Move stop to break-even when RSI reaches opposite band
Trend Break: Exit when RSI crosses basis against trend direction with conviction
Band Squeeze: Reduce position size when bands start narrowing significantly
Strategy 3: Breakout Preparation
Setup Conditions:
Market Type: Consolidating market after significant move or at key technical levels
Timeframe: Any timeframe, but longer timeframes provide more reliable breakouts
Band Characteristic: Narrowest band width in recent 100 bars (squeeze alert)
Preparation Phase:
Identify band squeeze condition (bands at multi-period narrowest point)
Monitor price action for consolidation patterns (triangles, rectangles, flags)
Prepare bracket orders for both directions
Wait for band expansion to begin
Entry Execution:
Breakout Confirmation: Enter in direction of RSI band breakout (RSI breaks above upper band or below lower band)
Price Confirmation: Ensure price also breaks corresponding technical level
Volume Confirmation: Look for volume expansion supporting the breakout
Risk Management:
Stop Loss: Place beyond consolidation pattern opposite extreme
Position Sizing: Use smaller size due to false breakout risk
Quick Exit: Exit immediately if RSI returns inside bands within 1-3 bars
Strategy 4: Multi-Timeframe Analysis
Timeframe Selection:
Higher Timeframe: Daily or 4H for trend context
Trading Timeframe: 1H or 15m for entry signals
Confirmation Timeframe: 5m or 1m for precise entry timing
Analysis Process:
Trend Identification: Check higher timeframe RSI position relative to bands, trade only in direction of higher timeframe momentum
Setup Formation: Wait for trading timeframe RSI to show pullback to basis in trending direction
Entry Timing: Use confirmation timeframe RSI band touch or crossover for precise entry
Alignment Confirmation: All timeframes should show RSI moving in same direction for highest probability setups
📋 DETAILED PARAMETER CONFIGURATION
RSI Source:
Close (Default): Standard price point, balances responsiveness and reliability
HL2: Reduces noise from intrabar volatility, provides smoother RSI values
HLC3 or OHLC4: Further smoothing for very choppy markets, slower to respond but more stable
Volume-Weighted: Consider using VWAP or volume-weighted prices for additional liquidity context
RSI Length Parameter:
Shorter Periods (5-10): More responsive but generates more signals, suitable for scalping or very active trading, higher noise level
Standard (14): Default and most widely used setting, proven balance between responsiveness and reliability, recommended starting point
Longer Periods (21-30): Smoother momentum measurement, fewer but potentially more reliable signals, better for swing trading or position trading
Optimization Note: Test across different market regimes, optimal length often varies by instrument volatility characteristics
RSI MA Type Parameter:
RMA (Default): Wilder's original smoothing method, provides traditional RSI behavior with balanced lag, most widely recognized and tested, recommended for standard technical analysis
EMA: Exponential smoothing gives more weight to recent values, faster response to momentum changes, suitable for active trading and trending markets, reduces lag compared to RMA
SMA: Simple average treats all periods equally, smoothest output with highest lag, best for filtering noise in choppy markets, useful for long-term position analysis
WMA: Weighted average emphasizes recent data less aggressively than EMA, middle ground between SMA and EMA characteristics, balanced responsiveness for swing trading
Advanced Options: Full access to 25+ moving average types including HMA (reduced lag), DEMA/TEMA (enhanced responsiveness), KAMA/FRAMA (adaptive behavior), T3 (smoothness), Kalman Filter (optimal estimation)
Selection Guide: RMA for traditional analysis and backtesting consistency, EMA for faster signals in trending markets, SMA for stability in ranging markets, adaptive types (KAMA/FRAMA) for varying volatility regimes
BB Length Parameter:
Short Length (10-15): Tighter bands that react quickly to RSI changes, more frequent band touches, suitable for active trading styles
Standard (20): Balanced approach providing meaningful statistical context without excessive lag
Long Length (30-50): Smoother bands that filter minor RSI fluctuations, captures only significant momentum extremes, fewer but higher quality signals
Relationship to RSI Length: Consider BB Length greater than RSI Length for cleaner signals
BB MA Type Parameter:
SMA (Default): Standard Bollinger Bands calculation using simple moving average for basis line, treats all periods equally, widely recognized and tested approach
EMA: Exponential smoothing for basis line gives more weight to recent RSI values, creates more responsive bands that adapt faster to momentum changes, suitable for trending markets
RMA: Wilder's smoothing provides consistent behavior aligned with traditional RSI when using RMA for both RSI and BB calculations
WMA: Weighted average for basis line balances recent emphasis with historical context, middle ground between SMA and EMA responsiveness
Advanced Options: Full access to 25+ moving average types for basis calculation, including HMA (reduced lag), DEMA/TEMA (enhanced responsiveness), KAMA/FRAMA (adaptive to volatility changes)
Selection Guide: SMA for standard Bollinger Bands behavior and backtesting consistency, EMA for faster band adaptation in dynamic markets, matching RSI MA type creates unified smoothing behavior
BB Multiplier Parameter:
Conservative (1.5-1.8): Tighter bands resulting in more frequent touches, useful in low volatility environments, higher signal frequency but potentially more false signals
Standard (2.0): Default setting representing approximately 95% confidence interval under normal distribution, widely accepted statistical threshold
Aggressive (2.5-3.0): Wider bands capturing only extreme momentum conditions, fewer but potentially more significant signals, reduces false signals in high volatility
Adaptive Approach: Consider adjusting multiplier based on instrument characteristics, lower multiplier for stable instruments, higher for volatile instruments
Parameter Optimization Workflow:
Start with default parameters (RSI:14, BB:20, Mult:2.0)
Test across representative sample period including different market regimes
Adjust RSI length based on desired responsiveness vs stability tradeoff
Tune BB length to match your typical holding period
Modify multiplier to achieve desired signal frequency
Validate on out-of-sample data to avoid overfitting
Document optimal parameters for different instruments and timeframes
Reference Levels Display:
Enabled (Default): Shows traditional 30/50/70 levels for comparison with dynamic bands, helps visualize the adaptive advantage
Disabled: Cleaner chart focusing purely on dynamic zones, reduces visual clutter for experienced users
Educational Value: Keeping reference levels visible helps understand how dynamic bands differ from fixed thresholds across varying market conditions
📈 PERFORMANCE ANALYSIS & COMPETITIVE ADVANTAGES
Comparison with Traditional RSI:
Fixed Threshold RSI Limitations:
In ranging low-volatility markets: RSI rarely reaches 70/30, missing tradable extremes
In trending high-volatility markets: RSI frequently breaks through 70/30, generating excessive false reversal signals
Across different instruments: Same thresholds applied to volatile crypto and stable forex pairs produce inconsistent results
Threshold Adjustment Problem: Manually changing thresholds for different conditions is subjective and lagging
RSI Bollinger Bands Advantages:
Automatic Adaptation: Bands adjust to current volatility regime without manual intervention
Consistent Logic: Same statistical approach works across different instruments and timeframes
Reduced False Signals: Band width filtering helps distinguish meaningful extremes from noise
Additional Information: Band width provides volatility context missing in standard RSI
Objective Extremes: Statistical basis (standard deviations) provides objective extreme definition
Comparison with Price-Based Bollinger Bands:
Price BB Characteristics:
Measures absolute price volatility
Affected by large price gaps and outliers
Band position relative to price not normalized
Difficult to compare across different price scales
RSI BB Advantages:
Normalized Scale: RSI's 0-100 bounds make band interpretation consistent across all instruments
Momentum Focus: Directly measures momentum extremes rather than price extremes
Reduced Gap Impact: RSI calculation smooths price gaps impact on band calculations
Comparable Analysis: Same RSI BB appearance across stocks, forex, crypto enables consistent strategy application
Performance Characteristics:
Signal Quality:
Higher Signal-to-Noise Ratio: Dynamic bands help filter RSI oscillations that don't represent meaningful extremes
Context-Aware Alerts: Band width provides volatility context helping traders adjust position sizing and stop placement
Reduced Whipsaws: During consolidations, narrower bands prevent premature signals from minor RSI movements
Responsiveness:
Adaptive Lag: Band calculation introduces some lag, but this lag is adaptive to current conditions rather than fixed
Faster Than Manual Adjustment: Automatic band adjustment is faster than trader's ability to manually modify thresholds
Balanced Approach: Combines RSI's inherent momentum lag with BB's statistical smoothing for stable yet responsive signals
Versatility:
Multi-Strategy Application: Supports both mean reversion (ranging markets) and trend continuation (trending markets) approaches
Universal Instrument Coverage: Works effectively across equities, forex, commodities, cryptocurrencies without parameter changes
Timeframe Agnostic: Same interpretation applies from 1-minute charts to monthly charts
Limitations and Considerations:
Known Limitations:
Dual Lag Effect: Combines RSI's momentum lag with BB's statistical lag, making it less suitable for very short-term scalping
Requires Volatility History: Needs sufficient bars for BB calculation, less effective immediately after major regime changes
Statistical Assumptions: Assumes RSI values are somewhat normally distributed, extreme trending conditions may violate this
Not a Standalone System: Like all indicators, should be combined with price action analysis and risk management
Optimal Use Cases:
Best for swing trading and position trading timeframes
Most effective in markets with alternating volatility regimes
Ideal for traders who use multiple instruments and timeframes
Suitable for systematic trading approaches requiring consistent logic
Suboptimal Conditions:
Very low timeframes (< 5 minutes) where lag becomes problematic
Instruments with extreme volatility spikes (gap-prone markets)
Markets in strong persistent trends where mean reversion rarely occurs
Periods immediately following major structural changes (new trading regime)
USAGE NOTES
This indicator is designed for technical analysis and educational purposes to help traders understand the interaction between momentum measurement and statistical volatility bands. The RSI Bollinger Bands has limitations and should not be used as the sole basis for trading decisions.
Important Considerations:
No Predictive Guarantee: Past band touches and patterns do not guarantee future price behavior
Market Regime Dependency: Indicator performance varies significantly between trending and ranging market conditions
Complementary Analysis Required: Should be used alongside price action, support/resistance levels, and fundamental analysis
Risk Management Essential: Always use proper position sizing, stop losses, and risk controls regardless of signal quality
Parameter Sensitivity: Different instruments and timeframes may require parameter optimization for optimal results
Continuous Monitoring: Band characteristics change with market conditions, requiring ongoing assessment
Recommended Supporting Analysis:
Price structure analysis (support/resistance, trend lines)
Volume confirmation for breakout signals
Multiple timeframe alignment
Market context awareness (news events, session times)
Correlation analysis with related instruments
The indicator aims to provide adaptive momentum analysis that adjusts to changing market volatility, but traders must apply sound judgment, proper risk management, and comprehensive market analysis in their decision-making process.

RSI Full Forecast [Titans_Invest]RSI Full Forecast
Get ready to experience the ultimate evolution of RSI-based indicators – the RSI Full Forecast, a boosted and even smarter version of the already powerful: RSI Forecast
Now featuring over 40 additional entry conditions (forecasts), this indicator redefines the way you view the market.
AI-Powered RSI Forecasting:
Using advanced linear regression with the least squares method – a solid foundation for machine learning - the RSI Full Forecast enables you to predict future RSI behavior with impressive accuracy.
But that’s not all: this new version also lets you monitor future crossovers between the RSI and the MA RSI, delivering early and strategic signals that go far beyond traditional analysis.
You’ll be able to monitor future crossovers up to 20 bars ahead, giving you an even broader and more precise view of market movements.
See the Future, Now:
• Track upcoming RSI & RSI MA crossovers in advance.
• Identify potential reversal zones before price reacts.
• Uncover statistical behavior patterns that would normally go unnoticed.
40+ Intelligent Conditions:
The new layer of conditions is designed to detect multiple high-probability scenarios based on historical patterns and predictive modeling. Each additional forecast is a window into the price's future, powered by robust mathematics and advanced algorithmic logic.
Full Customization:
All parameters can be tailored to fit your strategy – from smoothing periods to prediction sensitivity. You have complete control to turn raw data into smart decisions.
Innovative, Accurate, Unique:
This isn’t just an upgrade. It’s a quantum leap in technical analysis.
RSI Full Forecast is the first of its kind: an indicator that blends statistical analysis, machine learning, and visual design to create a true real-time predictive system.
⯁ SCIENTIFIC BASIS LINEAR REGRESSION
Linear Regression is a fundamental method of statistics and machine learning, used to model the relationship between a dependent variable y and one or more independent variables 𝑥.
The general formula for a simple linear regression is given by:
y = β₀ + β₁x + ε
β₁ = Σ((xᵢ - x̄)(yᵢ - ȳ)) / Σ((xᵢ - x̄)²)
β₀ = ȳ - β₁x̄
Where:
y = is the predicted variable (e.g. future value of RSI)
x = is the explanatory variable (e.g. time or bar index)
β0 = is the intercept (value of 𝑦 when 𝑥 = 0)
𝛽1 = is the slope of the line (rate of change)
ε = is the random error term
The goal is to estimate the coefficients 𝛽0 and 𝛽1 so as to minimize the sum of the squared errors — the so-called Random Error Method Least Squares.
⯁ LEAST SQUARES ESTIMATION
To minimize the error between predicted and observed values, we use the following formulas:
β₁ = /
β₀ = ȳ - β₁x̄
Where:
∑ = sum
x̄ = mean of x
ȳ = mean of y
x_i, y_i = individual values of the variables.
Where:
x_i and y_i are the means of the independent and dependent variables, respectively.
i ranges from 1 to n, the number of observations.
These equations guarantee the best linear unbiased estimator, according to the Gauss-Markov theorem, assuming homoscedasticity and linearity.
⯁ LINEAR REGRESSION IN MACHINE LEARNING
Linear regression is one of the cornerstones of supervised learning. Its simplicity and ability to generate accurate quantitative predictions make it essential in AI systems, predictive algorithms, time series analysis, and automated trading strategies.
By applying this model to the RSI, you are literally putting artificial intelligence at the heart of a classic indicator, bringing a new dimension to technical analysis.
⯁ VISUAL INTERPRETATION
Imagine an RSI time series like this:
Time →
RSI →
The regression line will smooth these values and extend them n periods into the future, creating a predicted trajectory based on the historical moment. This line becomes the predicted RSI, which can be crossed with the actual RSI to generate more intelligent signals.
⯁ SUMMARY OF SCIENTIFIC CONCEPTS USED
Linear Regression Models the relationship between variables using a straight line.
Least Squares Minimizes the sum of squared errors between prediction and reality.
Time Series Forecasting Estimates future values based on historical data.
Supervised Learning Trains models to predict outputs from known inputs.
Statistical Smoothing Reduces noise and reveals underlying trends.
⯁ WHY THIS INDICATOR IS REVOLUTIONARY
Scientifically-based: Based on statistical theory and mathematical inference.
Unprecedented: First public RSI with least squares predictive modeling.
Intelligent: Built with machine learning logic.
Practical: Generates forward-thinking signals.
Customizable: Flexible for any trading strategy.
⯁ CONCLUSION
By combining RSI with linear regression, this indicator allows a trader to predict market momentum, not just follow it.
RSI Full Forecast is not just an indicator — it is a scientific breakthrough in technical analysis technology.
⯁ Example of simple linear regression, which has one independent variable:
⯁ In linear regression, observations ( red ) are considered to be the result of random deviations ( green ) from an underlying relationship ( blue ) between a dependent variable ( y ) and an independent variable ( x ).
⯁ Visualizing heteroscedasticity in a scatterplot against 100 random fitted values using Matlab:
⯁ The data sets in the Anscombe's quartet are designed to have approximately the same linear regression line (as well as nearly identical means, standard deviations, and correlations) but are graphically very different. This illustrates the pitfalls of relying solely on a fitted model to understand the relationship between variables.
⯁ The result of fitting a set of data points with a quadratic function:
_________________________________________________
🔮 Linear Regression: PineScript Technical Parameters 🔮
_________________________________________________
Forecast Types:
• Flat: Assumes prices will remain the same.
• Linreg: Makes a 'Linear Regression' forecast for n periods.
Technical Information:
ta.linreg (built-in function)
Linear regression curve. A line that best fits the specified prices over a user-defined time period. It is calculated using the least squares method. The result of this function is calculated using the formula: linreg = intercept + slope * (length - 1 - offset), where intercept and slope are the values calculated using the least squares method on the source series.
Syntax:
• Function: ta.linreg()
Parameters:
• source: Source price series.
• length: Number of bars (period).
• offset: Offset.
• return: Linear regression curve.
This function has been cleverly applied to the RSI, making it capable of projecting future values based on past statistical trends.
______________________________________________________
______________________________________________________
⯁ WHAT IS THE RSI❓
The Relative Strength Index (RSI) is a technical analysis indicator developed by J. Welles Wilder. It measures the magnitude of recent price movements to evaluate overbought or oversold conditions in a market. The RSI is an oscillator that ranges from 0 to 100 and is commonly used to identify potential reversal points, as well as the strength of a trend.
⯁ HOW TO USE THE RSI❓
The RSI is calculated based on average gains and losses over a specified period (usually 14 periods). It is plotted on a scale from 0 to 100 and includes three main zones:
• Overbought: When the RSI is above 70, indicating that the asset may be overbought.
• Oversold: When the RSI is below 30, indicating that the asset may be oversold.
• Neutral Zone: Between 30 and 70, where there is no clear signal of overbought or oversold conditions.
______________________________________________________
______________________________________________________
⯁ ENTRY CONDITIONS
The conditions below are fully flexible and allow for complete customization of the signal.
______________________________________________________
______________________________________________________
🔹 CONDITIONS TO BUY 📈
______________________________________________________
• Signal Validity: The signal will remain valid for X bars .
• Signal Sequence: Configurable as AND or OR .
📈 RSI Conditions:
🔹 RSI > Upper
🔹 RSI < Upper
🔹 RSI > Lower
🔹 RSI < Lower
🔹 RSI > Middle
🔹 RSI < Middle
🔹 RSI > MA
🔹 RSI < MA
📈 MA Conditions:
🔹 MA > Upper
🔹 MA < Upper
🔹 MA > Lower
🔹 MA < Lower
📈 Crossovers:
🔹 RSI (Crossover) Upper
🔹 RSI (Crossunder) Upper
🔹 RSI (Crossover) Lower
🔹 RSI (Crossunder) Lower
🔹 RSI (Crossover) Middle
🔹 RSI (Crossunder) Middle
🔹 RSI (Crossover) MA
🔹 RSI (Crossunder) MA
🔹 MA (Crossover) Upper
🔹 MA (Crossunder) Upper
🔹 MA (Crossover) Lower
🔹 MA (Crossunder) Lower
📈 RSI Divergences:
🔹 RSI Divergence Bull
🔹 RSI Divergence Bear
📈 RSI Forecast:
🔹 RSI (Crossover) MA Forecast
🔹 RSI (Crossunder) MA Forecast
🔹 RSI Forecast 1 > MA Forecast 1
🔹 RSI Forecast 1 < MA Forecast 1
🔹 RSI Forecast 2 > MA Forecast 2
🔹 RSI Forecast 2 < MA Forecast 2
🔹 RSI Forecast 3 > MA Forecast 3
🔹 RSI Forecast 3 < MA Forecast 3
🔹 RSI Forecast 4 > MA Forecast 4
🔹 RSI Forecast 4 < MA Forecast 4
🔹 RSI Forecast 5 > MA Forecast 5
🔹 RSI Forecast 5 < MA Forecast 5
🔹 RSI Forecast 6 > MA Forecast 6
🔹 RSI Forecast 6 < MA Forecast 6
🔹 RSI Forecast 7 > MA Forecast 7
🔹 RSI Forecast 7 < MA Forecast 7
🔹 RSI Forecast 8 > MA Forecast 8
🔹 RSI Forecast 8 < MA Forecast 8
🔹 RSI Forecast 9 > MA Forecast 9
🔹 RSI Forecast 9 < MA Forecast 9
🔹 RSI Forecast 10 > MA Forecast 10
🔹 RSI Forecast 10 < MA Forecast 10
🔹 RSI Forecast 11 > MA Forecast 11
🔹 RSI Forecast 11 < MA Forecast 11
🔹 RSI Forecast 12 > MA Forecast 12
🔹 RSI Forecast 12 < MA Forecast 12
🔹 RSI Forecast 13 > MA Forecast 13
🔹 RSI Forecast 13 < MA Forecast 13
🔹 RSI Forecast 14 > MA Forecast 14
🔹 RSI Forecast 14 < MA Forecast 14
🔹 RSI Forecast 15 > MA Forecast 15
🔹 RSI Forecast 15 < MA Forecast 15
🔹 RSI Forecast 16 > MA Forecast 16
🔹 RSI Forecast 16 < MA Forecast 16
🔹 RSI Forecast 17 > MA Forecast 17
🔹 RSI Forecast 17 < MA Forecast 17
🔹 RSI Forecast 18 > MA Forecast 18
🔹 RSI Forecast 18 < MA Forecast 18
🔹 RSI Forecast 19 > MA Forecast 19
🔹 RSI Forecast 19 < MA Forecast 19
🔹 RSI Forecast 20 > MA Forecast 20
🔹 RSI Forecast 20 < MA Forecast 20
______________________________________________________
______________________________________________________
🔸 CONDITIONS TO SELL 📉
______________________________________________________
• Signal Validity: The signal will remain valid for X bars .
• Signal Sequence: Configurable as AND or OR .
📉 RSI Conditions:
🔸 RSI > Upper
🔸 RSI < Upper
🔸 RSI > Lower
🔸 RSI < Lower
🔸 RSI > Middle
🔸 RSI < Middle
🔸 RSI > MA
🔸 RSI < MA
📉 MA Conditions:
🔸 MA > Upper
🔸 MA < Upper
🔸 MA > Lower
🔸 MA < Lower
📉 Crossovers:
🔸 RSI (Crossover) Upper
🔸 RSI (Crossunder) Upper
🔸 RSI (Crossover) Lower
🔸 RSI (Crossunder) Lower
🔸 RSI (Crossover) Middle
🔸 RSI (Crossunder) Middle
🔸 RSI (Crossover) MA
🔸 RSI (Crossunder) MA
🔸 MA (Crossover) Upper
🔸 MA (Crossunder) Upper
🔸 MA (Crossover) Lower
🔸 MA (Crossunder) Lower
📉 RSI Divergences:
🔸 RSI Divergence Bull
🔸 RSI Divergence Bear
📉 RSI Forecast:
🔸 RSI (Crossover) MA Forecast
🔸 RSI (Crossunder) MA Forecast
🔸 RSI Forecast 1 > MA Forecast 1
🔸 RSI Forecast 1 < MA Forecast 1
🔸 RSI Forecast 2 > MA Forecast 2
🔸 RSI Forecast 2 < MA Forecast 2
🔸 RSI Forecast 3 > MA Forecast 3
🔸 RSI Forecast 3 < MA Forecast 3
🔸 RSI Forecast 4 > MA Forecast 4
🔸 RSI Forecast 4 < MA Forecast 4
🔸 RSI Forecast 5 > MA Forecast 5
🔸 RSI Forecast 5 < MA Forecast 5
🔸 RSI Forecast 6 > MA Forecast 6
🔸 RSI Forecast 6 < MA Forecast 6
🔸 RSI Forecast 7 > MA Forecast 7
🔸 RSI Forecast 7 < MA Forecast 7
🔸 RSI Forecast 8 > MA Forecast 8
🔸 RSI Forecast 8 < MA Forecast 8
🔸 RSI Forecast 9 > MA Forecast 9
🔸 RSI Forecast 9 < MA Forecast 9
🔸 RSI Forecast 10 > MA Forecast 10
🔸 RSI Forecast 10 < MA Forecast 10
🔸 RSI Forecast 11 > MA Forecast 11
🔸 RSI Forecast 11 < MA Forecast 11
🔸 RSI Forecast 12 > MA Forecast 12
🔸 RSI Forecast 12 < MA Forecast 12
🔸 RSI Forecast 13 > MA Forecast 13
🔸 RSI Forecast 13 < MA Forecast 13
🔸 RSI Forecast 14 > MA Forecast 14
🔸 RSI Forecast 14 < MA Forecast 14
🔸 RSI Forecast 15 > MA Forecast 15
🔸 RSI Forecast 15 < MA Forecast 15
🔸 RSI Forecast 16 > MA Forecast 16
🔸 RSI Forecast 16 < MA Forecast 16
🔸 RSI Forecast 17 > MA Forecast 17
🔸 RSI Forecast 17 < MA Forecast 17
🔸 RSI Forecast 18 > MA Forecast 18
🔸 RSI Forecast 18 < MA Forecast 18
🔸 RSI Forecast 19 > MA Forecast 19
🔸 RSI Forecast 19 < MA Forecast 19
🔸 RSI Forecast 20 > MA Forecast 20
🔸 RSI Forecast 20 < MA Forecast 20
______________________________________________________
______________________________________________________
🤖 AUTOMATION 🤖
• You can automate the BUY and SELL signals of this indicator.
______________________________________________________
______________________________________________________
⯁ UNIQUE FEATURES
______________________________________________________
Linear Regression: (Forecast)
Signal Validity: The signal will remain valid for X bars
Signal Sequence: Configurable as AND/OR
Condition Table: BUY/SELL
Condition Labels: BUY/SELL
Plot Labels in the Graph Above: BUY/SELL
Automate and Monitor Signals/Alerts: BUY/SELL
Linear Regression (Forecast)
Signal Validity: The signal will remain valid for X bars
Signal Sequence: Configurable as AND/OR
Condition Table: BUY/SELL
Condition Labels: BUY/SELL
Plot Labels in the Graph Above: BUY/SELL
Automate and Monitor Signals/Alerts: BUY/SELL
______________________________________________________
📜 SCRIPT : RSI Full Forecast
🎴 Art by : @Titans_Invest & @DiFlip
👨💻 Dev by : @Titans_Invest & @DiFlip
🎑 Titans Invest — The Wizards Without Gloves 🧤
✨ Enjoy!
______________________________________________________
o Mission 🗺
• Inspire Traders to manifest Magic in the Market.
o Vision 𐓏
• To elevate collective Energy 𐓷𐓏

RSI Forecast [Titans_Invest]RSI Forecast
Introducing one of the most impressive RSI indicators ever created – arguably the best on TradingView, and potentially the best in the world.
RSI Forecast is a visionary evolution of the classic RSI, merging powerful customization with groundbreaking predictive capabilities. While preserving the core principles of traditional RSI, it takes analysis to the next level by allowing users to anticipate potential future RSI movements.
Real-Time RSI Forecasting:
For the first time ever, an RSI indicator integrates linear regression using the least squares method to accurately forecast the future behavior of the RSI. This innovation empowers traders to stay one step ahead of the market with forward-looking insight.
Highly Customizable:
Easily adapt the indicator to your personal trading style. Fine-tune a variety of parameters to generate signals perfectly aligned with your strategy.
Innovative, Unique, and Powerful:
This is the world’s first RSI Forecast to apply this predictive approach using least squares linear regression. A truly elite-level tool designed for traders who want a real edge in the market.
⯁ SCIENTIFIC BASIS LINEAR REGRESSION
Linear Regression is a fundamental method of statistics and machine learning, used to model the relationship between a dependent variable y and one or more independent variables 𝑥.
The general formula for a simple linear regression is given by:
y = β₀ + β₁x + ε
Where:
y = is the predicted variable (e.g. future value of RSI)
x = is the explanatory variable (e.g. time or bar index)
β0 = is the intercept (value of 𝑦 when 𝑥 = 0)
𝛽1 = is the slope of the line (rate of change)
ε = is the random error term
The goal is to estimate the coefficients 𝛽0 and 𝛽1 so as to minimize the sum of the squared errors — the so-called Random Error Method Least Squares.
⯁ LEAST SQUARES ESTIMATION
To minimize the error between predicted and observed values, we use the following formulas:
β₁ = /
β₀ = ȳ - β₁x̄
Where:
∑ = sum
x̄ = mean of x
ȳ = mean of y
x_i, y_i = individual values of the variables.
Where:
x_i and y_i are the means of the independent and dependent variables, respectively.
i ranges from 1 to n, the number of observations.
These equations guarantee the best linear unbiased estimator, according to the Gauss-Markov theorem, assuming homoscedasticity and linearity.
⯁ LINEAR REGRESSION IN MACHINE LEARNING
Linear regression is one of the cornerstones of supervised learning. Its simplicity and ability to generate accurate quantitative predictions make it essential in AI systems, predictive algorithms, time series analysis, and automated trading strategies.
By applying this model to the RSI, you are literally putting artificial intelligence at the heart of a classic indicator, bringing a new dimension to technical analysis.
⯁ VISUAL INTERPRETATION
Imagine an RSI time series like this:
Time →
RSI →
The regression line will smooth these values and extend them n periods into the future, creating a predicted trajectory based on the historical moment. This line becomes the predicted RSI, which can be crossed with the actual RSI to generate more intelligent signals.
⯁ SUMMARY OF SCIENTIFIC CONCEPTS USED
Linear Regression Models the relationship between variables using a straight line.
Least Squares Minimizes the sum of squared errors between prediction and reality.
Time Series Forecasting Estimates future values based on historical data.
Supervised Learning Trains models to predict outputs from known inputs.
Statistical Smoothing Reduces noise and reveals underlying trends.
⯁ WHY THIS INDICATOR IS REVOLUTIONARY
Scientifically-based: Based on statistical theory and mathematical inference.
Unprecedented: First public RSI with least squares predictive modeling.
Intelligent: Built with machine learning logic.
Practical: Generates forward-thinking signals.
Customizable: Flexible for any trading strategy.
⯁ CONCLUSION
By combining RSI with linear regression, this indicator allows a trader to predict market momentum, not just follow it.
RSI Forecast is not just an indicator — it is a scientific breakthrough in technical analysis technology.
⯁ Example of simple linear regression, which has one independent variable:
⯁ In linear regression, observations ( red ) are considered to be the result of random deviations ( green ) from an underlying relationship ( blue ) between a dependent variable ( y ) and an independent variable ( x ).
⯁ Visualizing heteroscedasticity in a scatterplot against 100 random fitted values using Matlab:
⯁ The data sets in the Anscombe's quartet are designed to have approximately the same linear regression line (as well as nearly identical means, standard deviations, and correlations) but are graphically very different. This illustrates the pitfalls of relying solely on a fitted model to understand the relationship between variables.
⯁ The result of fitting a set of data points with a quadratic function:
_______________________________________________________________________
🥇 This is the world’s first RSI indicator with: Linear Regression for Forecasting 🥇_______________________________________________________________________
_________________________________________________
🔮 Linear Regression: PineScript Technical Parameters 🔮
_________________________________________________
Forecast Types:
• Flat: Assumes prices will remain the same.
• Linreg: Makes a 'Linear Regression' forecast for n periods.
Technical Information:
ta.linreg (built-in function)
Linear regression curve. A line that best fits the specified prices over a user-defined time period. It is calculated using the least squares method. The result of this function is calculated using the formula: linreg = intercept + slope * (length - 1 - offset), where intercept and slope are the values calculated using the least squares method on the source series.
Syntax:
• Function: ta.linreg()
Parameters:
• source: Source price series.
• length: Number of bars (period).
• offset: Offset.
• return: Linear regression curve.
This function has been cleverly applied to the RSI, making it capable of projecting future values based on past statistical trends.
______________________________________________________
______________________________________________________
⯁ WHAT IS THE RSI❓
The Relative Strength Index (RSI) is a technical analysis indicator developed by J. Welles Wilder. It measures the magnitude of recent price movements to evaluate overbought or oversold conditions in a market. The RSI is an oscillator that ranges from 0 to 100 and is commonly used to identify potential reversal points, as well as the strength of a trend.
⯁ HOW TO USE THE RSI❓
The RSI is calculated based on average gains and losses over a specified period (usually 14 periods). It is plotted on a scale from 0 to 100 and includes three main zones:
• Overbought: When the RSI is above 70, indicating that the asset may be overbought.
• Oversold: When the RSI is below 30, indicating that the asset may be oversold.
• Neutral Zone: Between 30 and 70, where there is no clear signal of overbought or oversold conditions.
______________________________________________________
______________________________________________________
⯁ ENTRY CONDITIONS
The conditions below are fully flexible and allow for complete customization of the signal.
______________________________________________________
______________________________________________________
🔹 CONDITIONS TO BUY 📈
______________________________________________________
• Signal Validity: The signal will remain valid for X bars .
• Signal Sequence: Configurable as AND or OR .
📈 RSI Conditions:
🔹 RSI > Upper
🔹 RSI < Upper
🔹 RSI > Lower
🔹 RSI < Lower
🔹 RSI > Middle
🔹 RSI < Middle
🔹 RSI > MA
🔹 RSI < MA
📈 MA Conditions:
🔹 MA > Upper
🔹 MA < Upper
🔹 MA > Lower
🔹 MA < Lower
📈 Crossovers:
🔹 RSI (Crossover) Upper
🔹 RSI (Crossunder) Upper
🔹 RSI (Crossover) Lower
🔹 RSI (Crossunder) Lower
🔹 RSI (Crossover) Middle
🔹 RSI (Crossunder) Middle
🔹 RSI (Crossover) MA
🔹 RSI (Crossunder) MA
🔹 MA (Crossover) Upper
🔹 MA (Crossunder) Upper
🔹 MA (Crossover) Lower
🔹 MA (Crossunder) Lower
📈 RSI Divergences:
🔹 RSI Divergence Bull
🔹 RSI Divergence Bear
📈 RSI Forecast:
🔮 RSI (Crossover) MA Forecast
🔮 RSI (Crossunder) MA Forecast
______________________________________________________
______________________________________________________
🔸 CONDITIONS TO SELL 📉
______________________________________________________
• Signal Validity: The signal will remain valid for X bars .
• Signal Sequence: Configurable as AND or OR .
📉 RSI Conditions:
🔸 RSI > Upper
🔸 RSI < Upper
🔸 RSI > Lower
🔸 RSI < Lower
🔸 RSI > Middle
🔸 RSI < Middle
🔸 RSI > MA
🔸 RSI < MA
📉 MA Conditions:
🔸 MA > Upper
🔸 MA < Upper
🔸 MA > Lower
🔸 MA < Lower
📉 Crossovers:
🔸 RSI (Crossover) Upper
🔸 RSI (Crossunder) Upper
🔸 RSI (Crossover) Lower
🔸 RSI (Crossunder) Lower
🔸 RSI (Crossover) Middle
🔸 RSI (Crossunder) Middle
🔸 RSI (Crossover) MA
🔸 RSI (Crossunder) MA
🔸 MA (Crossover) Upper
🔸 MA (Crossunder) Upper
🔸 MA (Crossover) Lower
🔸 MA (Crossunder) Lower
📉 RSI Divergences:
🔸 RSI Divergence Bull
🔸 RSI Divergence Bear
📉 RSI Forecast:
🔮 RSI (Crossover) MA Forecast
🔮 RSI (Crossunder) MA Forecast
______________________________________________________
______________________________________________________
🤖 AUTOMATION 🤖
• You can automate the BUY and SELL signals of this indicator.
______________________________________________________
______________________________________________________
⯁ UNIQUE FEATURES
______________________________________________________
Linear Regression: (Forecast)
Signal Validity: The signal will remain valid for X bars
Signal Sequence: Configurable as AND/OR
Condition Table: BUY/SELL
Condition Labels: BUY/SELL
Plot Labels in the Graph Above: BUY/SELL
Automate and Monitor Signals/Alerts: BUY/SELL
Linear Regression (Forecast)
Signal Validity: The signal will remain valid for X bars
Signal Sequence: Configurable as AND/OR
Condition Table: BUY/SELL
Condition Labels: BUY/SELL
Plot Labels in the Graph Above: BUY/SELL
Automate and Monitor Signals/Alerts: BUY/SELL
______________________________________________________
📜 SCRIPT : RSI Forecast
🎴 Art by : @Titans_Invest & @DiFlip
👨💻 Dev by : @Titans_Invest & @DiFlip
🎑 Titans Invest — The Wizards Without Gloves 🧤
✨ Enjoy!
______________________________________________________
o Mission 🗺
• Inspire Traders to manifest Magic in the Market.
o Vision 𐓏
• To elevate collective Energy 𐓷𐓏

RSI 11 IndicatorThis script explains how RSI can be used to catch market moves in trend, reversal or sideways market.
What is RSI indicator:-
RSI is a momentum oscillator which measures the speed and change of price movements. RSI moves up and down (oscillates) between ZERO and 100. Generally RSI above 70 is considered overbought and below 30 is considered oversold. Some traders may use a setting of 20 and 80 for oversold and overbought conditions respectively. However this may reduce the number of signals. You can also use RSI to identify divergences, strength, reversals, general trend etc.
Calculation:-
There are three basic components in the RSI - Avg Gain, Avg Loss & RS.
Avg Gain = Average of Upward Price Change
Avg Loss = Average of Downward Price Change
RS = (Avg Gain)/(Avg Loss)
RSI = 100 – (100 / (1 +RS ))
First Calculation:-
RSI calculation is based on default 14 periods.
Average gain and Average loss are simple 14 period averages.
Average Loss equals the sum of the losses divided by 14 for the first calculation.
Average Gain equals the sum of the Gains divided by 14 for the first calculation.
First Average Gain = Sum of Gains over the past 14 periods / 14.
First Average Loss = Sum of Losses over the past 14 periods / 14.
The formula uses a positive value for the average loss.
RS values are smoothed after the first calculation.
Second Calculation:-
Subsequent calculations multiply the prior value by 13, add the most recent value, and divide the total by 14.
Average Gain = / 14.
Average Loss = / 14.
if
Average Loss = 0, RSI = 100 (means there were no losses to measure).
Average Gain = 0, RSI = 0 (means there were no gains to measure).
Logic of this indicator:-
RSI is an oscillator that fluctuates between zero and 100 which makes it easy to use for many traders.
Its easy to identify extremes because RSI is range-bound.
But remember that RSI works best in range bound market and is less trustworthy in trending markets.
A new trader need to be cautious because during strong trends in the market/security, RSI may remain in overbought or oversold for extended periods.
Chart Timeframe:-
RSI indicator works well on all timeframes.
Timeframe depends on which strategy or settings are you using.
Generally a lower timeframe like 1 min, 3 min, 5 min, 15 min, 30 min, 1 Hr etc is used for intraday trades or short duration trades
and higher timeframes like 1 day, 1 week, 1 month are used for positional or long term trades.
Please Read the Idea "Mastering RSI with 11 Strategies" to understand this indicator better.
Indicator 1
Basis Strategy of Overbought and Oversold
Usually an asset with RSI reading of 70 or above indicates a bullish and an overbought situation.
overbought can be seen as trading at a higher price than it should.
traders may expect a price correction or trend reversal and sell the security.
but RSI indicator can stay in the overbought for a long time when the stock is in uptrend - This may trap an immature trader.
an Immature trader will enter a sell position when RSI become overbought (70), whereas a mature trader will enter sell position when RSI line crosses below the overbought line (70).
An asset with RSI reading of 30 or below indicates a bearish and an oversold condition.
oversold can be seen as trading at a lower price than it should.
traders may expect a price correction or trend reversal and buy the security.
but RSI indicator can stay in the oversold for a long time when the stock is in downtrend - This may trap an immature trader.
an Immature trader will enter a buy position when RSI become oversold (30), whereas a mature trader will enter buy position when RSI line crosses above the oversold line (30).
Center dotted Mid line is RSI 50.
Chart RSI is shown in yellow colour.
Red shaded area above the red horizontal line shows the stock or security has entered overbought condition. "R" signal in red shows a likely downside reversal, means it may be a likely Selling opportunity.
Green shaded area below the green horizontal line shows the stock or security has entered oversold condition. "R" signal in green shows a likely upside reversal, means it may be a likely Buying opportunity.
Note:-
so its better to wait for reversal signal.
traders may use 20 instead of 30 as oversold level and 80 instead of 70 as overbought level.
new traders may learn to use the indicator as per the prevailing trend to get better results.
false signals may be avoided by using bullish signals in bullish trend and bearish signals in bearish trend.
Indicator 2
RSI Strength Crossing 50
RSI crossing centreline 50 in the below chart showing strength and buy/sell signal.
Centre line is at RSI 50.
if RSI is above 50 its considered bullish trend. (increasing strength)
if RSI is below 50 its considered bearish trend. (decreasing strength)
RSI crossing centre line (50) upside may be a buy signal.
RSI crossing centre line (50) downside may be a sell signal.
"B" signal in green colour shows that RSI is crossing above Mid 50 horizontal line, which may be a likely Buy signal.
"S" signal in red colour shows that RSI is crossing below Mid 50 horizontal line, which may be a likely Sell signal.
Indicator 3
RSI 40 and RSI 60 Support and Resistance
RSI 40 acting as support in the below chart
In an uptrend RSI tends to remain in the 40 to 90 range with 40 as support (buying opportunity at support).
RSI 60 acting as resistance in the below chart
In a downtrend RSI tends to remain in 10 to 60 range with 60 as resistance (selling opportunity at resistance).
"40" signal in green colour shows that RSI is crossing above 40 horizontal line, which may be a likely Support in making and a Buy signal.
"60" signal in red colour shows that RSI is crossing below 60 horizontal line, which may be a likely Resistance in making and a Sell signal.
Note:-
These ranges may change depending on RSI settings and change in the market trend.
Indicator 4
RSI Divergence
Below chart shows a simple example of Bullish Divergence and Bearish Divergence.
An RSI divergence occurs when price moves in the opposite direction of the RSI.
A bullish divergence is when price is falling but RSI is rising. which means RSI making higher lows and price making lower lows (buy signal).
A bearish divergence is when price is rising but RSI is falling. which means RSI making lower high and price making higher highs (sell signal).
Divergences are more strong when appear in an overbought or oversold condition.
There may be many false signals during a strong uptrend or strong downtrend.
In a strong uptrend, RSI may show many false bearish divergences before finally reversing down.
same way in a strong downtrend, RSI may show many false bullish divergences before finally reversing up.
"Bull Div" signal along with divergence line in green colour shows Bullish Divergence, which may be a likely Buy signal.
"Bear Div" signal along with divergence line in red colour shows Bearish Divergence, which may be a likely Sell signal.
Indicator 5
Double Top & Double Bottom
Double Bottom = RSI goes below oversold (30). RSI comes back above 30. RSI falls back again towards 30 and again rise making a Double bottom. its a signal of buying and likely upside reversal.
Double Top = RSI goes above overbought (70). RSI comes back below 70. RSI rises back again towards 70 and again fall making a Double top. its a signal of selling and likely downside reversal.
Double Bottom is shown with Green Dashed line joining two low's of RSI indicating a likely Buy Signal.
Double Top is shown with Red Dashed line joining two High's of RSI indicating a likely Sell Signal.
Indicator 6
Trendline Support and Resistance
Below chart shows RSI Trendline Resistance and Support
RSI resistance trendline = Connect three or more points on the RSI line as it falls to draw a RSI downtrend line (RSI resistance trendline).
Everytime it takes resistance from a RSI downtrend line its a selling opportunity.
RSI support trendline = Connect three or more points on the RSI line as it rises to draw a RSI uptrend line (RSI support trendline).
Everytime it takes support on a RSI uptrend line its a buying opportunity.
RSI Resistance trendline shown in Red colour indicating a likely fall again after rejection from this Red trendline till the time RSI breaks above it to change the trend from Bearsih to Bullish.
RSI support trendline shown in Green colour indicating a likely Rise again after support from this Green trendline till the time RSI breaks below it to change the trend from Bullish to Bearish.
Indicator 7
Trendline Breakout and Breakdown
Below chart shows RSI Trendline Breakout and Breakdown
RSI resistance trendline Breakout = Connect three or more points on the RSI line as it falls to draw a RSI downtrend line (RSI resistance trendline).
Whenever it breakout above RSI resistance trendline its a buying opportunity.
RSI support trendline Breakdown = Connect three or more points on the RSI line as it rises to draw a RSI uptrend line (RSI support trendline).
Whenever it breakdown below RSI support trendline its a selling opportunity.
Note:-
Correlate both the RSI and the closing price to ensure proper breakout or breakdown.
Challenge is to correctly identify if a breakout or breakdown is sustainable or its a false signal.
Indicator 8
RSI Crossover same timeframe
RSI with two different RSI length crossing each other on same timeframe.
when lower RSI length crossing above higher RSI length its a buy signal.
when lower RSI length crossing below higher RSI length its a sell signal.
for example RSI with length 7 & length 14 on 15 Minutes timeframe.
Green Cross shows that Fast RSI is crossing above Slow RSI on the same timeframe with different RSI length Settings, which means it may be a likely Buy Signal.
Red Cross shows that Fast RSI is crossing below Slow RSI on the same timeframe with different RSI length Settings, which means it may be a likely Sell Signal.
Indicator 9
RSI Crossover Multi timeframe
RSI with same RSI length but on two different timeframes crossing each.
when lower timeframe RSI crossing above higher timeframe RSI its a buy signal.
when lower timeframe RSI crossing below higher timeframe RSI its a sell signal.
for example RSI with length 14 on 5 Minutes and 1 Hr timeframes.
Green Cross shows that Lower Timeframe RSI is crossing above Higher Timeframe RSI with same RSI length Settings, which means it may be a likely Buy Signal.
Red Cross shows that Lower Timeframe RSI is crossing below Higher Timeframe RSI with same RSI length Settings, which means it may be a likely Sell Signal.
Indicator 10
RSI EMA/WMA/SMA Crossover
when RSI crossing above EMA/WMA/SMA its a buy signal.
when RSI crossing below EMA/WMA/SMA its a sell signal.
Green Circle shows that RSI is crossing above EMA/WMA/SMA etc, which means it may be a likely Buy Signal.
Red Circle shows that RSI is crossing below EMA/WMA/SMA etc, which means it may be a likely Sell Signal.
Indicator 11
RSI with Bollinger bands
Bollinger bands and RSI complimenting each other and giving a Buy and Sell signal in below chart
if a security price reaches upper band of a Bollinger Band channel and also the RSI is above 70 (overbought), a trader can look for selling opportunities (reversal) (sell).
but in case price reaches upper band of a Bollinger Band channel but RSI is not above 70 (overbought), there may be chance that security remains in an uptrend, so a trader may wait before entering a sell position.
if a security price reaches lower band of a Bollinger Band channel and also the RSI is below 30 (oversold), a trader can look for buying opportunities (reversal) (buy).
but in case price reaches lower band of a Bollinger Band channel but RSI is not below 30 (oversold), there may be chance that security remains in an downtrend, so a trader may wait before entering a buy position.
so bollinger band with RSI can give a double confirmation on a reversal.
Buy Signal = If the RSI is below Green Horizontal line (Oversold zone) and also below Lower Bollinger Band it indicates that an upside reversal may come, which means that it may be a likely Buy Signal.
Sell Signal = If the RSI is above Red Horizontal line (Overbought zone) and also above Upper Bollinger Band it indicates that an Downside reversal may come, which means that it may be a likely Sell Signal.
Special Thanks to //© HoanGhetti for RSI Trendlines.
Limitations of the RSI:-
RSI works best in range bound market and is less trustworthy in trending markets.
So new traders may get trapped in an uptrend or a downtrend if they forget to see the overall long term trend of that security.
Traders should set stop loss and take profit levels as per risk reward ratio.
Note:
Don't confuse RSI and relative strength. RSI is changes in the price momentum of a security.
whereas relative strength compares the price performance of two or more securities.
Like other technical indicators, RSI also is not a holy grail. It can only assist you in building a good strategy. You can only succeed with proper position sizing, risk management and following correct trading Psychology (No overtrade, No greed, No revenge trade etc).
THIS INDICATOR OF RSI IS FOR EDUCATIONAL PURPOSE AND PAPER TRADING ONLY. YOU MAY PAPER TRADE TO GAIN CONFIDENCE AND BUILD FURTHER ON THESE. PLEASE CONSULT YOUR FINANCIAL ADVISOR BEFORE INVESTING. WE ARE NOT SEBI REGISTERED.
Hope you all like it
happy learning.

RSI-all in one_Pro[vn]👉Hello traders.
Introducing the " RSI all-in-one " Bot that includes the functions:
+ Automatically scan RSI divergence
+ Automatically scan RSI trendlines
+ Create an alert when there is a golden signal (RSI creates a divergence and then breaks its trendline, signaling a trend reversal)
Explain:
During trading when using the indicator "RSI - trendlines - div " in my library on TW web page:
- I have an idea to create a Bot indicator about "Automatically scan RSI divergences and trendlines". Because those are the top strengths when traders use the RSI to forecast trend reversals.
- On each chart of the trading pair, the RSI draws the trendline pair as: uptrendline and downtrendline (closest to the RSI)
- So when the statistics on "Bot" also shows the column of RSI trendlines up and the column of RSI trendlines down
- Column |════🡹\n\ʀꜱɪ| - is the above RSI trendline
- Column |ʀꜱɪ\n\════🡻| - is the below RSI trendline
- When RSI approaches any one of its trendlines and the ratio is 10%, then:
+ in column |✎\n\𝖙.𝖑𝖎𝖓𝖊| Red colored digits (downtrend)
+ in column |𝖙.𝖑𝖎𝖓𝖊\n\✐| blue colored digits (uptrend)
Is the value of the RSI trendline for traders to pay more attention to when it can be the entry and exit points according to the resistance and support nature of the RSI trendlines.
- When the RSI breaks the above trendline, it shows is "🡹", if it is the first candle, at the column |════🡹\n\ʀꜱɪ| it shows as "🡹1|1|1" the cell turns green , that's the RSI signal breaking the line. Its resistance to go up, wait for the candle to close, we can enter "Buy/Long" order.
- When the RSI line breaks below the trendline, it shows is "🡻", if it is the first candle, then at the column |ʀꜱɪ\n\════🡻| it displays as "🡻1|1|1" the cell turns red , that's the RSI signal breaking the line Support to continue down, wait for the candle to close, we can enter "Sell/Short" order
- The parameter when breaking shows 10|10|10, it means that the RSI has broken 10 candles (RSI candles), and the first 10 candles are colored green (bullish) red (bearish) then hidden. (can be changed in settings). In addition, when displaying the parameters of the cell as above, the column |✎\n\𝖙.𝖑𝖎𝖓𝖊| and |𝖙.𝖑𝖎𝖓𝖊\n\✐| will show the percentage from when the RSI break point to the current RSI (closed)
- Column |𝚍𝚒𝚟| is a divergence signal. When the price makes a new high, a new low, and the RSI signals a divergence, it will start to increase the base from the number 1. From here, the Trader will know which trading pair is starting to divergence RSI. Cell is Green bullish divergence, Cell is red bearish divergence
- Column|🆁🆂🅸| is the current RSI .{🟢} RSI above the cloud , {🔴} RSI below the cloud , {⚪️} RSI in the cloud(RSI clouds also indicate very well the support and resistance zone of RSI)
- There are 5 warning functions on this indicator
- The parameter {20:2} is the length of the RSI trendline and combines the same parameters with the "RSI - trendlines - div{vn}" indicator when analyzing
💥 Summary:
Trading methods with this indicator:
+ Trade when there is a divergence
+ Trade when the RSI approaches its trendline (it is the support and resistance line of the RSI)
+ Trade when the RSI breaks the trendline (definitively above or below)
+ Trade when there is a divergence then after a few candles, RSI breaks through its trendline, giving a golden signal.
1 . image
Later(sau đó)
2 . image
Later(sau đó)
Note: The indicator can create up to 40 trading pairs, so traders should choose a super nice signal to enter orders.
-----------------------------------------------------Vietnamese-------------------------------------------------------
👉Xin chào các nhà giao dịch VietNam.
xin giới thiệu Bot "RSI-Tất cả trong một " bao gồm các chức năng:
+ Tự động quét phân kì RSI
+ Tự động quét đường xu hướng RSI
+ Tạo cảnh báo khi có tín hiệu vàng(RSI tạo phân kì và sau đó phá vỡ đường xu hướng của nó báo hiệu đảo chiều xu hướng)
Diễn giải:
- Trong quá trình giao dịch khi dùng chỉ báo "RSI - trendlines - div " trong thư viện của tôi trên trang TW . Tôi có ý tưởng tạo chỉ báo Bot về " Tự động quét phân kì và đường xu hướng của RSI ". Vì đó là những điểm mạnh hàng đầu khi nhà giao dịch sử dụng chỉ báo RSI để dự báo đảo chiều xu hướng.
- Trên mỗi biểu đồ của cặp giao dịch, chỉ báo RSI vẽ cặp trendline là: trendline tăng và trendline giảm (gần với RSI nhất)
- Vì vậy khi thống kê trên " Bot " cũng hiển thị cột của RSI trendlines tăng và cột của RSI trendlines giảm
- Cột |════🡹\n\ʀꜱɪ| - là trendline RSI bên trên
- Cột |ʀꜱɪ\n\════🡻|- là trendline RSI bên dưới
- Khi RSI phá đường xu hướng bên trên thì nó hiển thị là "🡹", nếu là cây nến đầu tiên thì tại cột |════🡹\n\ʀꜱɪ| nó hiển thị là "🡹1|1|1" ô đổi màu xanh , đó là tín hiệu RSI phá vỡ đường kháng cự của nó để đi lên , chờ nến đóng cửa ta có thể vào lệnh "Buy/Long"
- Khi đường RSI phá đường xu hướng bên dưới thì nó hiển thị là "🡻", nếu là cây nến đầu tiên thì tại cột |ʀꜱɪ\n\════🡻| nó hiển thị là "🡻1|1|1" ô đổi màu đỏ , đó là tín hiệu RSI phá vỡ đường hỗ trợ để xuống tiếp , chờ nến đóng cửa ta có thể vào lệnh "Sell/Short "
-Khi RSI tiến gần đến 1 đường trendline bất kì của nó mà tỉ lệ còn 10% thì:
+ tại cột |✎\n\𝖙.𝖑𝖎𝖓𝖊| chữ số tô màu đỏ (trend giảm)
+ tại cột |𝖙.𝖑𝖎𝖓𝖊\n\✐| chữ số tô màu xanh (trend tăng)
Là giá trị của đường trendline RSI để trader chú ý hơn khi đó có thể là điểm vào lệnh và thoát lệnh theo tính chất kháng cự hỗ trợ của RSI trendlines.
-Thông số khi phá vỡ hiển thị 10|10|10 thì hiểu là RSI đã phá vỡ 10 nến(nến RSI), và 10 nến đầu tiên được tô màu xanh(tăng giá) màu đỏ (giảm giá) sau đó được ẩn(có thể thay đổi trong cài đặt). Ngoài ra khi hiện thông số của ô như trên thì cột |✎\n\𝖙.𝖑𝖎𝖓𝖊| và |𝖙.𝖑𝖎𝖓𝖊\n\✐| sẽ hiển thị được số phần trăm tính từ khi điểm RSI phá vỡ đến RSI hiện tại(đóng cửa)
Cột |𝚍𝚒𝚟| là tín hiệu phân kì . Khi giá tạo đỉnh mới, đáy mới mà RSI báo tín hiệu là phân kì thì nó sẽ bắt đầu cơ số đếm từ số 1 tăng dần lên.Từ đây Trader sẽ biết được cặp giao dịch nào đang bắt đầu phân kì RSI. Ô màu xanh là phân kì tăng, ô màu đỏ là phân kì giảm
- Cột| 🆁🆂🅸 | là RSI hiện tại .{🟢} RSI trên mây , {🔴} RSI dưới mây , {⚪️} RSI trong mây(Mây của RSI cũng cho biết rất tốt vùng hỗ trợ, kháng cự của RSI)
- Có 5 chức năng cảnh báo trên chỉ báo này
- Thông số {20:2} là độ dài đường trendline RSI và kết hợp cùng thông số với chỉ báo "RSI - trendlines - div{vn}" khi phân tích
💥 Tổng kết:
Các phương pháp giao dịch với chỉ báo này:
+ Giao dịch khi có phân kì.
+ Giao dịch khi RSI tiếp cận đến đường xu hướng của nó(nó là đường hỗ trợ, kháng cự của RSI).
+ Giao dịch khi RSI phá vỡ đường xu hướng(trên hoặc dưới cách dứt khoát).
+ Giao dịch khi có phân kì sau đó qua vài nến, RSI phá vỡ qua đường xu hướng của nó báo hiệu tín hiệu vàng.
Lưu ý : Chỉ báo tạo được tối đa 40 cặp giao dịch, nên AE trader Việt cứ chọn tín hiệu siêu đẹp để vào lệnh nhé.

RSI + BB + RSI Advanced MTF Panel//@version=6
indicator(title="RSI + BB + RSI Advanced MTF Panel", shorttitle="RSI + BB + RSI Advance MTF Panel", format=format.price, precision=2, overlay=false)
bb_group = "BB (Price Overlay)"
bb_length = input.int(50, minval=1, group = bb_group)
bb_maType = input.string("SMA", "Basis MA Type", options = , group = bb_group)
bb_src = input.source(close, title="Source", group = bb_group)
bb_mult = input.float(0.2, minval=0.001, maxval=50, title="StdDev", group = bb_group)
BasisColor = input.color(color.rgb(163, 41, 245), "Basis Color", group = bb_group, display = display.none)
UpperColor = input.color(color.rgb(120, 156, 202,100), "Upper Color", group = bb_group, display = display.none)
LowerColor = input.color(color.rgb(120, 156, 202,100), "Lower Color", group = bb_group, display = display.none)
offset = input.int(0, "Offset", minval = -500, maxval = 500, display = display.data_window, group = bb_group)
ma(source, bb_length, _type) =>
switch _type
"SMA" => ta.sma(source, bb_length)
"EMA" => ta.ema(source, bb_length)
"SMMA (RMA)" => ta.rma(source, bb_length)
"WMA" => ta.wma(source, bb_length)
"VWMA" => ta.vwma(source, bb_length)
basis = ma(bb_src, bb_length, bb_maType)
dev = bb_mult * ta.stdev(bb_src, bb_length)
upper = basis + dev
lower = basis - dev
plot(basis, "Basis", color=BasisColor, offset = offset, force_overlay = true)
p1 = plot(upper, "Upper", color=UpperColor, offset = offset, force_overlay = true)
p2 = plot(lower, "Lower", color=LowerColor, offset = offset, force_overlay = true)
fill(p1, p2, title = "Background", color=color.rgb(163, 41, 245, 90))
rsiLengthInput = input.int(30, minval=1, title="RSI Length", group="RSI Settings")
rsiSourceInput = input.source(close, "Source", group="RSI Settings")
calculateDivergence = input.bool(false, title="Calculate Divergence", group="RSI Settings", display = display.data_window, tooltip = "Calculating divergences is needed in order for divergence alerts to fire.")
SignalDot = input.bool(false, title="Signal Dot", group="Smoothing", display = display.data_window, tooltip = "Signal for possible entry")
change = ta.change(rsiSourceInput)
up = ta.rma(math.max(change, 0), rsiLengthInput)
down = ta.rma(-math.min(change, 0), rsiLengthInput)
rsi = down == 0 ? 100 : up == 0 ? 0 : 100 - (100 / (1 + up / down))
rsiPlot = plot(rsi, "RSI", color= rsi >= 51 ? color.rgb(13, 197, 230) : color.red)
rsiUpperBand = hline(70, "RSI Upper Band", color=#787B86)
midline = hline(50, "RSI Middle Band", color=color.new(#787B86, 50))
rsiLowerBand = hline(30, "RSI Lower Band", color=#787B86)
fill(rsiUpperBand, rsiLowerBand, color=color.rgb(126, 87, 194, 90), title="RSI Background Fill")
midLinePlot = plot(50, color = na, editable = false, display = display.none)
fill(rsiPlot, midLinePlot, 100, 70, top_color = color.new(color.green, 0), bottom_color = color.new(color.green, 100), title = "Overbought Gradient Fill")
fill(rsiPlot, midLinePlot, 30, 0, top_color = color.new(color.red, 100), bottom_color = color.new(color.red, 0), title = "Oversold Gradient Fill")
GRP = "Smoothing"
TT_BB = "Only applies when 'SMA + Bollinger Bands' is selected. Determines the distance between the SMA and the bands."
maTypeInput = input.string("SMA", "Type", options = , group = GRP, display = display.data_window)
maLengthInput = input.int(14, "Length", group = GRP, display = display.data_window)
bbMultInput = input.float(2.0, "BB StdDev", minval = 0.001, maxval = 50, step = 0.5, tooltip = TT_BB, group = GRP, display = display.data_window)
var enableMA = maTypeInput != "None"
var isBB = maTypeInput == "SMA + Bollinger Bands"
smoothma(source, length, MAtype) =>
switch MAtype
"SMA" => ta.sma(source, length)
"SMA + Bollinger Bands" => ta.sma(source, length)
"EMA" => ta.ema(source, length)
"SMMA (RMA)" => ta.rma(source, length)
"WMA" => ta.wma(source, length)
"VWMA" => ta.vwma(source, length)
smoothingMA = enableMA ? smoothma(rsi, maLengthInput, maTypeInput) : na
smoothingStDev = isBB ? ta.stdev(rsi, maLengthInput) * bbMultInput : na
plot(smoothingMA, "RSI-based MA", color=color.yellow, display = enableMA ? display.all : display.none, editable = enableMA)
bbUpperBand = plot(smoothingMA + smoothingStDev, title = "Upper Bollinger Band", color=color.green, display = isBB ? display.all : display.none, editable = isBB)
bbLowerBand = plot(smoothingMA - smoothingStDev, title = "Lower Bollinger Band", color=color.green, display = isBB ? display.all : display.none, editable = isBB)
fill(bbUpperBand, bbLowerBand, color= isBB ? color.new(color.green, 90) : na, title="Bollinger Bands Background Fill", display = isBB ? display.all : display.none, editable = isBB)
lookbackRight = 5
lookbackLeft = 5
rangeUpper = 60
rangeLower = 5
bearColor = color.red
bullColor = color.green
textColor = color.white
noneColor = color.new(color.white, 100)
_calcBarsSince(cond) =>
ta.barssince(cond)
rsiLBR = rsi
// 1. Calculate Pivots Unconditionally
plFound = not na(ta.pivotlow(rsi, lookbackLeft, lookbackRight))
phFound = not na(ta.pivothigh(rsi, lookbackLeft, lookbackRight))
// 2. Calculate History Unconditionally
barsSincePL = _calcBarsSince(plFound )
barsSincePH = _calcBarsSince(phFound )
// 3. Check Ranges Unconditionally
inRangePL = rangeLower <= barsSincePL and barsSincePL <= rangeUpper
inRangePH = rangeLower <= barsSincePH and barsSincePH <= rangeUpper
// 4. Calculate Conditions
var bool bullCond = false
var bool bearCond = false
if calculateDivergence
rsiHL = rsiLBR > ta.valuewhen(plFound, rsiLBR, 1) and inRangePL
lowLBR = low
priceLL = lowLBR < ta.valuewhen(plFound, lowLBR, 1)
bullCond := priceLL and rsiHL and plFound
rsiLH = rsiLBR < ta.valuewhen(phFound, rsiLBR, 1) and inRangePH
highLBR = high
priceHH = highLBR > ta.valuewhen(phFound, highLBR, 1)
bearCond := priceHH and rsiLH and phFound
else
bullCond := false
bearCond := false
plot(plFound ? rsiLBR : na, offset = -lookbackRight, title = "Regular Bullish", linewidth = 2, color = (bullCond ? bullColor : noneColor), display = display.pane, editable = calculateDivergence)
plotshape(bullCond ? rsiLBR : na, offset = -lookbackRight, title = "Regular Bullish Label", text = " Bull ", style = shape.labelup, location = location.absolute, color = bullColor, textcolor = textColor, display = display.pane, editable = calculateDivergence)
plot(phFound ? rsiLBR : na, offset = -lookbackRight, title = "Regular Bearish", linewidth = 2, color = (bearCond ? bearColor : noneColor), display = display.pane, editable = calculateDivergence)
plotshape(bearCond ? rsiLBR : na, offset = -lookbackRight, title = "Regular Bearish Label", text = " Bear ", style = shape.labeldown, location = location.absolute, color = bearColor, textcolor = textColor, display = display.pane, editable = calculateDivergence)
alertcondition(bullCond, title='Regular Bullish Divergence', message="Found a new Regular Bullish Divergence.")
alertcondition(bearCond, title='Regular Bearish Divergence', message='Found a new Regular Bearish Divergence.')
// --- Panel Options (General) ---
g_panel = 'MTF Panel Options'
i_orientation = input.string('Vertical', 'Orientation', options = , group = g_panel)
i_position = input.string('Bottom Right', 'Position', options = , group = g_panel)
i_border_width = input.int(1, 'Border Width', minval = 0, maxval = 10, group = g_panel, inline = 'border')
i_color_border = input.color(#000000, '', group = g_panel, inline = 'border')
i_showHeaders = input.bool(true, 'Show Headers', group = g_panel)
i_color_header_bg = input.color(#5d606b, 'Headers Background', group = g_panel, inline = 'header')
i_color_header_text = input.color(color.white, 'Text', group = g_panel, inline = 'header')
i_color_tf_bg = input.color(#2a2e39, 'Timeframe Background', group = g_panel, inline = 'tf')
i_color_tf_text = input.color(color.white, 'Text', group = g_panel, inline = 'tf')
i_debug = input.bool(false, 'Display colors palette (debug)', group = g_panel)
// --- RSI Colors (Conditional Formatting) ---
g_rsi = 'MTF RSI Colors'
i_threshold_ob = input.int(70, 'Overbought Threshold', minval=51, maxval=100, group = g_rsi)
i_color_ob = input.color(#128416, 'Overbought Background', inline = 'ob', group = g_rsi)
i_tcolor_ob = input.color(color.white, 'Text', inline = 'ob', group = g_rsi)
i_threshold_uptrend = input.int(60, 'Uptrend Threshold', minval=51, maxval=100, group = g_rsi)
i_color_uptrend = input.color(#2d472e, 'Uptrend Background', inline = 'up', group = g_rsi)
i_tcolor_uptrend = input.color(color.white, 'Text', inline = 'up', group = g_rsi)
i_color_mid = input.color(#131722, 'No Trend Background', group = g_rsi, inline = 'mid')
i_tcolor_mid = input.color(#b2b5be, 'Text', group = g_rsi, inline = 'mid')
i_threshold_downtrend = input.int(40, 'Downtrend Threshold', group = g_rsi, minval=0, maxval=49)
i_color_downtrend = input.color(#5b2e2e, 'Downtrend Background', group = g_rsi, inline = 'down')
i_tcolor_downtrend = input.color(color.white, 'Text', group = g_rsi, inline = 'down')
i_threshold_os = input.int(30, 'Oversold Threshold', minval=0, maxval=49, group = g_rsi)
i_color_os = input.color(#db3240, 'Oversold Background', group = g_rsi, inline = 'os')
i_tcolor_os = input.color(color.white, 'Text', group = g_rsi, inline = 'os')
// --- Individual RSI Settings (MTF Sources) ---
g_rsi1 = 'RSI #1'
i_rsi1_enabled = input.bool(true, title = 'Enabled', group = g_rsi1)
i_rsi1_tf = input.timeframe('5', 'Timeframe', group = g_rsi1)
i_rsi1_len = input.int(30, 'Length', minval = 1, group = g_rsi1)
i_rsi1_src = input.source(close, 'Source', group = g_rsi1) * 10000
v_rsi1 = i_rsi1_enabled ? request.security(syminfo.tickerid, i_rsi1_tf, ta.rsi(i_rsi1_src, i_rsi1_len)) : na
g_rsi2 = 'RSI #2'
i_rsi2_enabled = input.bool(true, title = 'Enabled', group = g_rsi2)
i_rsi2_tf = input.timeframe('15', 'Timeframe', group = g_rsi2)
i_rsi2_len = input.int(30, 'Length', minval = 1, group = g_rsi2)
i_rsi2_src = input.source(close, 'Source', group = g_rsi2) * 10000
v_rsi2 = i_rsi2_enabled ? request.security(syminfo.tickerid, i_rsi2_tf, ta.rsi(i_rsi2_src, i_rsi2_len)) : na
g_rsi3 = 'RSI #3'
i_rsi3_enabled = input.bool(true, title = 'Enabled', group = g_rsi3)
i_rsi3_tf = input.timeframe('60', 'Timeframe', group = g_rsi3)
i_rsi3_len = input.int(30, 'Length', minval = 1, group = g_rsi3)
i_rsi3_src = input.source(close, 'Source', group = g_rsi3) * 10000
v_rsi3 = i_rsi3_enabled ? request.security(syminfo.tickerid, i_rsi3_tf, ta.rsi(i_rsi3_src, i_rsi3_len)) : na
g_rsi4 = 'RSI #4'
i_rsi4_enabled = input.bool(true, title = 'Enabled', group = g_rsi4)
i_rsi4_tf = input.timeframe('240', 'Timeframe', group = g_rsi4)
i_rsi4_len = input.int(30, 'Length', minval = 1, group = g_rsi4)
i_rsi4_src = input.source(close, 'Source', group = g_rsi4) * 10000
v_rsi4 = i_rsi4_enabled ? request.security(syminfo.tickerid, i_rsi4_tf, ta.rsi(i_rsi4_src, i_rsi4_len)) : na
g_rsi5 = 'RSI #5'
i_rsi5_enabled = input.bool(true, title = 'Enabled', group = g_rsi5)
i_rsi5_tf = input.timeframe('D', 'Timeframe', group = g_rsi5)
i_rsi5_len = input.int(30, 'Length', minval = 1, group = g_rsi5)
i_rsi5_src = input.source(close, 'Source', group = g_rsi5) * 10000
v_rsi5 = i_rsi5_enabled ? request.security(syminfo.tickerid, i_rsi5_tf, ta.rsi(i_rsi5_src, i_rsi5_len)) : na
g_rsi6 = 'RSI #6'
i_rsi6_enabled = input.bool(true, title = 'Enabled', group = g_rsi6)
i_rsi6_tf = input.timeframe('W', 'Timeframe', group = g_rsi6)
i_rsi6_len = input.int(30, 'Length', minval = 1, group = g_rsi6)
i_rsi6_src = input.source(close, 'Source', group = g_rsi6) * 10000
v_rsi6 = i_rsi6_enabled ? request.security(syminfo.tickerid, i_rsi6_tf, ta.rsi(i_rsi6_src, i_rsi6_len)) : na
g_rsi7 = 'RSI #7'
i_rsi7_enabled = input.bool(false, title = 'Enabled', group = g_rsi7)
i_rsi7_tf = input.timeframe('W', 'Timeframe', group = g_rsi7)
i_rsi7_len = input.int(30, 'Length', minval = 1, group = g_rsi7)
i_rsi7_src = input.source(close, 'Source', group = g_rsi7) * 10000
v_rsi7 = i_rsi7_enabled ? request.security(syminfo.tickerid, i_rsi7_tf, ta.rsi(i_rsi7_src, i_rsi7_len)) : na
g_rsi8 = 'RSI #8'
i_rsi8_enabled = input.bool(false, title = 'Enabled', group = g_rsi8)
i_rsi8_tf = input.timeframe('W', 'Timeframe', group = g_rsi8)
i_rsi8_len = input.int(30, 'Length', minval = 1, group = g_rsi8)
i_rsi8_src = input.source(close, 'Source', group = g_rsi8) * 10000
v_rsi8 = i_rsi8_enabled ? request.security(syminfo.tickerid, i_rsi8_tf, ta.rsi(i_rsi8_src, i_rsi8_len)) : na
g_rsi9 = 'RSI #9'
i_rsi9_enabled = input.bool(false, title = 'Enabled', group = g_rsi9)
i_rsi9_tf = input.timeframe('W', 'Timeframe', group = g_rsi9)
i_rsi9_len = input.int(30, 'Length', minval = 1, group = g_rsi9)
i_rsi9_src = input.source(close, 'Source', group = g_rsi9) * 10000
v_rsi9 = i_rsi9_enabled ? request.security(syminfo.tickerid, i_rsi9_tf, ta.rsi(i_rsi9_src, i_rsi9_len)) : na
g_rsi10 = 'RSI #10'
i_rsi10_enabled = input.bool(false, title = 'Enabled', group = g_rsi10)
i_rsi10_tf = input.timeframe('W', 'Timeframe', group = g_rsi10)
i_rsi10_len = input.int(30, 'Length', minval = 1, group = g_rsi10)
i_rsi10_src = input.source(close, 'Source', group = g_rsi10) * 10000
v_rsi10 = i_rsi10_enabled ? request.security(syminfo.tickerid, i_rsi10_tf, ta.rsi(i_rsi10_src, i_rsi10_len)) : na
// --- Panel Helper Functions ---
// Function 4: String Position to Constant (Indentation cleaned)
f_StrPositionToConst(_p) =>
switch _p
'Top Left' => position.top_left
'Top Right' => position.top_right
'Top Center' => position.top_center
'Middle Left' => position.middle_left
'Middle Right' => position.middle_right
'Middle Center' => position.middle_center
'Bottom Left' => position.bottom_left
'Bottom Right' => position.bottom_right
'Bottom Center' => position.bottom_center
=> position.bottom_right
// Function 5: Timeframe to Human Readable (Indentation cleaned)
f_timeframeToHuman(_tf) =>
seconds = timeframe.in_seconds(_tf)
if seconds < 60
_tf
else if seconds < 3600
str.tostring(seconds / 60) + 'm'
else if seconds < 86400
str.tostring(seconds / 60 / 60) + 'h'
else
switch _tf
"1D" => "D"
"1W" => "W"
"1M" => "M"
=> str.tostring(_tf)
type TPanel
table src = na
bool vertical_orientation = true
int row = 0
int col = 0
// Method 1: Increment Column (Indentation cleaned)
method incCol(TPanel _panel) =>
if _panel.vertical_orientation
_panel.col += 1
else
_panel.row += 1
// Method 2: Increment Row (Indentation cleaned)
method incRow(TPanel _panel) =>
if not _panel.vertical_orientation
_panel.col += 1
_panel.row := 0
else
_panel.row += 1
_panel.col := 0
// Method 3: Add Cell (Indentation cleaned)
method add(TPanel _panel, string _v1, color _bg1, color _ctext1, string _v2, color _bg2, color _ctext2) =>
table.cell(_panel.src, _panel.col, _panel.row, _v1, text_color = _ctext1, bgcolor = _bg1)
_panel.incCol()
table.cell(_panel.src, _panel.col, _panel.row, _v2, text_color = _ctext2, bgcolor = _bg2)
_panel.incRow()
// Function 6: Background Color
f_bg(_rsi) =>
c_line = na(_rsi) ? i_color_mid :
_rsi >= i_threshold_ob ? i_color_ob :
_rsi >= i_threshold_uptrend ? i_color_uptrend :
_rsi <= i_threshold_os ? i_color_os :
_rsi <= i_threshold_downtrend ? i_color_downtrend :
i_color_mid
// Function 7: Text Color
f_rsi_text_color(_rsi) =>
c_line = na(_rsi) ? i_tcolor_mid :
_rsi >= i_threshold_ob ? i_tcolor_ob :
_rsi >= i_threshold_uptrend ? i_tcolor_uptrend :
_rsi <= i_threshold_os ? i_tcolor_os :
_rsi <= i_threshold_downtrend ? i_tcolor_downtrend :
i_tcolor_mid
f_formatRsi(_rsi) => na(_rsi) ? 'N/A' : str.tostring(_rsi, '0.00')
// --- Panel Execution Logic ---
if barstate.islast
v_panel = TPanel.new(vertical_orientation = i_orientation == 'Vertical')
v_max_rows = 20
v_panel.src := table.new(f_StrPositionToConst(i_position), v_max_rows, v_max_rows, border_width = i_border_width, border_color = i_color_border)
if i_showHeaders
v_panel.add('TF', i_color_header_bg, i_color_header_text, 'RSI', i_color_header_bg, i_color_header_text)
if i_rsi1_enabled
v_panel.add(f_timeframeToHuman(i_rsi1_tf), i_color_tf_bg, i_color_tf_text, f_formatRsi(v_rsi1), f_bg(v_rsi1), f_rsi_text_color(v_rsi1))
if i_rsi2_enabled
v_panel.add(f_timeframeToHuman(i_rsi2_tf), i_color_tf_bg, i_color_tf_text, f_formatRsi(v_rsi2), f_bg(v_rsi2), f_rsi_text_color(v_rsi2))
if i_rsi3_enabled
v_panel.add(f_timeframeToHuman(i_rsi3_tf), i_color_tf_bg, i_color_tf_text, f_formatRsi(v_rsi3), f_bg(v_rsi3), f_rsi_text_color(v_rsi3))
if i_rsi4_enabled
v_panel.add(f_timeframeToHuman(i_rsi4_tf), i_color_tf_bg, i_color_tf_text, f_formatRsi(v_rsi4), f_bg(v_rsi4), f_rsi_text_color(v_rsi4))
if i_rsi5_enabled
v_panel.add(f_timeframeToHuman(i_rsi5_tf), i_color_tf_bg, i_color_tf_text, f_formatRsi(v_rsi5), f_bg(v_rsi5), f_rsi_text_color(v_rsi5))
if i_rsi6_enabled
v_panel.add(f_timeframeToHuman(i_rsi6_tf), i_color_tf_bg, i_color_tf_text, f_formatRsi(v_rsi6), f_bg(v_rsi6), f_rsi_text_color(v_rsi6))
if i_rsi7_enabled
v_panel.add(f_timeframeToHuman(i_rsi7_tf), i_color_tf_bg, i_color_tf_text, f_formatRsi(v_rsi7), f_bg(v_rsi7), f_rsi_text_color(v_rsi7))
if i_rsi8_enabled
v_panel.add(f_timeframeToHuman(i_rsi8_tf), i_color_tf_bg, i_color_tf_text, f_formatRsi(v_rsi8), f_bg(v_rsi8), f_rsi_text_color(v_rsi8))
if i_rsi9_enabled
v_panel.add(f_timeframeToHuman(i_rsi9_tf), i_color_tf_bg, i_color_tf_text, f_formatRsi(v_rsi9), f_bg(v_rsi9), f_rsi_text_color(v_rsi9))
if i_rsi10_enabled
v_panel.add(f_timeframeToHuman(i_rsi10_tf), i_color_tf_bg, i_color_tf_text, f_formatRsi(v_rsi10), f_bg(v_rsi10), f_rsi_text_color(v_rsi10))
if i_debug
t = table.new(position.middle_center, 21, 20, border_width = i_border_width, border_color = i_color_border)
v_panel2 = TPanel.new(t, vertical_orientation = i_orientation == 'Vertical')
v_panel2.add('Debug', i_color_header_bg, i_color_header_text, 'Colors', i_color_header_bg, i_color_header_text)
// Using a tuple array for debugging colors demo
// Final Syntax Correction: Use array.new() and array.set() to avoid 'tuple()' function reference error
v_rows = 5 // We know we have 5 elements
demo = array.new(v_rows, '') // Initialize array with 5 string elements, will hold string representation of the tuple
// We will push the elements as a *string* representation of the tuple, as Pine v6 allows
// and then parse them inside the loop if necessary.
// To preserve the structure (string, float) without the tuple() function:
// We must define two separate arrays if the 'tuple' function is truly unavailable.
tf_array = array.new(v_rows)
rsi_array = array.new(v_rows)
// Populate the arrays
array.set(tf_array, 0, 'Overbought')
array.set(rsi_array, 0, float(i_threshold_ob))
array.set(tf_array, 1, 'Uptrend')
array.set(rsi_array, 1, float(i_threshold_uptrend))
array.set(tf_array, 2, 'No Trend')
array.set(rsi_array, 2, 50.0)
array.set(tf_array, 3, 'Downtrend')
array.set(rsi_array, 3, float(i_threshold_downtrend))
array.set(tf_array, 4, 'Oversold')
array.set(rsi_array, 4, float(i_threshold_os))
// Iterate over the arrays using a simple index
for i = 0 to v_rows - 1
tf = array.get(tf_array, i)
rsi = array.get(rsi_array, i)
v_panel2.add(tf, i_color_tf_bg, i_color_tf_text, f_formatRsi(rsi), f_bg(rsi), f_rsi_text_color(rsi))

RSI adaptive zones [AdaptiveRSI]This script introduces a unified mathematical framework that auto-scales oversold/overbought and support/resistance zones for any period length. It also adds true RSI candles for spotting intrabar signals.
Built on the Logit RSI foundation, this indicator converts RSI into a statistically normalized space, allowing all RSI lengths to share the same mathematical footing.
What was once based on experience and observation is now grounded in math.
✦ ✦ ✦ ✦ ✦
💡 Example Use Cases
RSI(14): Classic overbought/oversold signals + divergence
Support in an uptrend using RSI(14)
Range breakouts using RSI(21)
Short-term pullbacks using RSI(5)
✦ ✦ ✦ ✦ ✦
THE PAST: RSI Interpretation Required Multiple Rulebooks
Over decades, RSI practitioners discovered that RSI behaves differently depending on trend and lookback length:
• In uptrends, RSI tends to hold higher support zones (40–50)
• In downtrends, RSI tends to resist below 50–60
• Short RSIs (e.g., RSI(2)) require far more extreme threshold values
• Longer RSIs cluster near the center and rarely reach 70/30
These observations were correct — but lacked a unifying mathematical explanation.
✦ ✦ ✦ ✦ ✦
THE PRESENT: One Framework Handles RSI(2) to RSI(200)
Instead of using fixed thresholds (70/30, 90/10, etc.), this indicator maps RSI into a normalized statistical space using:
• The Logit transformation to remove 0–100 scale distortion
• A universal scaling based on 2/√(n−1) scaling factor to equalize distribution shapes
As a result, RSI values become directly comparable across all lookback periods.
✦ ✦ ✦ ✦ ✦
💡 How the Adaptive Zones Are Calculated
The adaptive framework defines RSI zones as statistical regimes derived from the Logit-transformed RSI .
Each boundary corresponds to a standard deviation (σ) threshold, scaled by 2/√(n−1), making RSI distributions comparable across periods.
This structure was inspired by Nassim Nicholas Taleb’s body–shoulders–tails regime model:
Body (±0.66σ) — consolidation / equilibrium
Shoulders (±1σ to ±2.14σ) — trending region
Tails (outside of ±2.14σ) — rare, high-volatility behavior
Transitions between these regimes are defined by the derivatives of the position (CDF) function :
• ±1σ → shift from consolidation to trend
• ±√3σ → shift from trend to exhaustion
Adaptive Zone Summary
Consolidation: −0.66σ to +0.66σ
Support/Resistance: ±0.66σ to ±1σ
Uptrend/Downtrend: ±1σ to ±√3σ
Overbought/Oversold: ±√3σ to ±2.14σ
Tails: outside of ±2.14σ
✦ ✦ ✦ ✦ ✦
📌 Inverse Transformation: From σ-Space Back to RSI
A final step is required to return these statistically normalized boundaries back into the familiar 0–100 RSI scale. Because the Logit transform maps RSI into an unbounded real-number domain, the inverse operation uses the hyperbolic tangent function to compress σ-space back into the bounded RSI range.
RSI(n) = 50 + 50 · tanh(z / √(n − 1))
The result is a smooth, mathematically consistent conversion where the same statistical thresholds maintain identical meaning across all RSI lengths, while still expressing themselves as intuitive RSI values traders already understand.
✦ ✦ ✦ ✦ ✦
Key Features
Mathematically derived adaptive zones for any RSI period
Support/resistance zone identification for trend-aligned reversals
Optional OHLC RSI bars/candles for intrabar zone interactions
Fully customizable zone visibility and colors
Statistically consistent interpretation across all markets and timeframes
Inputs
RSI Length — core parameter controlling zone scaling
RSI Display : Line / Bar / Candle visualization modes
✦ ✦ ✦ ✦ ✦
💡 How to Use
This indicator is a framework , not a binary signal generator.
Start by defining the question you want answered, e.g.:
• Where is the breakout?
• Is price overextended or still trending?
• Is the correction ending, or is trend reversing?
Then:
Choose the RSI length that matches your timeframe
Observe which adaptive zone price is interacting with
Interpret market behavior accordingly
Example: Long-Term Trend Assesment using RSI(200)
A trader may ask: "Is this a long term top?"
Unlikely, because RSI(200) holds above Resistance zone , therefore the trend remains strong.
✦ ✦ ✦ ✦ ✦
👉 Practical tip:
If you used to overlay weekly RSI(14) on a daily chart (getting a line that waits 5 sessions to recalculate), you can now read the same long-horizon state continuously : set RSI(70) on the daily chart (~14 weeks × 5 days/week = 70 days) and let the adaptive zones update every bar .
Note: It won’t be numerically identical to the weekly RSI due to lookback period used, but it tracks the same regime on a standardized scale with bar-by-bar updates.
✦ ✦ ✦ ✦ ✦
Note: This framework describes statistical structure, not prediction. Use as part of a complete trading approach. Past behavior does not guarantee future outcomes.
framework ≠ guaranteed signal
---
Attribution & License
This indicator incorporates:
• Logit transformation of RSI
• Variance scaling using 2/√(n−1)
• Zone placement derived from Taleb’s body–shoulders–tails regime model and CDF derivatives
• Inverse TANH(z) transform for mapping z-scores back into bounded RSI space
Released under CC BY-NC-SA 4.0 — free for non-commercial use with credit.
© AdaptiveRSI

RSI Donchian Channel [DCAUT]█ RSI Donchian Channel
📊 ORIGINALITY & INNOVATION
The RSI Donchian Channel represents an important synthesis of two complementary analytical frameworks: momentum oscillators and breakout detection systems. This indicator addresses a common limitation in traditional RSI analysis by replacing fixed overbought/oversold thresholds with adaptive zones derived from historical RSI extremes.
Key Enhancement:
Traditional RSI analysis relies on static threshold levels (typically 30/70), which may not adequately reflect changing market volatility regimes. This indicator adapts the reference zones dynamically based on the actual RSI behavior over the lookback period, helping traders identify meaningful momentum extremes relative to recent price action rather than arbitrary fixed levels.
The implementation combines the proven momentum measurement capabilities of RSI with Donchian Channel's breakout detection methodology, creating a framework that identifies both momentum exhaustion points and potential continuation signals through the same analytical lens.
📐 MATHEMATICAL FOUNDATION
Core Calculation Process:
Step 1: RSI Calculation
The Relative Strength Index measures momentum by comparing the magnitude of recent gains to recent losses:
Calculate price changes between consecutive periods
Separate positive changes (gains) from negative changes (losses)
Apply selected smoothing method (RMA standard, also supports SMA, EMA, WMA) to both gain and loss series
Compute Relative Strength (RS) as the ratio of smoothed gains to smoothed losses
Transform RS into bounded 0-100 scale using the formula: RSI = 100 - (100 / (1 + RS))
Step 2: Donchian Channel Application
The Donchian Channel identifies the highest and lowest RSI values within the specified lookback period:
Upper Channel: Highest RSI value over the lookback period, represents the recent momentum peak
Lower Channel: Lowest RSI value over the lookback period, represents the recent momentum trough
Middle Channel (Basis): Average of upper and lower channels, serves as equilibrium reference
Channel Width Dynamics:
The distance between upper and lower channels reflects RSI volatility. Wide channels indicate high momentum variability, while narrow channels suggest momentum consolidation and potential breakout preparation. The indicator monitors channel width over a 100-period window to identify squeeze conditions that often precede significant momentum shifts.
📊 COMPREHENSIVE SIGNAL ANALYSIS
Primary Signal Categories:
Breakout Signals:
Upper Breakout: RSI crosses above the upper channel, indicates momentum reaching new relative highs and potential trend continuation, particularly significant when accompanied by price confirmation
Lower Breakout: RSI crosses below the lower channel, suggests momentum reaching new relative lows and potential trend exhaustion or reversal setup
Breakout strength is enhanced when the channel is narrow prior to the breakout, indicating a transition from consolidation to directional movement
Mean Reversion Signals:
Upper Touch Without Breakout: RSI reaches the upper channel but fails to break through, may indicate momentum exhaustion and potential reversal opportunity
Lower Touch Without Breakout: RSI reaches the lower channel without breakdown, suggests potential bounce as momentum reaches oversold extremes
Return to Basis: RSI moving back toward the middle channel after touching extremes signals momentum normalization
Trend Strength Assessment:
Sustained Upper Channel Riding: RSI consistently remains near or above the upper channel during strong uptrends, indicates persistent bullish momentum
Sustained Lower Channel Riding: RSI stays near or below the lower channel during strong downtrends, reflects persistent bearish pressure
Basis Line Position: RSI position relative to the middle channel helps identify the prevailing momentum bias
Channel Compression Patterns:
Squeeze Detection: Channel width narrowing to 100-period lows indicates momentum consolidation, often precedes significant directional moves
Expansion Phase: Channel widening after a squeeze confirms the initiation of a new momentum regime
Persistent Narrow Channels: Extended periods of tight channels suggest market indecision and accumulation/distribution phases
🎯 STRATEGIC APPLICATIONS
Trend Continuation Strategy:
This approach focuses on identifying and trading momentum breakouts that confirm established trends:
Identify the prevailing price trend using higher timeframe analysis or trend-following indicators
Wait for RSI to break above the upper channel in uptrends (or below the lower channel in downtrends)
Enter positions in the direction of the breakout when price action confirms the momentum shift
Place protective stops below the recent swing low (long positions) or above swing high (short positions)
Target profit levels based on prior swing extremes or use trailing stops to capture extended moves
Exit when RSI crosses back through the basis line in the opposite direction
Mean Reversion Strategy:
This method capitalizes on momentum extremes and subsequent corrections toward equilibrium:
Monitor for RSI reaching the upper or lower channel boundaries
Look for rejection signals (price reversal patterns, volume divergence) when RSI touches the channels
Enter counter-trend positions when RSI begins moving back toward the basis line
Use the basis line as the initial profit target for mean reversion trades
Implement tight stops beyond the channel extremes to limit risk on failed reversals
Scale out of positions as RSI approaches the basis line and closes the position when RSI crosses the basis
Breakout Preparation Strategy:
This approach positions traders ahead of potential volatility expansion from consolidation phases:
Identify squeeze conditions when channel width reaches 100-period lows
Monitor price action for consolidation patterns (triangles, rectangles, flags) during the squeeze
Prepare conditional orders for breakouts in both directions from the consolidation
Enter positions when RSI breaks out of the narrow channel with expanding width
Use the channel width expansion as a confirmation signal for the breakout's validity
Manage risk with stops just inside the opposite channel boundary
Multi-Timeframe Confluence Strategy:
Combining RSI Donchian Channel analysis across multiple timeframes can improve signal reliability:
Identify the primary trend direction using a higher timeframe RSI Donchian Channel (e.g., daily or weekly)
Use a lower timeframe (e.g., 4-hour or hourly) to time precise entry points
Enter long positions when both timeframes show RSI above their respective basis lines
Enter short positions when both timeframes show RSI below their respective basis lines
Avoid trades when timeframes provide conflicting signals (e.g., higher timeframe below basis, lower timeframe above)
Exit when the higher timeframe RSI crosses its basis line in the opposite direction
Risk Management Guidelines:
Effective risk management is essential for all RSI Donchian Channel strategies:
Position Sizing: Calculate position sizes based on the distance between entry point and stop loss, limiting risk to 1-2% of capital per trade
Stop Loss Placement: For breakout trades, place stops just inside the opposite channel boundary; for mean reversion trades, use stops beyond the channel extremes
Profit Targets: Use the basis line as a minimum target for mean reversion trades; for trend trades, target prior swing extremes or use trailing stops
Channel Width Context: Increase position sizes during narrow channels (lower volatility) and reduce sizes during wide channels (higher volatility)
Correlation Awareness: Monitor correlations between traded instruments to avoid over-concentration in similar setups
📋 DETAILED PARAMETER CONFIGURATION
RSI Source:
Defines the price data series used for RSI calculation:
Close (Default): Standard choice providing end-of-period momentum assessment, suitable for most trading styles and timeframes
High-Low Average (HL2): Reduces the impact of closing auction dynamics, useful for markets with significant end-of-day volatility
High-Low-Close Average (HLC3): Provides a more balanced view incorporating the entire period's range
Open-High-Low-Close Average (OHLC4): Offers the most comprehensive price representation, helpful for identifying overall period sentiment
Strategy Consideration: Use Close for end-of-period signals, HL2 or HLC3 for intraday volatility reduction, OHLC4 for capturing full period dynamics
RSI Length:
Controls the number of periods used for RSI calculation:
Short Periods (5-9): Highly responsive to recent price changes, produces more frequent signals with increased false signal risk, suitable for short-term trading and volatile markets
Standard Period (14): Widely accepted default balancing responsiveness with stability, appropriate for swing trading and intermediate-term analysis
Long Periods (21-28): Produces smoother RSI with fewer signals but more reliable trend identification, better for position trading and reducing noise in choppy markets
Optimization Approach: Test different lengths against historical data for your specific market and timeframe, consider using longer periods in ranging markets and shorter periods in trending markets
RSI MA Type:
Determines the smoothing method applied to price changes in RSI calculation:
RMA (Relative Moving Average - Default): Wilder's original smoothing method providing stable momentum measurement with gradual response to changes, maintains consistency with classical RSI interpretation
SMA (Simple Moving Average): Treats all periods equally, responds more quickly to changes than RMA but may produce more whipsaws in volatile conditions
EMA (Exponential Moving Average): Weights recent periods more heavily, increases responsiveness at the cost of potential noise, suitable for traders prioritizing early signal generation
WMA (Weighted Moving Average): Applies linear weighting favoring recent data, offers a middle ground between SMA and EMA responsiveness
Selection Guidance: Maintain RMA for consistency with traditional RSI analysis, use EMA or WMA for more responsive signals in fast-moving markets, apply SMA for maximum simplicity and transparency
DC Length:
Specifies the lookback period for Donchian Channel calculation on RSI values:
Short Periods (10-14): Creates tight channels that adapt quickly to changing momentum conditions, generates more frequent trading signals but increases sensitivity to short-term RSI fluctuations
Standard Period (20): Balances channel responsiveness with stability, aligns with traditional Bollinger Bands and moving average periods, suitable for most trading styles
Long Periods (30-50): Produces wider, more stable channels that better represent sustained momentum extremes, reduces signal frequency while improving reliability, appropriate for position traders and higher timeframes
Calibration Strategy: Match DC length to your trading timeframe (shorter for day trading, longer for swing trading), test channel width behavior during different market regimes, consider using adaptive periods that adjust to volatility conditions
Market Adaptation: Use shorter DC lengths in trending markets to capture momentum shifts earlier, apply longer periods in ranging markets to filter noise and focus on significant extremes
Parameter Combination Recommendations:
Scalping/Day Trading: RSI Length 5-9, DC Length 10-14, EMA or WMA smoothing for maximum responsiveness
Swing Trading: RSI Length 14, DC Length 20, RMA smoothing for balanced analysis (default configuration)
Position Trading: RSI Length 21-28, DC Length 30-50, RMA or SMA smoothing for stable signals
High Volatility Markets: Longer RSI periods (21+) with standard DC length (20) to reduce noise
Low Volatility Markets: Standard RSI length (14) with shorter DC length (10-14) to capture subtle momentum shifts
📈 PERFORMANCE ANALYSIS & COMPETITIVE ADVANTAGES
Adaptive Threshold Mechanism:
Unlike traditional RSI analysis with fixed 30/70 thresholds, this indicator's Donchian Channel approach provides several improvements:
Context-Aware Extremes: Overbought/oversold levels adjust automatically based on recent momentum behavior rather than arbitrary fixed values
Volatility Adaptation: In low volatility periods, channels narrow to reflect tighter momentum ranges; in high volatility, channels widen appropriately
Market Regime Recognition: The indicator implicitly adapts to different market conditions without manual threshold adjustments
False Signal Reduction: Adaptive channels help reduce premature reversal signals that often occur with fixed thresholds during strong trends
Signal Quality Characteristics:
The indicator's dual-purpose design provides distinct advantages for different trading objectives:
Breakout Trading: Channel boundaries offer clear, objective breakout levels that update dynamically, eliminating the ambiguity of when momentum becomes "too high" or "too low"
Mean Reversion: The basis line provides a natural profit target for reversion trades, representing the midpoint of recent momentum extremes
Trend Strength: Persistent channel boundary riding offers an objective measure of trend strength without additional indicators
Consolidation Detection: Channel width analysis provides early warning of potential volatility expansion from compression phases
Comparative Analysis:
When compared to traditional RSI implementations and other momentum frameworks:
vs. Fixed Threshold RSI: Provides market-adaptive reference levels rather than static values, helping to reduce false signals during trending markets where RSI can remain "overbought" or "oversold" for extended periods
vs. RSI Bollinger Bands: Offers clearer breakout signals and more intuitive extreme identification through actual high/low boundaries rather than statistical standard deviations
vs. Stochastic Oscillator: Maintains RSI's momentum measurement advantages (unbounded calculation avoiding scale compression) while adding the breakout detection capabilities of Donchian Channels
vs. Standard Donchian Channels: Applies breakout methodology to momentum space rather than price, providing earlier signals of potential trend changes before price breakouts occur
Performance Characteristics:
The indicator exhibits specific behavioral patterns across different market conditions:
Trending Markets: Excels at identifying momentum continuation through channel breakouts, RSI tends to ride one channel boundary during strong trends, providing trend confirmation
Ranging Markets: Channel width narrows during consolidation, offering early preparation signals for potential breakout trading opportunities
High Volatility: Channels widen to reflect increased momentum variability, automatically adjusting signal sensitivity to match market conditions
Low Volatility: Channels contract, making the indicator more sensitive to subtle momentum shifts that may be significant in calm market environments
Transition Periods: Channel squeezes often precede major trend changes, offering advance warning of potential regime shifts
Limitations and Considerations:
Users should be aware of certain operational characteristics:
Lookback Dependency: Channel boundaries depend entirely on the lookback period, meaning the indicator has no predictive element beyond identifying current momentum relative to recent history
Lag Characteristics: As with all moving average-based indicators, RSI calculation introduces lag, and channel boundaries update only as new extremes occur within the lookback window
Range-Bound Sensitivity: In extremely tight ranges, channels may become very narrow, potentially generating excessive signals from minor momentum fluctuations
Trending Persistence: During very strong trends, RSI may remain at channel extremes for extended periods, requiring patience for mean reversion setups or commitment to trend-following approaches
No Absolute Levels: Unlike traditional RSI, this indicator provides no fixed reference points (like 50), making it less suitable for strategies that depend on absolute momentum readings
USAGE NOTES
This indicator is designed for technical analysis and educational purposes to help traders understand momentum dynamics and identify potential trading opportunities. The RSI Donchian Channel has limitations and should not be used as the sole basis for trading decisions.
Important considerations:
Performance varies significantly across different market conditions, timeframes, and instruments
Historical signal patterns do not guarantee future results, as market behavior continuously evolves
Effective use requires understanding of both RSI momentum principles and Donchian Channel breakout concepts
Risk management practices (stop losses, position sizing, diversification) are essential for any trading application
Consider combining with additional analytical tools such as volume analysis, price action patterns, or trend indicators for confirmation
Backtest thoroughly on your specific instruments and timeframes before live trading implementation
Be aware that optimization on historical data may lead to curve-fitting and poor forward performance
The indicator performs best when used as part of a comprehensive trading methodology that incorporates multiple forms of market analysis, sound risk management, and realistic expectations about win rates and drawdowns.

RSI Zones Background + Optional RSI PaneOverview
This Pine Script indicator does two things at once:
Colors the background of the main price chart whenever the RSI value is below a lower threshold (default 30) or above an upper threshold (default 70). This highlights oversold and overbought zones directly on the price chart itself.
Optionally displays a separate RSI panel with the RSI line and shaded region between the two threshold levels for reference.
The indicator is fully customizable through the settings panel—color choices, transparency, and whether to show the separate RSI pane can all be adjusted.
Key Parts of the Code
1. Inputs
src: The source price series for RSI calculation.
len: RSI lookback length (default 14).
lowerThr and upperThr: The lower and upper thresholds (defaults: 30 and 70).
lowColor and highColor: Colors for the background when RSI is below or above the thresholds.
bgTrans: Transparency level for the background shading.
showRSI: Boolean to toggle the optional RSI pane on or off.
2. RSI Calculation
rsi = ta.rsi(src, len)
This computes the RSI from the chosen price source.
3. Background Coloring on the Price Chart
bgCol = rsi <= lowerThr ? color.new(lowColor,bgTrans) :
rsi >= upperThr ? color.new(highColor,bgTrans) :
na
bgcolor(bgCol)
If RSI ≤ lower threshold: background turns lowColor (oversold zone).
If RSI ≥ upper threshold: background turns highColor (overbought zone).
Otherwise, no background color.
4. Optional RSI Pane
plot(showRSI ? rsi : na, display=display.pane)
Plots the RSI line in a separate pane when showRSI is true; otherwise hides it.
5. Horizontal Lines for Thresholds
hLower = hline(lowerThr, ...)
hUpper = hline(upperThr, ...)
Two horizontal lines at the lower and upper thresholds.
Because hline() can’t be wrapped inside if blocks, the script always creates them but makes them transparent (using na color) when the pane is hidden.
6. Filling Between Threshold Lines
fill(hLower, hUpper, color=showRSI ? color.new(color.gray,95) : na)
When the RSI pane is visible, the area between the two threshold lines is shaded in gray to create a “mid-zone” effect. This fill also switches off (becomes na) if the pane is hidden.
7. Alerts
The script also includes two alert conditions:
When RSI crosses below the lower threshold.
When RSI crosses above the upper threshold.
How It Works in Practice
On the price chart, you’ll see the background turn blue (or your chosen color) when RSI is ≤30, and red when RSI is ≥70.
If you enable “Show RSI” in the settings, a separate RSI pane will appear below the price chart, plotting the RSI line with two threshold lines and a shaded region in between.
You can fully adjust transparency and colors to suit your chart style.
Benefits
Quickly visualize overbought and oversold conditions without opening a separate RSI window.
Optional RSI pane provides context when needed.
Customizable colors and transparency make it easy to integrate with any chart theme.
Alerts give you automatic notifications when RSI crosses key levels.
------------------------------------------------------------------------------------------------------------------
개요
이 지표는 두 가지 기능을 동시에 수행합니다.
가격 차트 뒤 배경에 색상 표시
RSI 값이 설정한 하단 임계값(기본 30) 이하이거나 상단 임계값(기본 70) 이상일 때, 가격 차트 뒤쪽에 과매도·과매수 구간을 색으로 표시해줍니다.
선택적으로 RSI 보조창 표시
옵션을 켜면 별도의 RSI 패널이 나타나서 RSI 라인과 두 임계값(30, 70)을 연결한 구간을 음영 처리하여 보여줍니다.
설정 창에서 색상·투명도·보조창 표시 여부를 전부 조정할 수 있습니다.
코드 핵심 설명
1. 입력값
src: RSI 계산에 사용할 가격 소스(기본 종가).
len: RSI 기간(기본 14).
lowerThr / upperThr: RSI 하단·상단 임계값(기본 30, 70).
lowColor / highColor: RSI가 각각 하단 이하·상단 이상일 때 배경 색상.
bgTrans: 배경 투명도(0=불투명, 100=투명).
showRSI: RSI 보조창을 켜고 끌 수 있는 스위치.
2. RSI 계산
rsi = ta.rsi(src, len)
지정한 가격 소스를 기반으로 RSI를 계산합니다.
3. 가격 차트 배경 색칠
bgCol = rsi <= lowerThr ? color.new(lowColor,bgTrans) :
rsi >= upperThr ? color.new(highColor,bgTrans) :
na
bgcolor(bgCol)
RSI ≤ 하단 임계값 → lowColor(과매도 색)
RSI ≥ 상단 임계값 → highColor(과매수 색)
나머지 구간은 색상 없음.
4. 선택적 RSI 보조창
plot(showRSI ? rsi : na, display=display.pane)
showRSI가 켜져 있으면 RSI 라인을 보조창에 표시하고, 꺼져 있으면 숨깁니다.
5. 임계값 가로선
hLower = hline(lowerThr, ...)
hUpper = hline(upperThr, ...)
하단·상단 임계값을 가로선으로 표시합니다.
hline은 if 블록 안에서 쓸 수 없기 때문에 항상 그려지지만, 보조창이 꺼지면 색을 na로 처리해 안 보이게 합니다.
6. 임계값 사이 영역 음영 처리
fill(hLower, hUpper, color=showRSI ? color.new(color.gray,95) : na)
보조창이 켜져 있을 때만 두 가로선 사이를 회색으로 채워 “중립 구간”을 강조합니다.
7. 알림 조건
RSI가 하단 임계값을 아래로 돌파할 때 알림.
RSI가 상단 임계값을 위로 돌파할 때 알림.
실제 작동 모습
가격 차트 뒤쪽에 RSI ≤30이면 파란색, RSI ≥70이면 빨간색 배경이 나타납니다(색상은 설정에서 변경 가능).
RSI 보조창을 켜면, RSI 라인과 임계값 가로선, 그리고 그 사이 음영 영역이 함께 나타납니다.
투명도를 높이거나 낮추어 강조 정도를 조절할 수 있습니다.
장점
별도의 RSI창을 열지 않고도 가격 차트 배경만으로 과매수·과매도 상태를 직관적으로 확인 가능.
필요하면 보조창으로 RSI를 직접 확인하면서 임계값 가이드와 음영 영역을 함께 볼 수 있음.
색상·투명도를 자유롭게 조절할 수 있어 차트 스타일에 맞게 커스터마이징 가능.
RSI가 임계값을 돌파할 때 자동 알림을 받을 수 있음.
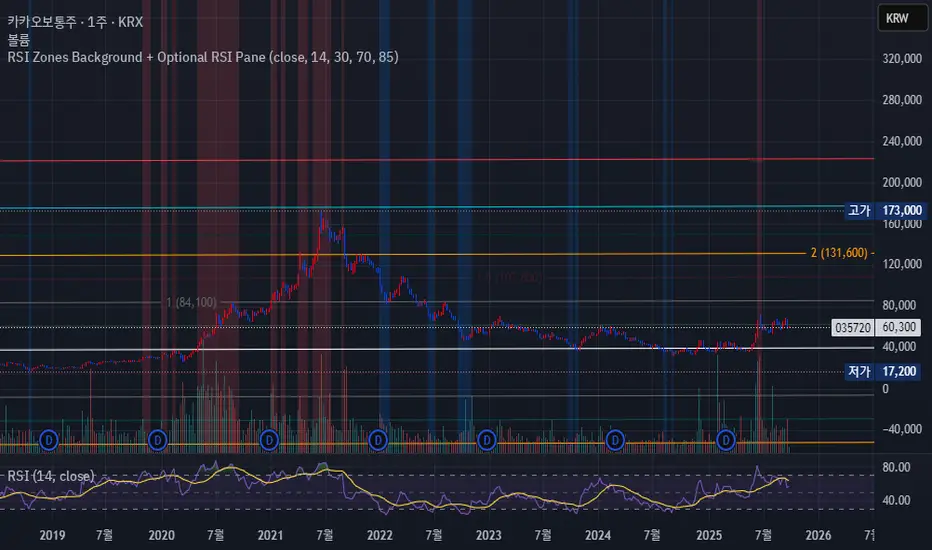
RSI of RSI Deviation (RoRD)RSI of RSI Deviation (RoRD) - Advanced Momentum Acceleration Analysis
What is RSI of RSI Deviation (RoRD)?
RSI of RSI Deviation (RoRD) is a insightful momentum indicator that transcends traditional oscillator analysis by measuring the acceleration of momentum through sophisticated mathematical layering. By calculating RSI on RSI itself (RSI²) and applying advanced statistical deviation analysis with T3 smoothing, RoRD reveals hidden market dynamics that single-layer indicators miss entirely.
This isn't just another RSI variant—it's a complete reimagining of how we measure and visualize momentum dynamics. Where traditional RSI shows momentum, RoRD shows momentum's rate of change . Where others show static overbought/oversold levels, RoRD reveals statistically significant deviations unique to each market's character.
Theoretical Foundation - The Mathematics of Momentum Acceleration
1. RSI² (RSI of RSI) - The Core Innovation
Traditional RSI measures price momentum. RoRD goes deeper:
Primary RSI (RSI₁) : Standard RSI calculation on price
Secondary RSI (RSI²) : RSI calculated on RSI₁ values
This creates a "momentum of momentum" indicator that leads price action
Mathematical Expression:
RSI₁ = 100 - (100 / (1 + RS₁))
RSI² = 100 - (100 / (1 + RS₂))
Where RS₂ = Average Gain of RSI₁ / Average Loss of RSI₁
2. T3 Smoothing - Lag-Free Response
The T3 Moving Average, developed by Tim Tillson, provides:
Superior smoothing with minimal lag
Adaptive response through volume factor (vFactor)
Noise reduction while preserving signal integrity
T3 Formula:
T3 = c1×e6 + c2×e5 + c3×e4 + c4×e3
Where e1...e6 are cascaded EMAs and c1...c4 are volume-factor-based coefficients
3. Statistical Z-Score Deviation
RoRD employs dual-layer Z-score normalization :
Initial Z-Score : (RSI² - SMA) / StDev
Final Z-Score : Z-score of the Z-score for refined extremity detection
This identifies statistically rare events relative to recent market behavior
4. Multi-Timeframe Confluence
Compares current timeframe Z-score with higher timeframe (HTF)
Provides directional confirmation across time horizons
Filters false signals through timeframe alignment
Why RoRD is Different & More Sophisticated
Beyond Traditional Indicators:
Acceleration vs. Velocity : While RSI measures momentum (velocity), RoRD measures momentum's rate of change (acceleration)
Adaptive Thresholds : Z-score analysis adapts to market conditions rather than using fixed 70/30 levels
Statistical Significance : Signals are based on mathematical rarity, not arbitrary levels
Leading Indicator : RSI² often turns before price, providing earlier signals
Reduced Whipsaws : T3 smoothing eliminates noise while maintaining responsiveness
Unique Signal Generation:
Quantum Orbs : Multi-layered visual signals for statistically extreme events
Divergence Detection : Automated identification of price/momentum divergences
Regime Backgrounds : Visual market state classification (Bullish/Bearish/Neutral)
Particle Effects : Dynamic visualization of momentum energy
Visual Design & Interpretation Guide
Color Coding System:
Yellow (#e1ff00) : Neutral/balanced momentum state
Red (#ff0000) : Overbought/extreme bullish acceleration
Green (#2fff00) : Oversold/extreme bearish acceleration
Orange : Z-score visualization
Blue : HTF Z-score comparison
Main Visual Elements:
RSI² Line with Glow Effect
Multi-layer glow creates depth and emphasis
Color dynamically shifts based on momentum state
Line thickness indicates signal strength
Quantum Signal Orbs
Green Orbs Below : Statistically rare oversold conditions
Red Orbs Above : Statistically rare overbought conditions
Multiple layers indicate signal strength
Only appear at Z-score extremes for high-conviction signals
Divergence Markers
Green Circles : Bullish divergence detected
Red Circles : Bearish divergence detected
Plotted at pivot points for precision
Background Regimes
Green Background : Bullish momentum regime
Grey Background : Bearish momentum regime
Blue Background : Neutral/transitioning regime
Particle Effects
Density indicates momentum energy
Color matches current RSI² state
Provides dynamic market "feel"
Dashboard Metrics - Deep Dive
RSI² ANALYSIS Section:
RSI² Value (0-100)
Current smoothed RSI of RSI reading
>70 : Strong bullish acceleration
<30 : Strong bearish acceleration
~50 : Neutral momentum state
RSI¹ Value
Traditional RSI for reference
Compare with RSI² for acceleration/deceleration insights
Z-Score Status
🔥 EXTREME HIGH : Z > threshold, statistically rare bullish
❄️ EXTREME LOW : Z < threshold, statistically rare bearish
📈 HIGH/📉 LOW : Elevated but not extreme
➡️ NEUTRAL : Normal statistical range
MOMENTUM Section:
Velocity Indicator
▲▲▲ : Strong positive acceleration
▼▼▼ : Strong negative acceleration
Shows rate of change in RSI²
Strength Bar
██████░░░░ : Visual power gauge
Filled bars indicate momentum strength
Based on deviation from center line
SIGNALS Section:
Divergence Status
🟢 BULLISH DIV : Price making lows, RSI² making highs
🔴 BEARISH DIV : Price making highs, RSI² making lows
⚪ NO DIVERGENCE : No divergence detected
HTF Comparison
🔥 HTF EXTREME : Higher timeframe confirms extremity
📊 HTF NORMAL : Higher timeframe is neutral
Critical for multi-timeframe confirmation
Trading Application & Strategy
Signal Hierarchy (Highest to Lowest Priority):
Quantum Orb + HTF Alignment + Divergence
Highest conviction reversal signal
Z-score extreme + timeframe confluence + divergence
Quantum Orb + HTF Alignment
Strong reversal signal
Wait for price confirmation
Divergence + Regime Change
Medium-term reversal signal
Monitor for orb confirmation
Threshold Crosses
Traditional overbought/oversold
Use as alert, not entry
Entry Strategies:
For Reversals:
Wait for Quantum Orb signal
Confirm with HTF Z-score direction
Enter on price structure break
Stop beyond recent extreme
For Continuations:
Trade with regime background color
Use RSI² pullbacks to center line
Avoid signals against HTF trend
For Scalping:
Focus on Z-score extremes
Quick entries on orb signals
Exit at center line cross
Risk Management:
Reduce position size when signals conflict with HTF
Avoid trades during regime transitions (blue background)
Tighten stops after divergence completion
Scale out at statistical mean reversion
Development & Uniqueness
RoRD represents months of research into momentum dynamics and statistical analysis. Unlike indicators that simply combine existing tools, RoRD introduces several genuine innovations :
True RSI² Implementation : Not a smoothed RSI, but actual RSI calculated on RSI values
Dual Z-Score Normalization : Unique approach to finding statistical extremes
T3 Integration : First RSI² implementation with T3 smoothing for optimal lag reduction
Quantum Orb Visualization : Revolutionary signal display method
Dynamic Regime Detection : Automatic market state classification
Statistical Adaptability : Thresholds adapt to market volatility
This indicator was built from first principles, with each component carefully selected for its mathematical properties and practical trading utility. The result is a professional-grade tool that provides insights unavailable through traditional momentum analysis.
Best Practices & Tips
Start with default settings - they're optimized for most markets
Always check HTF alignment before taking signals
Use divergences as early warning , orbs as confirmation
Respect regime backgrounds - trade with them, not against
Combine with price action - RoRD shows when, price shows where
Adjust Z-score thresholds based on market volatility
Monitor dashboard metrics for complete market context
Conclusion
RoRD isn't just another indicator—it's a complete momentum analysis system that reveals market dynamics invisible to traditional tools. By combining momentum acceleration, statistical analysis, and multi-timeframe confluence with intuitive visualization, RoRD provides traders with a sophisticated edge in any market condition.
Whether you're scalping rapid reversals or positioning for major trend changes, RoRD's unique approach to momentum analysis will transform how you see and trade market dynamics.
See momentum's future. Trade with statistical edge.
Trade with insight. Trade with anticipation.
— Dskyz, for DAFE Trading Systems

RSI Shifting Band Oscillator | QuantMAC📊 RSI Shifting Band Oscillator | QuantMAC
🎯 Overview
The RSI Shifting Band Oscillator represents a breakthrough in adaptive technical analysis, combining the innovative dual-stage RSI processing with dynamic volatility bands to create an oscillator that automatically adjusts to changing market momentum conditions. This cutting-edge indicator goes beyond traditional static approaches by using smoothed RSI to dynamically shift band width based on momentum transitions, providing superior signal accuracy across different market regimes.
🔧 Key Features
Revolutionary Dual RSI Technology: Proprietary two-stage RSI calculation with exponential smoothing that measures momentum transitions in real-time
Dynamic Adaptive Bands: Self-adjusting volatility bands that expand and contract based on RSI distance from equilibrium
Dual Trading Modes: Flexible Long/Short or Long/Cash strategies for different trading preferences
Advanced Performance Analytics: Comprehensive metrics including Sharpe, Sortino, and Omega ratios
Smart Visual System: Dynamic color coding with 9 professional color schemes
Precision Backtesting: Date range filtering with detailed historical performance analysis
Real-time Signal Generation: Clear entry/exit signals with customizable threshold sensitivity
Position Sizing Intelligence: Half Kelly criterion for optimal risk management
📈 How The Dual RSI Technology Works
The Dual RSI system is the heart of this indicator's innovation. Unlike traditional RSI implementations, this approach analyzes the smoothed momentum transitions between different RSI states, providing early warning signals for momentum regime changes.
RSI Calculation Process:
Calculate traditional RSI using specified length and price source
Apply exponential moving average smoothing to reduce noise
Measure RSI distance from neutral 50 level to determine momentum strength
Use RSI deviation to dynamically adjust standard deviation multipliers
Create adaptive bands that respond to momentum conditions
Generate normalized oscillator values for clear signal interpretation
The genius of this dual RSI approach lies in its ability to detect when markets are transitioning between momentum and consolidation periods before traditional indicators catch up. This provides traders with a significant edge in timing entries and exits.
⚙️ Comprehensive Parameter Control
RSI Settings:
RSI Length: Controls the lookback period for momentum analysis (default: 14)
RSI Smoothing: Reduces noise in RSI calculations using EMA (default: 20)
Source: Price input selection (close, open, high, low, etc.)
Oscillator Settings:
Base Length: Foundation moving average for band calculations (default: 40)
Standard Deviation Length: Period for volatility measurement (default: 26)
SD Multiplier: Base band width adjustment (default: 2.7)
Oscillator Multiplier: Scaling factor for oscillator values (default: 100)
Signal Thresholds:
Long Threshold: Bullish signal trigger level (default: 90)
Short Threshold: Bearish signal trigger level (default: 56)
🎨 Advanced Visual System
Main Chart Elements:
Dynamic Shifting Bands: Upper and lower bands that automatically adjust width based on RSI momentum
Adaptive Fill Zone: Color-coded area between bands showing current market state
Basis Line: Moving average foundation displayed as subtle reference points
Smart Bar Coloring: Candles change color based on oscillator state for instant visual feedback
Oscillator Pane:
Normalized RSI Oscillator: Main signal line centered around zero with dynamic coloring
Threshold Lines: Horizontal reference lines for entry/exit levels
Zero Line: Central reference for oscillator neutrality
Color State Indication: Line colors change based on bullish/bearish conditions
📊 Professional Performance Metrics
The built-in analytics suite provides institutional-grade performance measurement:
Net Profit %: Total strategy return percentage
Maximum Drawdown %: Worst peak-to-trough decline
Win Rate %: Percentage of profitable trades
Profit Factor: Ratio of gross profits to gross losses
Sharpe Ratio: Risk-adjusted return measurement
Sortino Ratio: Downside-focused risk adjustment
Omega Ratio: Probability-weighted performance ratio
Half Kelly %: Optimal position sizing recommendation
Total Trades: Complete transaction count
🎯 Strategic Trading Applications
Long/Short Mode: ⚡
Maximizes profit potential by capturing both upward and downward price movements. The dual RSI technology helps identify when momentum is strengthening or weakening, allowing for optimal position switches between long and short.
Long/Cash Mode: 🛡️
Conservative approach ideal for retirement accounts or risk-averse traders. The indicator's adaptive nature helps identify the best times to be invested versus sitting in cash, protecting capital during adverse market conditions.
🚀 Unique Advantages
Traditional Indicators vs RSI Shifting Bands:
Static vs Dynamic: While most indicators use fixed parameters, RSI bands adapt in real-time
Lagging vs Leading: Dual RSI detects momentum transitions before they fully manifest
One-Size vs Adaptive: The same settings work across different market conditions
Simple vs Intelligent: Advanced momentum analysis provides superior market insight
💡 Professional Setup Guide
For Day Trading (Short-term):
RSI Length: 10-12
RSI Smoothing: 15-18
Base Length: 25-30
Thresholds: Long 85, Short 60
For Swing Trading (Medium-term):
RSI Length: 14-16 (default range)
RSI Smoothing: 20-25
Base Length: 40-50
Thresholds: Long 90, Short 56 (defaults)
For Position Trading (Long-term):
RSI Length: 18-21
RSI Smoothing: 25-30
Base Length: 60-80
Thresholds: Long 92, Short 50
🧠 Advanced Trading Techniques
RSI Divergence Analysis:
Watch for divergences between price action and smoothed RSI readings. When price makes new highs/lows but RSI doesn't confirm, it often signals upcoming reversals.
Band Width Interpretation:
Expanding Bands: Increasing momentum, expect larger price moves
Contracting Bands: Decreasing momentum, prepare for potential breakouts
Band Touches: Price touching outer bands often signals reversal opportunities
Multi-Timeframe Analysis:
Use RSI oscillator on higher timeframes for trend direction and lower timeframes for precise entry timing.
⚠️ Important Risk Disclaimers
Past performance is not indicative of future results. This indicator represents advanced technical analysis but should never be used as the sole basis for trading decisions.
Critical Risk Factors:
Market Conditions: No indicator performs equally well in all market environments
Backtesting Limitations: Historical performance may not reflect future market behavior
Momentum Risk: Adaptive indicators can be sensitive to extreme momentum conditions
Parameter Sensitivity: Different settings may produce significantly different results
Capital Risk: Always use appropriate position sizing and stop-loss protection
📚 Educational Benefits
This indicator provides exceptional learning opportunities for understanding:
Advanced RSI analysis and momentum measurement techniques
Adaptive indicator design and implementation
The relationship between momentum transitions and price movements
Professional risk management using Kelly Criterion principles
Modern oscillator interpretation and signal generation
🔍 Market Applications
The RSI Shifting Band Oscillator works across various markets:
Forex: Excellent for currency pair momentum analysis
Stocks: Individual equity and index trading
Commodities: Adaptive to commodity market momentum cycles
Cryptocurrencies: Handles extreme momentum variations effectively
Futures: Professional derivatives trading applications
🔧 Technical Innovation
The RSI Shifting Band Oscillator represents years of research into adaptive technical analysis. The proprietary dual RSI calculation method has been optimized for:
Computational Efficiency: Fast calculation even on high-frequency data
Noise Reduction: Advanced smoothing without excessive lag
Market Adaptability: Automatic adjustment to changing conditions
Signal Clarity: Clear, actionable trading signals
🔔 Updates and Evolution
The RSI Shifting Band Oscillator | QuantMAC continues to evolve with regular updates incorporating the latest research in adaptive technical analysis. The code is thoroughly documented for transparency and educational purposes.
Trading Notice: Financial markets involve substantial risk of loss. The RSI Shifting Band Oscillator is a sophisticated technical analysis tool designed to assist in trading decisions but cannot guarantee profitable outcomes.
---
Master The Markets With Adaptive Intelligence! 🎯📈

RSI Pro Suite (Zeiierman)█ Overview
RSI Pro Suite (Zeiierman) is a complete RSI ecosystem built on an Efficient Price foundation. Instead of feeding RSI with the standard close, the script first converts price into an adaptive, efficiency-weighted trajectory known as Efficient Price. All major components of the tool, including the Efficient Price RSI, Significant RSI Moves, the divergence engine, the inefficiency layer, the momentum impulse system, and the multi-timeframe dashboard, are built on top of this refined data stream.
The result is an RSI that looks and behaves like a familiar oscillator while reflecting deeper qualities of the market, such as regime stability, volatility behavior, and directional consistency. It supports both discretionary and systematic workflows, whether you rely on classic overbought and oversold readings or more advanced interpretations such as significant internal RSI pressure, inefficiency clusters, divergence structures, and momentum bursts.
⚪ Why This One Is Unique
RSI Pro Suite does not treat RSI as a simple calculation on price. It embeds RSI inside a two-stage Efficient Price framework that reshapes how trend, rotation, and reversal pressure are interpreted. The chosen EP source (Close, Mean-reversion, or Trend) is first processed through an adaptive efficiency model that filters noise and enhances structural meaning. A second refinement pass produces the foundation for the EP-RSI, giving it a cleaner and more context-aware behavior than standard RSI.
Around this core, the script layers several specialized systems. Significant RSI Moves identify internal pressure zones where momentum stretches, revealing shifts that often occur before they appear on price.
█ Main Features
⚪ EP- Based RSI
The core of RSI Pro Suite is an RSI built on a refined Efficient Price rather than raw price, providing a cleaner and more structurally meaningful oscillator. It maintains the classic RSI visual style with 70/30 bands, a 50 midline, and soft gradient fills that express overbought and oversold tension. A smoothing layer allows several moving-average options for the RSI. This creates an intuitive environment for reading trend strength, exhaustion, and mean-reversion with far greater clarity than a standard RSI.
The Efficient Price engine can be driven by three behavioral modes that reshape the character of the RSI, allowing the indicator to adapt to different market conditions and trading styles.
Close
This mode follows price action directly, mirroring the natural rhythm of the market. It is the most general-purpose option and provides a balanced read of both trend and rotation, making it suitable for the majority of market environments.
Mean-reversion
Mean-reversion mode focuses on swing turns and snap-back behavior, emphasizing RSI-based cyclical reversals. It highlights oscillatory structures, swing reactions, and fading opportunities, making it highly effective for traders who target reversal setups or rotational markets.
Trend
The Trend mode uses a trend-smoothed input that emphasizes directional drift and sustained momentum. It provides clearer insight into trend continuation, trend maturity, and structural strength, helping traders stay aligned with broader directional moves.
⚪ Significant RSI Moves
RSI Pro Suite detects when RSI trades within its most important internal zones—areas where price has historically shown elevated reaction potential. The system continuously evaluates the structure of the RSI range and identifies moments when internal pressure becomes meaningful. When these conditions align, the indicator highlights Significant RSI Movements, revealing subtle but powerful structural shifts before they appear on price itself.
⚪ Divergence Detection
The suite includes regular bullish and bearish divergence detection between EP-RSI and price. It identifies clear pivot structures, marks them directly on the RSI pane, and labels each as Bull or Bear. Because divergences are evaluated using the Efficient Price RSI, the signals appear cleaner and less noisy, making them more reliable during both trend reversals and continuation setups.
⚪ Impulse
Momentum impulses appear when the RSI and Price exhibits unusually strong acceleration. Green circles near the upper region indicate sharp upside bursts, while red circles near the lower region reveal powerful downside surges. These impulses highlight moments of expansion, exhaustion, or sudden strength that stand out from typical RSI behavior.
⚪ Inefficiency Diamonds
Whenever the internal logic detects an inefficiency regime, the indicator plots blue diamonds on the mid-level. These diamonds mark structurally imbalanced or spiky conditions that often precede reaction swings, failed pushes, or key turning points in momentum.
⚪ Visual Multi-Timeframe Dashboard
A right-side dashboard provides a compact real-time overview of multiple structural signals across 5M, 15M, 1H, 2H, 4H, and 1D timeframes:
Directional Signals (up or down arrow)
OB/OS flags
Divergence state
Impulse activity
Inefficiency state
Explosive conditions
█ How to Use
⚪ Classic RSI Trading
Interpreting it is similar to a classic RSI but with structurally cleaner input. Sustained movement above the 50 midline reflects a bullish regime in the Efficient Price environment; persistent movement below 50 reflects a bearish regime. When EP-RSI repeatedly leans against the upper band near 70 while its smoothing line rises, it indicates strong upside control; repeated engagement with the lower band near 30 with a falling smoother indicates strong downside control.
⚪ Trend Trading
Use the Trend EP mode to smooth the RSI and track directional movement more clearly. When the RSI holds above the midline during an uptrend or below it during a downtrend, stay aligned with the direction. The multi-timeframe dashboard helps confirm trend strength by showing whether higher-timeframe signals agree with your chart.
Look for impulse markers and clean directional signals as continuation cues, and use inefficiency or weakening impulses as early signs to scale out or tighten stops.
⚪ Pullback Trading
Enable Trend mode and increase the length to 20 or higher. Then enable the Standard RSI and set it to 7. This configuration helps you track broader trends with the EP-RSI while using the shorter-period standard RSI to identify pullback opportunities within that trend.
When the EP-RSI is clearly green or red, indicating an established trend, begin watching the standard RSI for oversold or overbought conditions. These signals often mark clean pullbacks within the larger move. Entering during these moments allows you to participate in the continuation of the trend with improved timing and reduced risk.
⚪ Overbought/Oversold Trading
Treat the 70/30 regions as pressure zones, not automatic reversal signals. Use OB/OS flags on the dashboard to check whether multiple timeframes are stretched in the same direction. When price enters an overextended area, watch for Significant RSI Moves or impulse exhaustion markers to time entries or exits more precisely. This approach helps you avoid fading strong trends and instead focus on moments where reactions or pauses are more likely.
⚪ Mean-reversion Trading
Switch to Mean-reversion mode when focusing on turning points. This mode emphasizes snap-back behavior and makes reversal zones clearer. Combine reversal attempts with divergence signals, Significant RSI Moves, and impulse exhaustion markers. When several of these appear at once, especially across multiple timeframes on the dashboard, you have a stronger reversal setup.
⚪ Divergence Trading
Enable divergence detection when you want to focus on turning points rather than trend following. Bullish divergence occurs when price prints a lower low but the EP-RSI prints a higher low at a labeled pivot; bearish divergence occurs when price prints a higher high but the EP-RSI prints a lower high.
These divergences are most effective when they form near the 30 and 70 regions or after extended runs. A bullish divergence emerging from an oversold region can be used as confirmation to scale into long ideas; a bearish divergence near overbought regions can support profit-taking or contrarian short setups.
⚪ Breakout Trading
In breakout conditions, Significant RSI Moves and impulse markers work together as confirmation tools. When price pushes through a resistance level and the RSI prints a Significant RSI Move at the same time, it shows that internal momentum has shifted decisively in favor of the breakout. If this move is supported by green upper impulse markers, it strengthens the case that buyers are driving the move with conviction rather than the breakout occurring on weak momentum.
During a retest of the breakout zone, these signals become even more valuable. A Significant RSI Move forming at the retest, especially when paired with a fresh impulse burst, often marks strong rejection from the level and signals that the breakout structure is holding. This combination highlights areas where buyers are stepping in aggressively to defend the level.
The same concepts apply in reverse during breakdowns. A Significant RSI Move occurring at support alongside red downside impulses confirms heavy selling pressure and adds confidence to continuation entries. If such signals appear after an extended move, they can also highlight capitulation points that precede sharp reversals.
This makes Significant RSI Moves and impulse markers highly effective for validating breakouts, evaluating retests, and timing continuation or rejection trades with much greater precision.
⚪ Reversal Trading
Use contrarian signals to identify areas that may offer attractive reversal opportunities. These signals highlight moments when the market is stretched and showing signs of exhaustion, which can develop into a broader shift in direction. Combine them with Significant RSI Moves and impulse markers to gauge the strength and credibility of the potential reversal, especially around key levels or after extended trends.
⚪ Interpreting Inefficiency Regime
Watch the diamonds associated with the inefficiency regime as contextual signals. When they cluster following a smooth, steady trend, they often mark zones where the process shifts from “clean trend” to “noisy” or “imbalanced” behavior. Combined with EP-RSI rolling over from an extreme or divergence labels appearing nearby, such clusters can highlight high-value inflection areas.
⚪ Overview Panel
Use the right-hand dashboard as a quick alignment guide rather than a direct signal generator. Each row represents a different structural component of the market, and each column represents a timeframe from 5M to 1D. The Signals row shows immediate directional bias, OB/OS highlights stretched conditions, Divergence marks structural disagreement, Impulse reveals bursts of momentum, Inefficiency identifies unstable movement and Explosive highlights higher-timeframe volatility conditions.
The panel is most useful as a mental checklist. When several timeframes show similar characteristics, such as multiple signals pointing in the same direction or impulses aligning across the lower timeframes, the context for the trade becomes stronger. Mixed readings indicate hesitation or imbalance in the market, helping you avoid forcing trades during unclear conditions.
With coverage across 5M, 15M, 1H, 2H, 4H and 1D, the dashboard gives you an instant sense of whether momentum, pressure and structure are working together or pushing against each other, allowing you to judge at a glance whether the environment favors continuation, rotation or caution.
█ How It Works
⚪ EP Source and Pre-EP Layer
The system begins by selecting a core behavioral driver such as Close, Mean-Reversion, or Trend. This source is transformed into a stability-aware stream that evaluates how consistently the price is moving relative to its own volatility environment. Each movement is weighted by its structural quality rather than raw magnitude, producing a preliminary Efficient Price that reflects directional reliability instead of noise.
Calculation: Applies efficiency-based weighting and volatility normalization to the raw source, accumulating the results into a first-stage Efficient Price that represents structural strength and directional quality.
⚪ Main EP Engine and Adaptive Refinement
This first-stage Efficient Price is processed again through a second refinement pass, smoothing irregularities and further aligning the trajectory with coherent directional flow. The result is a fully refined Efficient Price that responds to meaningful structural shifts while avoiding the instability of raw price oscillation.
Calculation: Uses a second adaptive efficiency pass with volatility moderation, cumulative weighting, and slope extraction. This acts as a two-layer filter, favoring persistent movement while remaining sensitive to regime changes.
⚪ Inefficiency–Trend Blending
This component evaluates the EP-RSI through two behavioral lenses: inefficiency and trend. Inefficiency highlights spike-driven, imbalanced movement, while the trend component captures underlying directional slope and stability. A smooth blending mechanism transitions between these modes depending on where the system sits within efficiency space.
Calculation: Computes an inefficiency score from ER deviation and a trend score from normalized regression slope. A smoothstep transition blends them, and diamond markers appear when the oscillator confirms it is inside an inefficiency regime.
⚪ Momentum Impulse Modeling
Momentum impulses isolate moments when acceleration becomes unusually strong. The system exaggerates extreme RSI deviations while muting ordinary fluctuations, allowing only the sharpest bursts to stand out. A small clustering check eliminates transient noise, marking impulses only when structurally meaningful.
Calculation: Runs RSI through chained non-linear transforms, compares outputs against their own historical envelopes, evaluates local dominance, and emits impulse markers when deviations exceed cluster thresholds.
-----------------
Disclaimer
The content provided in my scripts, indicators, ideas, algorithms, and systems is for educational and informational purposes only. It does not constitute financial advice, investment recommendations, or a solicitation to buy or sell any financial instruments. I will not accept liability for any loss or damage, including without limitation any loss of profit, which may arise directly or indirectly from the use of or reliance on such information.
All investments involve risk, and the past performance of a security, industry, sector, market, financial product, trading strategy, backtest, or individual's trading does not guarantee future results or returns. Investors are fully responsible for any investment decisions they make. Such decisions should be based solely on an evaluation of their financial circumstances, investment objectives, risk tolerance, and liquidity needs.
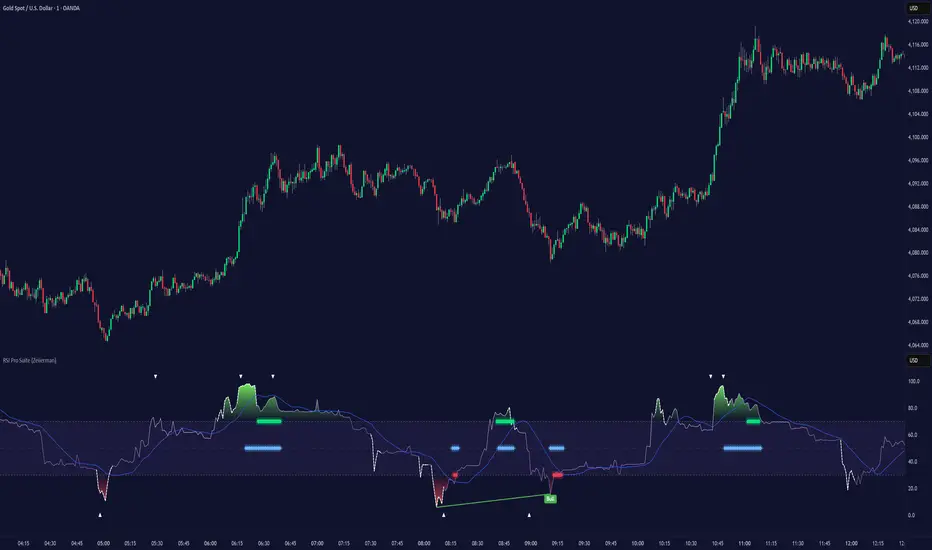
RSI Analytic Volume Matrix [RAVM] Overview
RSI Analytic Volume Matrix is an overlay indicator that turns classic RSI into a multi-layered market-reading engine. Instead of treating RSI 30 and 70 as simple buy/sell lines, RAVM combines RSI geometry (angle and acceleration), statistical volume analysis, and a 5×5 VSA-inspired matrix to describe what is really happening inside each candle.
The script is designed as an educational and analytical tool. It does not generate trading signals. Instead, it helps you read the market context, understand where the pressure is coming from (buyers vs. sellers), and see how price, momentum, and volume interact in real time.
Concept & Philosophy
RAVM is built around a hierarchical logic and a few core ideas:
• Hierarchical State Machine: First, RSI defines a context (where we are in the 0–100 range). Then the geometric engine evaluates the angle-of-turn of RSI using a Z-Score. Only after a meaningful geometric event is detected does the system promote a bar to a potential setup (warning vs. confirmed).
• Geometric Primacy: The angle and acceleration of RSI (RSI geometry) are more important than the raw RSI level itself. RAVM uses a geometric veto: if the geometric trigger is not confirmed, the confidence score is capped below 50%, even if volume looks interesting.
• RSI Beyond 30 and 70: Being above 70 or below 30 is not treated as an automatic overbought/oversold signal. RAVM treats those zones as contextual factors that contribute only a partial portion of the final score, alongside geometry, total volume expansion, buy/sell balance, and delta power.
• Volume Decomposition: Volume is decomposed into total, buy-side, sell-side, and delta components. Each of these is normalized with a Z-Score over a shared statistical window, so RSI geometry and volume live in the same statistical context.
• Educational Scoring Pipeline: RAVM builds a 0–100 "Quantum Score" for each detected setup. The score expresses how strong the story is across four dimensions: geometry (RSI angle-of-turn), total volume expansion, which side is driving that volume (buyers vs. sellers), and the power of delta. The score is designed for learning and weighting, not for mechanical trade entries.
• VSA Matrix Engine: A 5×5 matrix combines momentum states and volume dynamics. Each cell corresponds to an interpreted VSA-style scenario (Absorption, Distribution, No Demand, Stopping Volume, Strong Reversal, etc.), shown both as text and as a heatmap dashboard on the chart.
How RAVM Works
1. RSI Context & Geometry
RAVM starts with a classic RSI, but it does not stop at simple level checks. It computes the velocity and acceleration of RSI and normalizes them via a Z-Score to produce an Angle-of-Turn metric (Z-AoT). This Z-AoT is then mapped into a 0–1 intensity value called MSI (Momentum Shift Intensity).
The script monitors both classic RSI zones (around 30 and 70) and geometric triggers. Entering the lower or upper zone is treated as a contextual event only. A setup becomes "confirmed" when a significant geometric turn is detected (based on Z-AoT thresholds). Otherwise, the bar is at most a warning.
2. Volume & Statistical Engine
The volume engine can work in two modes: a geometric approximation (based on candle structure) or a more precise intrabar mode using up/down volume requests. In both cases, RAVM builds a volume packet consisting of:
• Total volume
• Buy-side volume
• Sell-side volume
• Delta (buy – sell)
Each of these series is normalized using a Z-Score over the same statistical window that is used for RSI geometry. This allows RAVM to answer questions such as: Is total volume exceptional on this bar? Is the expansion mostly coming from buyers or from sellers? Is delta unusually strong or weak compared to recent history?
3. Scoring System (Quantum Score)
For each bar where a setup is active, RAVM computes a 0–100 score intended as an educational confidence measure. The scoring pipeline follows this sequence:
A. RSI Geometry (MSI): Measures the strength of the RSI angle-of-turn via Z-AoT. This has geometric primacy over simple level checks.
B. RSI Zone Context: Being below 30 or above 70 contributes only a partial bonus to the score, reflecting the idea that these zones are context, not automatic signals. Mildly supportive zones (e.g., RSI below 50 for bullish contexts) can also contribute with lower weight.
C. Total Volume Expansion: A normalized Volume Power term expresses how exceptional the total volume is relative to its recent distribution. If there is no meaningful volume expansion, the score remains modest even if RSI geometry looks interesting.
D. Which Side Is Driving the Volume: RAVM then checks whether the expansion is primarily on the buy side or the sell side, using Z-Score statistics for buy and sell volume separately. This stage does not yet rely on delta as a power metric; it simply answers the question: "Is this expansion mostly driven by buyers, sellers, or both?"
E. Delta as Final Power: Only at the final stage does the script bring in delta and its Z-Score as a measure of how one-sided the pressure really is. A strong negative delta during a bullish context, for example, can highlight absorption, while a strong positive delta against a bearish context can highlight distribution or a buying climax.
If a setup is not geometrically confirmed (for example, a simple entry into RSI 30/70 without a strong geometric turn), RAVM caps the final score below 50%. This "Geometric Veto" enforces the idea that RSI geometry must confirm before a scenario can be considered high-confidence.
4. Overlay UI & Smart Labels
RAVM is an overlay indicator: all information is drawn directly on the price chart, not in a separate pane. When a setup is active, a smart label is attached to the bar, together with a vertical connector line. Each label shows:
• Direction of the setup (bullish or bearish)
• Trigger type (classic OS/OB vs. geometric/hidden)
• Status (warning vs. confirmed)
• Quantum Score as a percentage
Confirmed setups use stronger colors and solid connectors, while warnings use softer colors and dotted connectors. The script also manages label placement to avoid overlap, keeping the chart clean and readable.
In addition to labels, a dashboard table is drawn on the chart. It displays the currently active matrix scenario, the dominant bias, a short textual interpretation, the full 5×5 heatmap, and summary metrics such as RSI, MSI, and Volume Power.
RSI Is Not Just 30 and 70
One of the central design decisions in RAVM is to treat RSI 30 and 70 as context, not as fixed buy/sell buttons. Many traders mechanically assume that RSI below 30 means "buy" and RSI above 70 means "sell". RAVM explicitly rejects this simplification.
Instead, the script asks a series of deeper questions: How sharp is the angle-of-turn of RSI right now? Is total volume expanding or contracting? Is that expansion dominated by buyers or sellers? Is delta confirming the move, or is there a hidden absorption or distribution taking place?
In the scoring logic, being in a lower or upper RSI zone contributes only part of the final score. Geometry, volume expansion, the buy/sell split, and delta power all have to align before a high-confidence scenario emerges. This makes RAVM much closer to a structured market-reading tool than a classic overbought/oversold indicator.
Matrix User Manual – Reading the 5×5 Grid
The heart of RAVM is its 5×5 matrix, where the vertical axis represents momentum states (M1–M5) and the horizontal axis represents volume dynamics (V1–V5). Each cell in this grid corresponds to a VSA-style scenario. The dashboard highlights the currently active cell and prints a textual description so you can read the story at a glance.
1. Confirmation Scenarios
These scenarios occur when momentum direction and volume expansion are aligned:
• Bullish Confirmation / Strong Reversal: Momentum is shifting strongly upward (often from a depressed RSI context), and expanded volume is driven mainly by buyers. Often seen as a strong bullish reversal or continuation signal from a VSA perspective.
• Bearish Confirmation / Strong Drop: Momentum is turning decisively downward, and expanded volume is driven mainly by sellers. This maps to strong bearish continuation or sharp reversal patterns.
2. Absorption & Stopping Volume
• Absorption: Total volume expands, but the dominant flow is opposite to the recent price move or the geometric bias. For example, heavy selling volume while the geometric context is bullish. This can indicate smart money quietly absorbing orders from the crowd.
• Stopping Volume: Exceptionally high volume appears near the end of an extended move, while momentum begins to decelerate. Price may still print new extremes, but the effort vs. result relationship signals potential exhaustion and the possibility of a turn.
3. Distribution & Buying Climax
• Distribution: Heavy buying volume appears within a bearish or topping context. Rather than healthy accumulation, this often represents larger players offloading inventory to late buyers. The matrix will typically flag this as a bearish-leaning scenario despite strong upside prints.
• Buying Climax: A surge of buy-side volume near the end of a strong uptrend, with momentum starting to weaken. From a VSA point of view, this is often the last push where retail aggressively buys what smart money is selling.
4. No Demand & No Supply
• No Demand: Price attempts to rise but does so on low, non-expansive volume. The market is not interested in following the move, and the lack of participation often precedes weakness or sideways action.
• No Supply: Price tries to push lower on thin volume. Selling pressure is limited, and the lack of supply can precede stabilization or recovery if buyers step back in.
5. Trend Exhaustion
• Uptrend Exhaustion: Momentum remains nominally bullish, but the quality of volume deteriorates (e.g., more effort, less net result). The matrix marks this as an uptrend losing internal strength, often after a series of aggressive moves.
• Downtrend Exhaustion: Similar logic in the opposite direction: strong prior downtrend, but increasingly inefficient downside progress relative to the volume invested. This can precede accumulation or a relief rally.
6. Effort vs. Result Scenarios
• Bullish Effort, Little Result: Buyers invest notable volume, but price progress is limited. This may reveal hidden selling into strength or a lack of follow-through from the broader market.
• Bearish Effort, Little Result: Sellers push volume, but price does not decline proportionally. This can indicate absorption of selling pressure and potential underlying demand.
7. Neutral, Churn & Thin Markets
• Neutral / Thin Market: Momentum and volume both remain muted. RAVM marks these as neutral cells where aggressive decision-making is usually less attractive and observing the broader structure is more important.
• High Volume Churn / Volatility: Both sides are active with high volume but limited directional progress. This can correspond to battle zones, local ranges, or high volatility rotations where the main message is conflict rather than clear trend.
Inputs & Options
RAVM includes several input groups to adapt the tool to your preferences:
• Localization: Multiple language options for all labels and dashboard text (e.g., English, Farsi, Turkish, Russian).
• RSI Core Settings: RSI length, source, and upper/lower contextual zones (typically around 30 and 70).
• Geometric Engine: Z-AoT sigma thresholds, confirmation ratios, and normalization window multiplier. These control how sensitive the script is to RSI angle-of-turn events.
• Volume Engine: Choice between geometric approximation and intrabar up/down volume, Z-Score thresholds for volume expansion, and related parameters.
• Visual Interface: Toggles for smart labels, dashboard table, font sizes, dashboard position, and color themes for bullish, bearish, and warning states.
Disclaimer
RSI Analytic Volume Matrix is provided for educational and research purposes only. It does not constitute financial advice and is not a signal generator. Any trading decisions you make based on this tool, or any other, are entirely your own responsibility. Always consider your own risk management rules and conduct your own analysis.

RSI HTF Hardcoded (A/B Presets) + Regimes [CHE]RSI HTF Hardcoded (A/B Presets) + Regimes — Higher-timeframe RSI emulation with acceptance-based regime filter and on-chart diagnostics
Summary
This indicator emulates a higher-timeframe RSI on the current chart by resolving hardcoded “HTF-like” lengths from a time-bucket mapping, avoiding cross-timeframe requests. It computes RSI on a resolved length, smooths it with a resolved moving average, and derives a histogram-style difference (RSI minus its smoother). A four-state regime classifier is gated by a dead-band and an acceptance filter requiring consecutive bars before a regime is considered valid. An on-chart table reports the active preset, resolved mapping tag, resolved lengths, and the current filtered regime.
Pine version: v6
Overlay: false
Primary outputs: RSI line, SMA(RSI) line, RSI–SMA histogram columns, reference levels (30/50/70), regime-change alert, info table
Motivation
Cross-timeframe RSI implementations often rely on `request.security`, which can introduce repaint pathways and additional update latency. This design uses deterministic, on-series computation: it infers a coarse target bucket (or uses a forced bucket) and resolves lengths accordingly. The dead-band reduces noise at the decision boundaries (around RSI 50 and around the RSI–SMA difference), while the acceptance filter suppresses rapid flip-flops by requiring sustained agreement across bars.
Differences
Baseline: Standard RSI with a user-selected length on the same timeframe, or HTF RSI via cross-timeframe requests.
Key differences:
Hardcoded preset families and a bucket-based mapping to resolve “HTF-like” lengths on the current chart.
No `request.security`; all calculations run on the chart’s own series.
Regime classification uses two independent signals (RSI relative to 50 and RSI–SMA difference), gated by a configurable dead-band and an acceptance counter.
Always-on diagnostics via a persistent table (optional), showing preset, mapping tag, resolved lengths, and filtered regime.
Practical effect: The oscillator behaves like a slower, higher-timeframe variant with more stable regime transitions, at the cost of delayed recognition around sharp turns (by design).
How it works
1. Bucket selection: The script derives a coarse “target bucket” from the chart timeframe (Auto) or uses a user-forced bucket.
2. Length resolution: A chosen preset defines base lengths (RSI length and smoothing length). A bucket/timeframe mapping resolves a multiplier, producing final lengths used for RSI and smoothing.
3. Oscillator construction: RSI is computed on the resolved RSI length. A moving average of RSI is computed on the resolved smoothing length. The difference (RSI minus its smoother) is used as the histogram series.
4. Regime classification: Four regimes are defined from:
RSI relative to 50 (bullish above, bearish below), with a dead-band around 50
Difference relative to 0 (positive/negative), with a dead-band around 0
These two axes produce strong/weak bull and bear states, plus a neutral state when inside the dead-band(s).
5. Acceptance filter: The raw regime must persist for `n` consecutive bars before it becomes the filtered regime. The alert triggers when the filtered regime changes.
6. Diagnostics and visualization: Histogram columns change shade based on sign and whether the difference is rising/falling. The table displays preset, mapping tag, resolved lengths, and the filtered regime description.
Parameter Guide
Source — Input series for RSI — Default: Close — Smoother sources reduce noise but add lag.
Preset — Base lengths family — Default: A(14/14) — Switch presets to change RSI and smoothing responsiveness.
Target Bucket — Auto or forced bucket — Default: Auto — Force a bucket to lock behavior across chart timeframe changes.
Table X / Table Y — Table anchor — Default: right / top — Move to avoid covering content.
Table Size — Table text size — Default: normal — Increase for presentations, decrease for dense layouts.
Dark Mode — Table theme — Default: enabled — Match chart background for readability.
Show Table — Toggle diagnostics table — Default: enabled — Disable for a cleaner pane.
Epsilon (dead-band) — Noise gate for decisions — Default: 1.0 — Raise to reduce flips near boundaries; lower to react faster.
Acceptance bars (n) — Bars required to confirm a regime — Default: 3 — Higher reduces whipsaw; lower increases reactivity.
Reading
Histogram (RSI–SMA):
Above zero indicates RSI is above its smoother (positive momentum bias).
Below zero indicates RSI is below its smoother (negative momentum bias).
Darker/lighter shading indicates whether the difference is increasing or decreasing versus the previous bar.
RSI vs SMA(RSI):
RSI’s position relative to 50 provides broad directional bias.
RSI’s position relative to its smoother provides momentum confirmation/contra-signal.
Regimes:
Strong bull: RSI meaningfully above 50 and difference meaningfully above 0.
Weak bull: RSI above 50 but difference below 0 (pullback/transition).
Strong bear: RSI meaningfully below 50 and difference meaningfully below 0.
Weak bear: RSI below 50 but difference above 0 (pullback/transition).
Neutral: inside the dead-band(s).
Table:
Use it to validate the active preset, the mapping tag, the resolved lengths, and the filtered regime output.
Workflows
Trend confirmation:
Favor long bias when strong bull is active; favor short bias when strong bear is active.
Treat weak regimes as pullback/transition context rather than immediate reversals, especially with higher acceptance.
Structure + oscillator:
Combine regimes with swing structure, breakouts, or a baseline trend filter to avoid trading against dominant structure.
Use regime change alerts as a “state change” notification, not as a standalone entry.
Multi-asset consistency:
The bucket mapping helps keep a consistent “feel” across different chart timeframes without relying on external timeframe series.
Behavior/Constraints
Intrabar behavior:
No cross-timeframe requests are used; values can still evolve on the live bar and settle at close depending on your chart/update timing.
Warm-up requirements:
Large resolved lengths require sufficient history to seed RSI and smoothing. Expect a warm-up period after loading or switching symbols/timeframes.
Latency by design:
Dead-band and acceptance filtering reduce noise but can delay regime changes during sharp reversals.
Chart types:
Intended for standard time-based charts. Non-time-based or synthetic chart types (e.g., Heikin-Ashi, Renko, Kagi, Point-and-Figure, Range) can distort oscillator behavior and regime stability.
Tuning
Too many flips near decision boundaries:
Increase Epsilon and/or increase Acceptance bars.
Too sluggish in clean trends:
Reduce Acceptance bars by one, or choose a faster preset (shorter base lengths).
Too sensitive on lower timeframes:
Choose a slower preset (longer base lengths) or force a higher Target Bucket.
Want less clutter:
Disable the table and keep only the alert + plots you need.
What it is/isn’t
This indicator is a regime and visualization layer for RSI using higher-timeframe emulation and stability gates. It is not a complete trading system and does not provide position sizing, risk management, or execution rules. Use it alongside structure, liquidity/volatility context, and protective risk controls.
Disclaimer
The content provided, including all code and materials, is strictly for educational and informational purposes only. It is not intended as, and should not be interpreted as, financial advice, a recommendation to buy or sell any financial instrument, or an offer of any financial product or service. All strategies, tools, and examples discussed are provided for illustrative purposes to demonstrate coding techniques and the functionality of Pine Script within a trading context.
Any results from strategies or tools provided are hypothetical, and past performance is not indicative of future results. Trading and investing involve high risk, including the potential loss of principal, and may not be suitable for all individuals. Before making any trading decisions, please consult with a qualified financial professional to understand the risks involved.
By using this script, you acknowledge and agree that any trading decisions are made solely at your discretion and risk.
Best regards and happy trading
Chervolino.

RSI Divergence (Regular + Hidden, @darshakssc)This indicator detects regular and hidden divergence between price and RSI, using confirmed swing highs and swing lows (pivots) on both series. It is designed as a visual analysis tool, not as a signal generator or trading system.
The goal is to highlight moments where price action and RSI momentum move in different directions, which some traders study as potential early warnings of trend exhaustion or trend continuation. All divergence signals are only drawn after a pivot is fully confirmed, helping to avoid repainting.
The script supports four divergence types:
Regular Bullish Divergence
Regular Bearish Divergence
Hidden Bullish Divergence
Hidden Bearish Divergence
Each type is drawn with a different color and labeled clearly on the chart.
Core Concepts Used
1. RSI (Relative Strength Index)
The script uses standard RSI, calculated on a configurable input source (default: close) and length (default: 14).
RSI is treated purely as a momentum oscillator – the script does not enforce oversold/overbought interpretations.
2. Pivots / Swings
The indicator defines swing highs and swing lows using ta.pivothigh() and ta.pivotlow():
A swing high forms when a bar’s high is higher than a specified number of bars to the left and to the right.
A swing low forms when a bar’s low is lower than a specified number of bars to the left and to the right.
The same pivot logic is applied to both price and RSI.
Because pivots require “right side” bars to form, the indicator:
Waits for the full pivot to be confirmed (no forward-looking referencing beyond the rightBars parameter).
Only then considers that pivot for divergence detection.
This helps prevent repainting of divergence signals.
How Divergence Is Detected
The script always uses the two most recent confirmed pivots for both price and RSI. It tracks:
Last two swing lows in price and RSI
Last two swing highs in price and RSI
Their pivot bar indexes and values
A basic minimum distance filter between the pivots (in bars) is also applied to reduce noise.
1. Regular Bullish Divergence
Condition:
Price makes a lower low (LL) between the last two lows
RSI makes a higher low (HL) over the same two pivot lows
The RSI difference between the two lows is greater than or equal to the user-defined minimum (Min RSI Difference)
The two low pivots are separated by at least Min Bars Between Swings
Interpretation:
Some traders view this as bearish momentum weakening while price prints a new low. The script only marks this structure; it does not assume any outcome.
On the chart:
Drawn between the previous and current price swing lows
Labeled: “Regular Bullish”
Color: Green (by default in the script)
2. Regular Bearish Divergence
Condition:
Price makes a higher high (HH) between the last two highs
RSI makes a lower high (LH) over the same two pivot highs
RSI difference exceeds Min RSI Difference
Pivots are separated by at least Min Bars Between Swings
Interpretation:
Some traders see this as bullish momentum weakening while price prints a new high. Again, the indicator simply highlights this divergence.
On the chart:
Drawn between the previous and current price swing highs
Labeled: “Regular Bearish”
Color: Red
3. Hidden Bullish Divergence
Condition:
Price makes a higher low (HL) between the last two lows
RSI makes a lower low (LL) over the same two lows
RSI difference exceeds Min RSI Difference
Pivots meet the minimum distance requirement
Interpretation:
Some traders interpret hidden bullish divergence as a potential trend continuation signal within an existing uptrend. The indicator does not classify trends; it just tags the pattern when price and RSI pivots meet the conditions.
On the chart:
Drawn between the previous and current price swing lows
Labeled: “Hidden Bullish”
Color: Teal
4. Hidden Bearish Divergence
Condition:
Price makes a lower high (LH) between the last two highs
RSI makes a higher high (HH) over those highs
RSI difference exceeds Min RSI Difference
Pivots meet the minimum distance filter
Interpretation:
Some traders associate hidden bearish divergence with potential downtrend continuation, but again, this script only visualizes the structure.
On the chart:
Drawn between the previous and current price swing highs
Labeled: “Hidden Bearish”
Color: Orange
Inputs and Settings
1. RSI Settings
RSI Source – Price source for RSI (default: close).
RSI Length – Period for RSI calculation (default: 14).
These control the responsiveness of the RSI. Shorter lengths may show more frequent divergence; longer lengths smooth the signal.
2. Swing / Pivot Settings
Left Swing Bars (leftBars)
Right Swing Bars (rightBars)
These define how strict the pivot detection is:
Higher values → fewer, more significant swings
Lower values → more swings, more signals
Because the script uses ta.pivothigh / ta.pivotlow, a pivot is only confirmed once rightBars candles have closed after the candidate bar. This is an intentional design to reduce repainting and make pivots stable.
3. Divergence Filters
Min Bars Between Swings (Min Bars Between Swings)
Requires a minimum bar distance between the two pivots used to form divergence.
Helps avoid clutter from pivots that are too close to each other.
Min RSI Difference (Min RSI Difference)
Requires a minimum absolute difference between RSI values at the two pivots.
Filters out very minor changes in RSI that may not be meaningful.
4. Visibility Toggles
Show Regular Divergence
Show Hidden Divergence
You can choose to display:
Both regular and hidden divergence, or
Only regular divergence, or
Only hidden divergence
This is useful if you prefer to focus on one type of structure.
5. Alerts
Enable Alerts
When enabled, the script exposes four alert conditions:
Regular Bullish Divergence Confirmed
Regular Bearish Divergence Confirmed
Hidden Bullish Divergence Confirmed
Hidden Bearish Divergence Confirmed
Each alert fires after the corresponding divergence has been fully confirmed based on the pivot and bar confirmation logic. The script does not issue rapid or intrabar signals; it uses confirmed historical conditions.
You can set these in the TradingView Alerts dialog by choosing this indicator and selecting the desired condition.
Visual Elements
On the main price chart, the indicator:
Draws a line between the two price pivots involved in the divergence.
Adds a small label at the latest pivot, describing the divergence type.
Colors are used to differentiate divergence categories (Green/Red/Teal/Orange).
This makes it easy to visually scan the chart for zones where price and RSI have diverged.
What to Look For (Analytical Use)
This indicator is intended as a visual helper, especially when:
You want to quickly see where price made new highs or lows while RSI did not confirm them in the same way.
You are studying momentum exhaustion, shifts, or continuation using RSI divergence as one of many tools.
You want to compare divergence occurrences across different timeframes or instruments.
Important:
The indicator does not tell you when to enter or exit trades.
It does not rank or validate the “quality” of a divergence.
Divergence can persist or fail; it is not a guarantee of reversal or continuation.
Many traders combine divergence analysis with:
Higher timeframe context
Trend filters (moving averages, structure)
Support/resistance zones or liquidity areas
Volume, structure breaks, or other confirmations
Disclaimer
This script is provided for educational and analytical purposes only.
It does not constitute financial advice, trading advice, or investment recommendations.
No part of this indicator is intended to suggest, encourage, or guarantee any specific trading outcome.
Users are solely responsible for their own decisions and risk management.

RSI Trendlines and Divergences█OVERVIEW
The "RSI Trendlines and Divergences" indicator is an advanced technical analysis tool that leverages the Relative Strength Index (RSI) to draw trendlines and detect divergences. Designed for traders seeking precise market signals, the indicator identifies key pivot points on the RSI chart, draws trendlines between pivots, and detects bullish and bearish divergences. It offers flexible settings, background coloring for breakout signals, and divergence labels, supported by alerts for key events. The indicator is universal and works across all markets (stocks, forex, cryptocurrencies) and timeframes.
█CONCEPTS
The indicator was developed to provide an alternative signal source for the RSI oscillator. Trendline breakouts and bounces off trendlines offer a broader perspective on potential price behavior. Combining these with traditional RSI signal interpretation can serve as a foundation for creating various trading strategies.
█FEATURES
- RSI and Pivot Calculation: Calculates RSI based on the selected source price (default: close) with a customizable period (default: 14). Identifies pivot points on RSI and price for trendlines and divergences.
- RSI Trendlines: Draws trendlines connecting RSI pivots (upper for downtrends, lower for uptrends) with optional extension (default: 30 bars). The trendline appears and generates a signal only after the first RSI crossover. Lines are colored (red for upper, green for lower).
- Trendline Fill: Widens the trendline with a tolerance margin expressed in RSI points, reducing signal noise and visually highlighting trend zones. Breaking this zone is a condition for generating signals, minimizing false signals. The tolerance margin can be increased or decreased.
- Divergence Detection: Identifies bullish and bearish divergences based on RSI and price pivots, displaying labels (“Bull” for bullish, “Bear” for bearish) with adjustable transparency. Divergence labels appear with a delay equal to the specified pivot length (default: 5). Higher values yield stronger signals but with greater delay.
- Breakout Signals: Generates signals when RSI crosses the trendline (bullish for upper lines, bearish for lower lines), with background coloring for signal confirmation.
- Alerts: Built-in alerts for:
Detection of bullish and bearish divergences.
Upper trendline crossover (bullish signal).
Lower trendline crossover (bearish signal).
- Customization: Allows adjustment of RSI length, pivot settings, line colors, fills, labels, and transparency of signals and background.
█HOW TO USE
Add the indicator to your TradingView chart via the Pine Editor or Indicators menu.
Configuring Settings.
RSI Settings
- RSI Length: Period for RSI calculation (default: 14).
- SMA Length: Period for RSI moving average (default: 9).
- Source: Source price for RSI (default: close).
Pivot Settings for Trend
- Left Bars for Pivot: Number of bars back for detecting pivots (default: 10).
- Right Bars for Pivot: Number of bars forward for confirming pivots (default: 10).
- Extension after Second Pivot: Number of bars to extend the trendline (default: 30, 0 = none). Extension increases the number of signals, while shortening reduces them.
- Tolerance: Deviation in RSI points to widen the breakout margin, reducing signal noise (default: 3.0).
Divergence Settings
- Enable Divergence Detection: Enables/disables divergence detection (default: enabled).
- Pivot Length for Divergence: Pivot period for divergences (default: 5).
Style Settings
- Upper Trendline Color: Color for downtrend lines (default: red).
- Upper Fill Color: Fill color for upper lines (default: red, transparency 70).
- Lower Trendline Color: Color for uptrend lines (default: green).
- Lower Fill Color: Fill color for lower lines (default: green, transparency 70).
- SMA Color: Color for RSI moving average (default: yellow).
- Bullish Divergence Color: Color for bullish labels (default: green).
- Bearish Divergence Color: Color for bearish labels (default: red).
- Text Color: Color for label text (default: white).
- Divergence Label Transparency: Transparency of labels (0-100, default: 40).
- Signal Background Transparency: Transparency of breakout signal background (0-100, default: 80).
Interpreting Signals
- Trendlines: Upper lines (red) indicate RSI downtrends, lower lines (green) indicate uptrends. The trendline appears and generates a signal only after the first RSI crossover. Trendline breakouts suggest potential trend reversals.
- Divergences: “Bull” labels indicate bullish divergence (potential rise), “Bear” labels indicate bearish divergence (potential decline), with a delay based on pivot length (default: 5). Divergences serve as confirmation or warning of trend reversal, not as standalone signals.
- Signal Background: Green background signals bullish breakouts, red background signals bearish breakouts.
- RSI Levels: Horizontal lines at 70 (overbought), 50 (midline), and 30 (oversold) help assess market zones.
- Alerts: Set up alerts in TradingView for divergences or trendline breakouts.
Combining with Other Tools: Use with support/resistance levels, Fibonacci levels, or other indicators for signal confirmation.
█APPLICATIONS
The "RSI Trendlines and Divergence" indicator is designed to identify trends and potential reversal points, supporting both trend-following and reversal strategies:
- Trend Confirmation: Trendlines indicate the RSI trend direction, with breakouts signaling potential reversals. The indicator is functional in traditional RSI usage, allowing classic RSI interpretation (e.g., returning from overbought/oversold zones). Combining trendline breakouts with RSI signal levels, such as a return from overbought or oversold zones paired with a trendline breakout, strengthens the signal.
- Divergence Detection: Divergences serve as confirmation or warning of trend reversal, not as standalone signals.
█NOTES
- Adjust settings (e.g., RSI length, pivots, tolerance) to suit your trading style and timeframe.
- Combine with other technical analysis tools to enhance signal accuracy.

RSI ADX Bollinger Analysis High-level purpose and design philosophy
This indicator — RSI-ADX-Bollinger Analysis — is a compact, educational market-analysis toolkit that blends momentum (RSI), trend strength (ADX), volatility structure (Bollinger Bands) and simple volumetrics to provide traders a snapshot of market condition and trade idea quality. The design philosophy is explicit and layered: use each component to answer a different question about price action (momentum, conviction, volatility, participation), then combine answers to form a more robust, explainable signal. The mashup is intended for analysis and learning, not automatic execution: it surfaces the why behind signals so traders can test, learn and apply rules with risk management.
________________________________________
What each indicator contributes (component-by-component)
RSI (Relative Strength Index) — role and behavior: RSI measures short-term momentum by comparing recent gains to recent losses. A high RSI (near or above the overbought threshold) indicates strong recent buying pressure and potential exhaustion if price is extended. A low RSI (near or below the oversold threshold) indicates strong recent selling pressure and potential exhaustion or a value area for mean-reversion. In this dashboard RSI is used as the primary momentum trigger: it helps identify whether price is locally over-extended on the buy or sell side.
ADX (Average Directional Index) — role and behavior: ADX measures trend strength independently of direction. When ADX rises above a chosen threshold (e.g., 25), it signals that the market is trending with conviction; ADX below the threshold suggests range or weak trend. Because patterns and momentum signals perform differently in trending vs. ranging markets, ADX is used here as a filter: only when ADX indicates sufficient directional strength does the system treat RSI+BB breakouts as meaningful trade candidates.
Bollinger Bands — role and behavior: Bollinger Bands (20-period basis ± N standard deviations) show volatility envelope and relative price position vs. a volatility-adjusted mean. Price outside the upper band suggests pronounced extension relative to recent volatility; price outside the lower band suggests extended weakness. A band expansion (increasing width) signals volatility breakout potential; contraction signals range-bound conditions and potential squeeze. In this dashboard, Bollinger Bands provide the volatility/structural context: RSI extremes plus price beyond the band imply a stronger, volatility-backed move.
Volume split & basic MA trend — role and behavior: Buy-like and sell-like volume (simple heuristic using close>open or closeopen) or sell-like (close1.2 for validation and compare win rate and expectancy.
4. TF alignment: Accept signals only when higher timeframe (e.g., 4h) trend agrees — compare results.
5. Parameter sensitivity: Vary RSI threshold (70/30 vs 80/20), Bollinger stddev (2 vs 2.5), and ADX threshold (25 vs 30) and measure stability of results.
These exercises teach both statistical thinking and the specific failure modes of the mashup.
________________________________________
Limitations, failure modes and caveats (explicit & teachable)
• ADX and Bollinger measures lag during fast-moving news events — signals can be late or wrong during earnings, macro shocks, or illiquid sessions.
• Volume classification by open/close is a heuristic; it does not equal TAPEDATA, footprint or signed volume. Use it as supportive evidence, not definitive proof.
• RSI can remain overbought or oversold for extended stretches in persistent trends — relying solely on RSI extremes without ADX or BB context invites large drawdowns.
• Small-cap or low-liquidity instruments yield noisy band behavior and unreliable volume ratios.
Being explicit about these limitations is a strong point in a TradingView description — it demonstrates transparency and educational intent.
________________________________________
Originality & mashup justification (text you can paste)
This script intentionally combines classical momentum (RSI), volatility envelope (Bollinger Bands) and trend-strength (ADX) because each indicator answers a different and complementary question: RSI answers is price locally extreme?, Bollinger answers is price outside normal volatility?, and ADX answers is the market moving with conviction?. Volume participation then acts as a practical check for real market involvement. This combination is not a simple “indicator mashup”; it is a designed ensemble where each element reduces the others’ failure modes and together produce a teachable, testable signal framework. The script’s purpose is educational and analytical — to show traders how to interpret the interplay of momentum, volatility, and trend strength.
________________________________________
TradingView publication guidance & compliance checklist
To satisfy TradingView rules about mashups and descriptions, include the following items in your script description (without exposing source code):
1. Purpose statement: One or two lines describing the script’s objective (educational multi-indicator market overview and idea filter).
2. Component list: Name the major modules (RSI, Bollinger Bands, ADX, volume heuristic, SMA trend checks, signal tracking) and one-sentence reason for each.
3. How they interact: A succinct non-code explanation: “RSI finds momentum extremes; Bollinger confirms volatility expansion; ADX confirms trend strength; all three must align for a BUY/SELL.”
4. Inputs: List adjustable inputs (RSI length and thresholds, BB length & stddev, ADX threshold & smoothing, volume MA, table position/size).
5. Usage instructions: Short workflow (check TF alignment → confirm participation → define stop & R:R → backtest).
6. Limitations & assumptions: Explicitly state volume is approximated, ADX has lag, and avoid promising guaranteed profits.
7. Non-promotional language: No external contact info, ads, claims of exclusivity or guaranteed outcomes.
8. Trademark clause: If you used trademark symbols, remove or provide registration proof.
9. Risk disclaimer: Add the copy-ready disclaimer below.
This matches TradingView’s request for meaningful descriptions that explain originality and inter-component reasoning.
________________________________________
Copy-ready short publication description (paste into TradingView)
Advanced RSI-ADX-Bollinger Market Overview — educational multi-indicator dashboard. This script combines RSI (momentum extremes), Bollinger Bands (volatility envelope and band expansion), ADX (trend strength), simple SMA trend bias and a basic buy/sell volume heuristic to surface high-quality idea candidates. Signals require alignment of momentum, volatility expansion and rising ADX; volume participation is displayed to support signal confidence. Inputs are configurable (RSI length/levels, BB length/stddev, ADX length/threshold, volume MA, display options). This tool is intended for analysis and learning — not for automated execution. Users should back test and apply robust risk management. Limitations: volume classification here is a heuristic (close>open), ADX and BB measures lag in fast news events, and results vary by instrument liquidity.
________________________________________
Copy-ready risk & misuse disclaimer (paste into description or help file)
This script is provided for educational and analytical purposes only and does not constitute financial or investment advice. It does not guarantee profits. Indicators are heuristics and may give false or late signals; always back test and paper-trade before using real capital. The author is not responsible for trading losses resulting from the use or misuse of this indicator. Use proper position sizing and risk controls.
________________________________________
Risk Disclaimer: This tool is provided for education and analysis only. It is not financial advice and does not guarantee returns. Users assume all risk for trades made based on this script. Back test thoroughly and use proper risk management.

RSI 3 Time FrameRSI 3 Time Frames Indicator
Overview
The RSI 3 Time Frames Indicator is designed to provide traders with a comprehensive view of the Relative Strength Index (RSI) across three different timeframes: Ripple (short-term), Wave (medium-term), and Tide (long-term). By combining insights from multiple timeframes on a single chart, traders can identify momentum, overbought/oversold conditions, and confluence zones for better decision-making.
This indicator is highly customizable, enabling you to adjust RSI timeframes, line colors, thickness, and reference levels such as oversold/overbought areas.
Features
Multi-Timeframe RSI Analysis:
Ripple RSI: Captures short-term momentum (default: 5-minute RSI) for quick entries and scalping.
Wave RSI: Provides medium-term RSI perspective (default: 15-minute RSI) for day trading setups.
Tide RSI: Gives broader trends and momentum shifts (default: 60-minute RSI) suitable for swing trading.
Key RSI Reference Levels:
Horizontal lines show critical RSI levels to help traders interpret conditions:
Oversold Zone:
20 (Oversold Extreme) → Green dotted line.
30 (Oversold) → Green dotted line.
Neutral Zone:
40 (Neutral Low) → Orange dotted line.
50 (Midpoint) → Black dotted line.
60 (Neutral High) → Orange dotted line.
Overbought Zone:
70 (Overbought) → Red dotted line.
80 (Overbought Extreme) → Red dotted line.
Customizable Options:
Adjust RSI line color, width, and timeframes to fit your trading needs.
Customize horizontal level line colors and styles (dotted, dashed, or solid).
Easy-to-Interpret Design:
All RSI lines and reference levels are visualized clearly to help you identify overbought/oversold zones, neutral levels, and overall market momentum across multiple perspectives.
Recommended Use Cases
Scalping:
Use Ripple RSI (default: 5-minute timeframe) for short-term insights into momentum-driven setups.
Day Trading:
Use Wave RSI (default: 15-minute timeframe) to analyze medium-term trends and spot entries/exits.
Swing Trading:
Use Tide RSI (default: 60-minute timeframe) for longer-term momentum shifts and confluence zones.
Multi-Timeframe Confirmation :
Look for alignment among RSI values across Ripple, Wave, and Tide to increase confidence in your trades.
How to Use the RSI 3 Time Frames Indicator
Add the Indicator to Your Chart: Import the RSI 3 Time Frames Indicator into TradingView.
Customize Settings:
Choose Ripple, Wave, and Tide RSI timeframes according to your strategy (e.g., 5-minute for short-term, 15-minute for medium-term).
Modify line colors, styles, and thickness for better clarity.
Enable/disable RSI lines or reference levels based on preference.
Interpret RSI Values Across Timeframes:
Identify overbought levels (above 70) for potential reversals.
Spot oversold levels (below 30) for buying opportunities.
Use the neutral midpoint (50) for balanced momentum, indicating neither buyers nor sellers dominate.
Combine with Other Tools:
Enhance your trading strategy by using RSI signals with price action tools like support/resistance zones, trendlines, and candlestick patterns.
Example Scenario
Let’s say you’re trading Bitcoin (BTC/USD):
Ripple RSI shows momentum building but nearing overbought (above 70).
Wave RSI confirms shorter momentum trends (above 60).
Tide RSI shows divergence as the longer timeframe RSI is falling toward oversold (below 40).
This alignment across timeframes helps you make informed decisions, such as waiting for Ripple RSI to cool off before entering a longer-term trade based on the Tide RSI oversold condition.
Disclaimer
The RSI 3 Time Frames Indicator is provided for educational and informational purposes only. It is not intended as financial advice or as a definitive trading signal. This tool should not be used in isolation for decision-making. Trading is inherently risky, and while RSI can offer valuable insights into market trends, traders should use proper risk management strategies and include other tools such as volume-based indicators, price action, fundamental research, and macroeconomic analysis in their decision-making process.
Always test any new strategies in a simulated or paper trading environment before applying them to real markets. Remember to consult with a licensed financial professional if you’re unsure whether trading is suitable for your financial situation.
Key Benefits
Enhanced flexibility with customizable RSI settings.
Clear visualization of momentum across short, medium, and long-term timeframes.
Helps traders avoid tunnel vision by providing a multi-timeframe perspective.
Final Note
The RSI 3 Time Frames Indicator is a powerful, easy-to-use tool for traders who want to leverage RSI across multiple timeframes to pinpoint high-probability setups. Customize the settings based on your strategy and use this as a companion tool for your overall trading system.
We hope you enjoy using this indicator to improve your trading and analysis! Happy trading! 😊

RSI Dynamic Bands█ OVERVIEW
The "RSI Dynamic Bands" indicator is a variant of the Relative Strength Index (RSI) oscillator that brings its signals directly onto the price chart. It displays dynamic bands around the price, adjusted based on RSI levels, enabling easy identification of potential overbought or oversold conditions. The indicator also integrates a multi-timeframe RSI table, facilitating the analysis of trend strength across different timeframes.
█ CONCEPTS
The "RSI Dynamic Bands" indicator is designed to simplify the interpretation of price levels in the context of support and resistance zones, which can be correlated with other technical indicators and RSI values. Since the price itself does not display RSI values, a table showing RSI for four selected timeframes has been added, allowing traders to quickly assess trend strength across different time intervals. The most effective approach is to combine the indicator with other technical analysis tools, such as Fibonacci levels or pivot points, to confirm signals when the price approaches the bands and RSI values indicate a potential reversal.
Band Calculation
The bands are calculated based on the current closing price and RSI values, incorporating dynamic scaling to better adapt to market conditions. The formulas for the bands are as follows:
• Upper Band: close + (rsiUpper - rsi) * scaleFactor, where rsiUpper is the upper RSI level (default: 70), and scaleFactor accounts for market volatility.
• Lower Band: close + (rsiLower - rsi) * scaleFactor, where rsiLower is the lower RSI level (default: 30).
• Midline: The arithmetic average of the upper and lower bands: (upperBand + lowerBand) / 2.
Why Scaling? Without scaling, the bands would be chaotic and jagged, making them difficult to interpret. Scaling smooths the bands, making them wider during periods of high volatility and narrower during consolidation, better reflecting potential support and resistance levels.
Indicator Features
• Dynamic Price Bands: The bands adapt to market conditions, facilitating the identification of key price levels.
• Multi-Timeframe RSI Table: Displays RSI values for four selected timeframes (default: 15m, 1h, 4h, Daily), enabling comparison of trend strength across different perspectives.
• Style Customization: Users can adjust band colors, line thickness, and toggle the visibility of bands, fills, and the table.
How to Set Up the Indicator
1 — Add the "RSI Dynamic Bands" indicator to your TradingView chart.
2 — Configure parameters in the settings, such as RSI length, upper/lower levels, and scaling multiplier, to match your trading style.
3 — Enable or disable the display of bands, fills, or the RSI table based on your needs.
4 — Adjust band and table colors in the input section and line thickness in the "Style" section to better align the indicator with your chart.
█ OTHER SECTIONS
FEATURES
• RSI Length: The period for calculating RSI (default: 14).
• RSI Levels: Thresholds for overbought (default: 70) and oversold (default: 30).
• Scaling Multiplier: Adjusts bands based on market volatility (default: 0.15).
• Table Timeframes: Select four timeframes for the RSI table (default: 15m, 1h, 4h, Daily).
• Style Options: Customize band colors, fills, table, and line thickness.
HOW TO USE
Add the indicator to your chart, configure the parameters, and observe price interactions with the bands to identify potential entry and exit points. The RSI table allows you to compare RSI values across different timeframes, aiding in trading decisions. The most effective approach is to combine the indicator with other technical analysis tools, such as Fibonacci levels or pivot points, to confirm signals when the price approaches the bands and RSI values indicate a potential reversal.
Trading Strategies:
• Scalping: Use lower timeframes (e.g., 5m, 15m) in the RSI table to quickly identify short-term lows and highs. Wait for the price to approach the lower band in the RSI oversold zone, with RSI on lower timeframes starting to rise, and other tools, such as Fibonacci levels (e.g., 38.2%) or pivot points, confirming support.
• Medium-Term Trading: Focus on 1h and 4h timeframes. Look for confirmation of a low on a lower timeframe (e.g., 1h), where RSI indicates oversold conditions or starts rising, then check if RSI on a higher timeframe (e.g., 4h) confirms the trend. Confirmation from other tools, such as a Fibonacci level (e.g., 50%) or pivot point near the bands, strengthens the signal.
• Long-Term Trading: Use Daily and higher timeframes (e.g., Weekly). Wait for all relevant timeframes to confirm a low (e.g., RSI near oversold and price at the lower band), with lower timeframes (e.g., 4h) showing rising RSI. Other tools, such as Fibonacci levels (e.g., 61.8%) or pivot points near the bands, can further confirm a trend reversal signal.
