RSI+ by Wilson (alt)Extension of the excellent RSI+ script by Wilsonlibero. I tweaked the parameters to better fit crypto markets, and I added a few more visuals, such as midline, overbought/oversold threshold lines and areas, background coloration depending on RSI trend above or below midline, and a few other tweaks especially colors (fixed the transp parameter deprecation for example). The color theme is by default more optimized for dark mode charts, but all colors can be configured, and all drawings can be enabled/disabled/tweaked in the parameters.
I'm just giving back to the community since I could modify this script only because it was open-source. If you like this script, please don't give me any credit, but please show some love to the original author Wilsonlibero:
Cerca negli script per "rsi"

RSI with Divergences, Reverse Formulas, and Bull/Bear ZonesRegular RSI indicator that can underline divergences, turn green or red specifying user specified bull/bear zones, and with a label showing the price needed to turn bull/bear!
Specify the inputs:
+ RSI Length
+ Bull Threshold
+ Bear Threshold
+ Panel Position Offset
Also with toggle-able:
+ Bullish Divergence
+ Bearish Divergence
+ Hidden Bullish Divergence
+ Hidden Bearish Divergence
The zones included in the indicator are default and not meant to be used for all markets. The goal is to alter the bull/bear zones to find good breakout points and selloff points for your chosen security. Does not currently support automatic zone creation, or saving zones for each security (if that is even possible, may just need to create different layouts for each security).
Thanks!

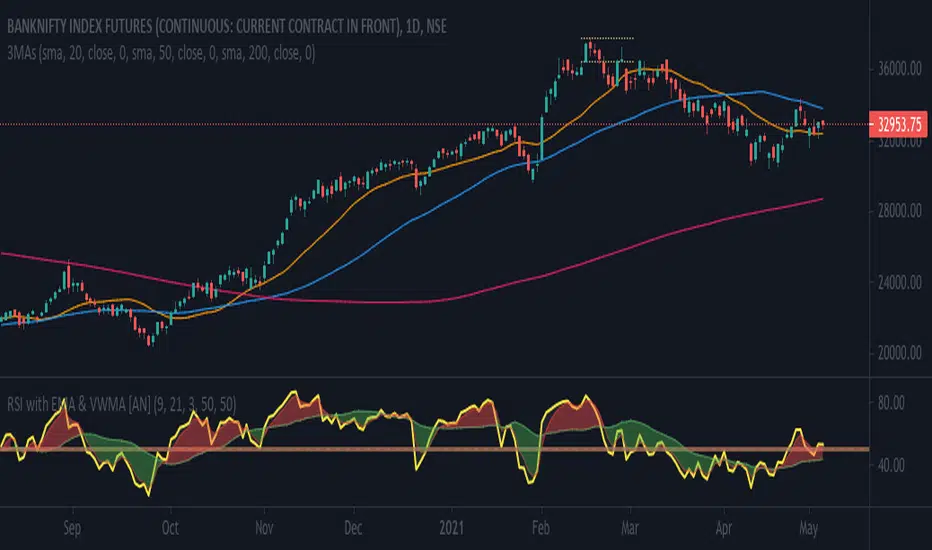
RSI with WMA & EMA [AN]Key Factors traced
- Price: EMA (Exponential Moving Average)
- Volume: WMA (Weighted Moving Avg.)
- Strength (Momentum): RSI (Relative Strength Indicator)
Default parameters
1. RSI at 9. Over brought & Under sold to 50 to be used as a median. This can be altered to the traditional 70:30 or 60:40
2. WMA at 21
3. EMA at 3, Exponential for Intraday trades
RSI with Moving Averages[UO]This RSI indicator is one of my favorite indicators. This powerful indicator is implemented by Phi-Deltalytics. I modified the drawing so that it is easier (at least for me) to see the signals and trends (it would not matter if you're doing algorithmic trading).
Trends and signals. For detailed instructions and tutorial see Phi-Deltalytics page

RSI+OBVthis strategy works on the basis of crossovers of RSI at different period and OBV at different periods (separately). I am using it for Nifty and Bank Nifty. Entry for long can be taken when green bar appears; and exit has to be done when it disappears. Entry for short has to be taken when red bar appears; and exit has to be done when it disappears.
With little help from price action good results can be achieved.

RSI mid partition color changeWhen RSI is above 50 our default bias is on buy side and when below 50 our bias is on sell side.
Therefore created 2 zones for easy identification.

RSI IRSI in morer easy format ,
so buy signal can be either cross of black line over lower=35 ' seen in green cross
or when black line cross up the base line=yellow .
opposite when black line cross down the upper =70 seen in red cross
or black cross down the basline in yelllow

RSI 1H/4H Multi-Level (REPAINT) - Hourly LimitRSI 1H/4H Multi-Level (REPAINT) – Hourly Limit is a Pine Script v5 indicator designed to monitor RSI level crossings on two higher timeframes (1H and 4H) while controlling alert frequency to avoid spam. The script can display visual dots on the chart and trigger a single consolidated alert message when either timeframe’s RSI crosses user-defined levels—limited to once per hour.
Key features
1) Dual timeframe RSI monitoring (1H + 4H)
Calculates RSI on 1-hour (60) and 4-hour (240) timeframes independently.
Each timeframe has its own configurable settings:
RSI Length
Lower level (commonly oversold, e.g., 30)
Upper level (commonly overbought, e.g., 70)
Dot color for chart marking
2) Multi-level cross detection
The indicator tracks when RSI crosses either boundary level:
1H RSI crosses its Lower or Upper level
4H RSI crosses its Lower or Upper level
A trigger occurs if any of these crossings happens.
3) Hourly alert limiter (anti-spam)
To prevent repeated alerts, the script includes an hourly cooldown:
It stores the start time of the last hour when an alert was fired.
A new alert can only fire when the current hour start time is greater than the last recorded one.
Result: maximum 1 alert per hour, even if multiple crossings occur within the same hour.
4) Consolidated alert message
When triggered, the script builds a single message that can include:
1H RSI value if the 1H crossing occurred
4H RSI value if the 4H crossing occurred
Example message format:
1H RSI (52.34) crossed level; 4H RSI (48.10) crossed level;
5) On-chart visualization with priority coloring
If enabled, the script plots a dot below the bar on trigger:
White dot if both 1H and 4H signals fired in the same hour
1H color if only 1H fired
4H color if only 4H fired
Important note: REPAINT behavior
This indicator intentionally uses request.security(..., lookahead=barmerge.lookahead_on), meaning it can repaint because it references higher-timeframe data with lookahead enabled. As a result:
Cross signals may appear earlier than they would in a non-repainting implementation.
Signals can change as the higher timeframe candle evolves.
Typical use cases
Monitoring overbought/oversold zone transitions on higher timeframes while trading lower timeframes.
Receiving fewer, cleaner alerts thanks to the hourly limit.
Quickly identifying whether a signal came from 1H, 4H, or both using dot colors.

WaveTrend With Divs & RSI(STOCH) Divs by WeloTradesWaveTrend with Divergences & RSI(STOCH) Divergences by WeloTrades
Overview
The "WaveTrend With Divergences & RSI(STOCH) Divergences" is an advanced Pine Script™ indicator designed for TradingView, offering a multi-dimensional analysis of market conditions. This script integrates several technical indicators—WaveTrend, Money Flow Index (MFI), RSI, and Stochastic RSI—into a cohesive tool that identifies both regular and hidden divergences across these indicators. These divergences can indicate potential market reversals and provide critical trading opportunities.
This indicator is not just a simple combination of popular tools; it offers extensive customization options, organized data presentation, and valuable trading signals that are easy to interpret. Whether you're a day trader or a long-term investor, this script enhances your ability to make informed decisions.
Originality and Usefulness
The originality of this script lies in its integration and the synergy it creates among the indicators used. Rather than merely combining multiple indicators, this script allows them to work together, enhancing each other's strengths. For example, by identifying divergences across WaveTrend, RSI, and Stochastic RSI simultaneously, the script provides multiple layers of confirmation, which reduces the likelihood of false signals and increases the reliability of trading signals.
The usefulness of this script is apparent in its ability to offer a consolidated view of market dynamics. It not only simplifies the analytical process by combining different indicators but also provides deeper insights through its divergence detection features. This comprehensive approach is designed to help traders identify potential market reversals, confirm trends, and ultimately make more informed trading decisions.
How the Components Work Together
1. Cross-Validation of Signals
WaveTrend: This indicator is primarily used to identify overbought and oversold conditions, as well as potential buy and sell signals. WaveTrend's ability to smooth price data and reduce noise makes it a reliable tool for identifying trend reversals.
RSI & Stochastic RSI: These momentum oscillators are used to measure the speed and change of price movements. While RSI identifies general overbought and oversold conditions, Stochastic RSI offers a more granular view by tracking the RSI’s level relative to its high-low range over a period of time. When these indicators align with WaveTrend signals, it adds a layer of confirmation that enhances the reliability of the signals.
Money Flow Index (MFI): This volume-weighted indicator assesses the inflow and outflow of money in an asset, giving insights into buying and selling pressure. By analyzing the MFI alongside WaveTrend and RSI indicators, the script can cross-validate signals, ensuring that buy or sell signals are supported by actual market volume.
Example Bullish scenario:
When a bullish divergence is detected on the RSI and confirmed by a corresponding bullish signal on the WaveTrend, along with an increasing Money Flow Index, the probability of a successful trade setup increases. This cross-validation minimizes the risk of acting on false signals, which might occur when relying on a single indicator.
Example Bearish scenario:
When a bearish divergence is detected on the RSI and confirmed by a corresponding bearish signal on the WaveTrend, along with an decreasing Money Flow Index, the probability of a successful trade setup increases. This cross-validation minimizes the risk of acting on false signals, which might occur when relying on a single indicator.
2. Divergence Detection and Market Reversals
Regular Divergences: Occur when the price action and an indicator (like RSI or WaveTrend) move in opposite directions. Regular bullish divergence signals a potential upward reversal when the price makes a lower low while the indicator makes a higher low. Conversely, regular bearish divergence suggests a downward reversal when the price makes a higher high, but the indicator makes a lower high.
Hidden Divergences: These occur when the price action and indicator move in the same direction, but with different momentum. Hidden bullish divergence suggests the continuation of an uptrend, while hidden bearish divergence suggests the continuation of a downtrend. By detecting these divergences across multiple indicators, the script identifies potential trend reversals or continuations with greater accuracy.
Example: The script might detect a regular bullish divergence on the WaveTrend while simultaneously identifying a hidden bullish divergence on the RSI. This combination suggests that while a trend reversal is possible, the overall market sentiment remains bullish, providing a nuanced view of the market.
A Regular Bullish Divergence Example:
A Hidden Bullish Divergence Example:
A Regular Bearish Divergence Example:
A Hidden Bearish Divergence Example:
3. Trend Strength and Sentiment Analysis
WaveTrend: Measures the strength and direction of the trend. By identifying the extremes of market sentiment (overbought and oversold levels), WaveTrend provides early signals for potential reversals.
Money Flow Index (MFI): Assesses the underlying sentiment by analyzing the flow of money. A rising MFI during an uptrend confirms strong buying pressure, while a falling MFI during a downtrend confirms selling pressure. This helps traders assess whether a trend is likely to continue or reverse.
RSI & Stochastic RSI: Offer a momentum-based perspective on the trend’s strength. High RSI or Stochastic RSI values indicate that the asset may be overbought, suggesting a potential reversal. Conversely, low values indicate oversold conditions, signaling a possible upward reversal.
Example:
During a strong uptrend, the WaveTrend & RSI's might signal overbought conditions, suggesting caution. If the MFI also shows decreasing buying pressure and the RSI reaches extreme levels, these indicators together suggest that the trend might be weakening, and a reversal could be imminent.
Example:
During a strong downtrend, the WaveTrend & RSI's might signal oversold conditions, suggesting caution. If the MFI also shows increasing buying pressure and the RSI reaches extreme levels, these indicators together suggest that the trend might be weakening, and a reversal could be imminent.
Conclusion
The "WaveTrend With Divergences & RSI(STOCH) Divergences" script offers a powerful, integrated approach to technical analysis by combining trend, momentum, and sentiment indicators into a single tool. Its unique value lies in the cross-validation of signals, the ability to detect divergences, and the comprehensive view it provides of market conditions. By offering traders multiple layers of analysis and customization options, this script is designed to enhance trading decisions, reduce false signals, and provide clearer insights into market dynamics.
WAVETREND
Display of WaveTrend:
Display of WaveTrend Setting:
WaveTrend Indicator Explanation
The WaveTrend indicator helps identify overbought and oversold conditions, as well as potential buy and sell signals. Its flexibility allows traders to adapt it to various strategies, making it a versatile tool in technical analysis.
WaveTrend Input Settings:
WT MA Source: Default: HLC3
What it is: The data source used for calculating the WaveTrend Moving Average.
What it does: Determines the input data to smooth price action and filter noise.
Example: Using HLC3 (average of High, Low, Close) provides a smoother data representation compared to using just the closing price.
Length (WT MA Length): Default: 3
What it is: The period used to calculate the Moving Average.
What it does: Adjusts the sensitivity of the WaveTrend indicator, where shorter lengths respond more quickly to price changes.
Example: A length of 3 is ideal for short-term analysis, providing quick reactions to price movements.
WT Channel Length & Average: Default: WT Channel Length = 9, Average = 12
What it is: Lengths used to calculate the WaveTrend channel and its average.
What it does: Smooths out the WaveTrend further, reducing false signals by averaging over a set period.
Example: Higher values reduce noise and help in identifying more reliable trends.
Channel: Style, Width, and Color:
What it is: Customization options for the WaveTrend channel's appearance.
What it does: Adjusts how the channel is displayed, including line style, width, and color.
Example: Choosing an area style with a distinct color can make the WaveTrend indicator clearly visible on the chart.
WT Buy & Sell Signals:
What it is: Settings to enable and customize buy and sell signals based on WaveTrend.
What it does: Allows for the display of buy/sell signals and customization of their shapes and colors.
When it gives a Buy Signal: Generated when the WaveTrend line crosses below an oversold level and then rises back, indicating a potential upward price movement.
When it gives a Sell Signal: Triggered when the WaveTrend line crosses above an overbought level and then declines, suggesting a possible downward trend.
Example: The script identifies these signals based on mean reversion principles, where prices tend to revert to the mean after reaching extremes. Traders can use these signals to time their entries and exits effectively.
WAVETREND OVERBOUGTH AND OVERSOLD LEVELS
Display of WaveTrend with Overbought & Oversold Levels:
Display of WaveTrend Overbought & Oversold Levels Settings:
WaveTrend Overbought & Oversold Levels Explanation
WT OB & OS Levels: Default: OB Level 1 = 53, OB Level 2 = 60, OS Level 1 = -53, OS Level 2 = -60
What it is: The default overbought and oversold levels used by the WaveTrend indicator to signal potential market reversals.
What it does: When the WaveTrend crosses above the OB levels, it indicates an overbought condition, potentially signaling a reversal or selling opportunity. Conversely, when it crosses below the OS levels, it indicates an oversold condition, potentially signaling a reversal or buying opportunity.
Example: A trader might use these levels to time entry or exit points, such as selling when the WaveTrend crosses into the overbought zone or buying when it crosses into the oversold zone.
Show OB/OS Levels: Default: True
What it is: Toggle options to show or hide the overbought and oversold levels on your chart.
What it does: When enabled, these levels will be visually represented on your chart, helping you to easily identify when the market reaches these critical thresholds.
Example: Displaying these levels can help you quickly see when the WaveTrend is approaching or has crossed into overbought or oversold territory, allowing for more informed trading decisions.
Line Style, Width, and Color for OB/OS Levels:
What it is: Options to customize the appearance of the OB and OS levels on your chart, including line style (solid, dotted, dashed), line width, and color.
What it does: These settings allow you to adjust how prominently these levels are displayed on your chart, which can help you better visualize and respond to overbought or oversold conditions.
Example: Setting a thicker, dashed line in a contrasting color can make these levels stand out more clearly, aiding in quick visual identification.
Example of Use:
Scenario: A trader wants to identify potential selling points when the market is overbought. They set the OB levels at 53 and 60, choosing a solid, red line style to make these levels clear on their chart. As the WaveTrend crosses above 53, they monitor for further price action, and upon crossing 60, they consider initiating a sell order.
WAVETREND DIVERGENCES
Display of WaveTrend Divergence:
Display of WaveTrend Divergence Setting:
WaveTrend Divergence Indicator Explanation
The WaveTrend Divergence feature helps identify potential reversal points in the market by highlighting divergences between the price and the WaveTrend indicator. Divergences can signal a shift in market momentum, indicating a possible trend reversal. This component allows traders to visualize and customize divergence detection on their charts.
WaveTrend Divergence Input Settings:
Potential Reversal Range: Default: 28
What it is: The number of bars to look back when detecting potential tops and bottoms.
What it does: Sets the range for identifying possible reversal points based on historical data.
Example: A setting of 28 looks back across the last 28 bars to find reversal points, offering a balance between responsiveness and reliability.
Reversal Minimum LVL OB & OS: Default: OB = 35, OS = -35
What it is: The minimum overbought and oversold levels required for detecting potential reversals.
What it does: Adjusts the thresholds that trigger a reversal signal based on the WaveTrend indicator.
Example: A higher OB level reduces the sensitivity to overbought conditions, potentially filtering out false reversal signals.
Lookback Bar Left & Right: Default: Left = 10, Right = 1
What it is: The number of bars to the left and right used to confirm a top or bottom.
What it does: Helps determine the position of peaks and troughs in the price action.
Example: A larger left lookback captures more extended price action before the peak, while a smaller right lookback focuses on the immediate past.
Lookback Range Min & Max: Default: Min = 5, Max = 60
What it is: The minimum and maximum range for the lookback period when identifying divergences.
What it does: Fine-tunes the detection of divergences by controlling the range over which the indicator looks back.
Example: A wider range increases the chances of detecting divergences across different market conditions.
R.Div Minimum LVL OB & OS: Default: OB = 53, OS = -53
What it is: The threshold levels for detecting regular divergences.
What it does: Adjusts the sensitivity of the regular divergence detection.
Example: Higher thresholds make the detection more conservative, identifying only stronger divergence signals.
H.Div Minimum LVL OB & OS: Default: OB = 20, OS = -20
What it is: The threshold levels for detecting hidden divergences.
What it does: Similar to regular divergence settings but for hidden divergences, which can indicate potential reversals that are less obvious.
Example: Lower thresholds make the hidden divergence detection more sensitive, capturing subtler market shifts.
Divergence Label Options:
What it is: Options to display and customize labels for regular and hidden divergences.
What it does: Allows users to visually differentiate between regular and hidden divergences using customizable labels and colors.
Example: Using different colors and symbols for regular (R) and hidden (H) divergences makes it easier to interpret signals on the chart.
Text Size and Color:
What it is: Customization options for the size and color of divergence labels.
What it does: Adjusts the readability and visibility of divergence labels on the chart.
Example: Larger text size may be preferred for charts with a lot of data, ensuring divergence labels stand out clearly.
FAST & SLOW MONEY FLOW INDEX
Display of Fast & Slow Money Flow:
Display of Fast & Slow Money Flow Setting:
Fast Money Flow Indicator Explanation
The Fast Money Flow indicator helps traders identify the flow of money into and out of an asset over a shorter time frame. By tracking the volume-weighted average of price movements, it provides insights into buying and selling pressure in the market, which can be crucial for making timely trading decisions.
Fast Money Flow Input Settings:
Fast Money Flow: Length: Default: 9
What it is: The period used for calculating the Fast Money Flow.
What it does: Determines the sensitivity of the Money Flow calculation. A shorter length makes the indicator more responsive to recent price changes, while a longer length provides a smoother signal.
Example: A length of 9 is suitable for traders looking to capture quick shifts in market sentiment over a short period.
Fast MFI Area Multiplier: Default: 5
What it is: A multiplier applied to the Money Flow area calculation.
What it does: Adjusts the size of the Money Flow area on the chart, effectively amplifying or reducing the visual impact of the indicator.
Example: A higher multiplier can make the Money Flow more prominent on the chart, aiding in the quick identification of significant money flow changes.
Y Position (Y Pos): Default: 0
What it is: The vertical position adjustment for the Fast Money Flow plot on the chart.
What it does: Allows you to move the Money Flow plot up or down on the chart to avoid overlap with other indicators.
Example: Adjusting the Y Position can be useful if you have multiple indicators on the chart and need to maintain clarity.
Fast MFI Style, Width, and Color:
What it is: Customization options for how the Fast Money Flow is displayed on the chart.
What it does: Enables you to choose between different plot styles (line or area), set the line width, and select colors for positive and negative money flow.
Example: Using different colors for positive (green) and negative (red) money flow helps to visually distinguish between periods of buying and selling pressure.
Slow Money Flow Indicator Explanation
The Slow Money Flow indicator tracks the flow of money into and out of an asset over a longer time frame. It provides a broader perspective on market sentiment, smoothing out short-term fluctuations and highlighting longer-term trends.
Slow Money Flow Input Settings:
Slow Money Flow: Length: Default: 12
What it is: The period used for calculating the Slow Money Flow.
What it does: A longer period smooths out short-term fluctuations, providing a clearer view of the overall money flow trend.
Example: A length of 12 is often used by traders looking to identify sustained trends rather than short-term volatility.
Slow MFI Area Multiplier: Default: 5
What it is: A multiplier applied to the Slow Money Flow area calculation.
What it does: Adjusts the size of the Money Flow area on the chart, helping to emphasize the indicator’s significance.
Example: Increasing the multiplier can help highlight the Money Flow in markets with less volatile price action.
Y Position (Y Pos): Default: 0
What it is: The vertical position adjustment for the Slow Money Flow plot on the chart.
What it does: Allows for vertical repositioning of the Money Flow plot to maintain chart clarity when used with other indicators.
Example: Adjusting the Y Position ensures that the Slow Money Flow indicator does not overlap with other key indicators on the chart.
Slow MFI Style, Width, and Color:
What it is: Customization options for the visual display of the Slow Money Flow on the chart.
What it does: Allows you to choose the plot style (line or area), set the line width, and select colors to differentiate positive and negative money flow.
Example: Customizing the colors for the Slow Money Flow allows traders to quickly distinguish between buying and selling trends in the market.
RSI
Display of RSI:
Display of RSI Setting:
RSI Indicator Explanation
The Relative Strength Index (RSI) is a momentum oscillator that measures the speed and change of price movements. It is typically used to identify overbought or oversold conditions in the market, providing traders with potential signals for buying or selling.
RSI Input Settings:
RSI Source: Default: Close
What it is: The data source used for calculating the RSI.
What it does: Determines which price data (e.g., close, open) is used in the RSI calculation, affecting how the indicator reflects market conditions.
Example: Using the closing price is standard practice, as it reflects the final agreed-upon price for a given time period.
MA Type (Moving Average Type): Default: SMA
What it is: The type of moving average applied to the RSI for smoothing purposes.
What it does: Changes the smoothing technique of the RSI, impacting how quickly the indicator responds to price movements.
Example: Using an Exponential Moving Average (EMA) will make the RSI more sensitive to recent price changes compared to a Simple Moving Average (SMA).
RSI Length: Default: 14
What it is: The period over which the RSI is calculated.
What it does: Adjusts the sensitivity of the RSI. A shorter length (e.g., 7) makes the RSI more responsive to recent price changes, while a longer length (e.g., 21) smooths out the indicator, reducing the number of signals.
Example: A 14-period RSI is commonly used for identifying overbought and oversold conditions, providing a balance between sensitivity and reliability.
RSI Plot Style, Width, and Color:
What it is: Options to customize the appearance of the RSI line on the chart.
What it does: Allows you to adjust the visual representation of the RSI, including the line width and color.
Example: Setting a thicker line width and a bright color like yellow can make the RSI more visible on the chart, aiding in quick analysis.
Display of RSI with RSI Moving Average:
RSI Moving Average Explanation
The RSI Moving Average adds a smoothing layer to the RSI, helping to filter out noise and provide clearer signals. It is particularly useful for confirming trend strength and identifying potential reversals.
RSI Moving Average Input Settings:
MA Length: Default: 14
What it is: The period over which the Moving Average is calculated on the RSI.
What it does: Adjusts the smoothing of the RSI, helping to reduce false signals and provide a clearer trend indication.
Example: A 14-period moving average on the RSI can smooth out short-term fluctuations, making it easier to spot genuine overbought or oversold conditions.
MA Plot Style, Width, and Color:
What it is: Customization options for how the RSI Moving Average is displayed on the chart.
What it does: Allows you to adjust the line width and color, helping to differentiate the Moving Average from the main RSI line.
Example: Using a contrasting color for the RSI Moving Average (e.g., magenta) can help it stand out against the main RSI line, making it easier to interpret the indicator.
STOCHASTIC RSI
Display of Stochastic RSI:
Display of Stochastic RSI Setting:
Stochastic RSI Indicator Explanation
The Stochastic RSI (Stoch RSI) is a momentum oscillator that measures the level of the RSI relative to its high-low range over a set period of time. It is used to identify overbought and oversold conditions, providing potential buy and sell signals based on momentum shifts.
Stochastic RSI Input Settings:
Stochastic RSI Length: Default: 14
What it is: The period over which the Stochastic RSI is calculated.
What it does: Adjusts the sensitivity of the Stochastic RSI. A shorter length makes the indicator more responsive to recent price changes, while a longer length smooths out the fluctuations, reducing noise.
Example: A length of 14 is commonly used to identify momentum shifts over a medium-term period, providing a balanced view of potential overbought or oversold conditions.
Display of Stochastic RSI %K Line:
Stochastic RSI %K Line Explanation
The %K line in the Stochastic RSI is the main line that tracks the momentum of the RSI over the chosen period. It is the faster-moving component of the Stochastic RSI, often used to identify entry and exit points.
Stochastic RSI %K Input Settings:
%K Length: Default: 3
What it is: The period used for smoothing the %K line of the Stochastic RSI.
What it does: Smoothing the %K line helps reduce noise and provides a clearer signal for potential market reversals.
Example: A smoothing length of 3 is common, offering a balance between responsiveness and noise reduction, making it easier to spot significant momentum shifts.
%K Plot Style, Width, and Color:
What it is: Customization options for the visual representation of the %K line.
What it does: Allows you to adjust the appearance of the %K line on the chart, including line width and color, to fit your visual preferences.
Example: Setting a blue color and a medium width for the %K line makes it stand out clearly on the chart, helping to identify key points of momentum change.
%K Fill Color (Above):
What it is: The fill color that appears above the %K line on the chart.
What it does: Adds visual clarity by shading the area above the %K line, making it easier to interpret the direction and strength of momentum.
Example: Using a light blue fill color above the %K line can help emphasize bullish momentum, making it visually prominent.
Display of Stochastic RSI %D Line:
Stochastic RSI %D Line Explanation
The %D line in the Stochastic RSI is a moving average of the %K line and acts as a signal line. It is slower-moving compared to the %K line and is often used to confirm signals or identify potential reversals when it crosses the %K line.
Stochastic RSI %D Input Settings:
%D Length: Default: 3
What it is: The period used for smoothing the %D line of the Stochastic RSI.
What it does: Smooths out the %D line, making it less sensitive to short-term fluctuations and more reliable for identifying significant market signals.
Example: A length of 3 is often used to provide a smoothed signal line that can help confirm trends or reversals indicated by the %K line.
%D Plot Style, Width, and Color:
What it is: Customization options for the visual representation of the %D line.
What it does: Allows you to adjust the appearance of the %D line on the chart, including line width and color, to match your preferences.
Example: Setting an orange color and a thicker line width for the %D line can help differentiate it from the %K line, making crossover points easier to spot.
%D Fill Color (Below):
What it is: The fill color that appears below the %D line on the chart.
What it does: Adds visual clarity by shading the area below the %D line, making it easier to interpret bearish momentum.
Example: Using a light orange fill color below the %D line can highlight bearish conditions, making it visually easier to identify.
RSI & STOCHASTIC RSI OVERBOUGHT AND OVERSOLD LEVELS
Display of RSI & Stochastic with Overbought & Oversold Levels:
Display of RSI & Stochastic Overbought & Oversold Settings:
RSI & Stochastic Overbought & Oversold Levels Explanation
The Overbought (OB) and Oversold (OS) levels for RSI and Stochastic RSI indicators are key thresholds that help traders identify potential reversal points in the market. These levels are used to determine when an asset is likely overbought or oversold, which can signal a potential trend reversal.
RSI & Stochastic Overbought & Oversold Input Settings:
RSI & Stochastic Level 1 Overbought (OB) & Oversold (OS): Default: OB Level = 170, OS Level = 130
What it is: The first set of thresholds for determining overbought and oversold conditions for both RSI and Stochastic RSI indicators.
What it does: When the RSI or Stochastic RSI crosses above the overbought level, it suggests that the asset might be overbought, potentially signaling a sell opportunity. Conversely, when these indicators drop below the oversold level, it suggests the asset might be oversold, potentially signaling a buy opportunity.
Example: If the RSI crosses above 170, traders might look for signs of a potential trend reversal to the downside, while a cross below 130 might indicate a reversal to the upside.
RSI & Stochastic Level 2 Overbought (OB) & Oversold (OS): Default: OB Level = 180, OS Level = 120
What it is: The second set of thresholds for determining overbought and oversold conditions for both RSI and Stochastic RSI indicators.
What it does: These levels provide an additional set of reference points, allowing traders to differentiate between varying degrees of overbought and oversold conditions, potentially leading to more refined trading decisions.
Example: When the RSI crosses above 180, it might indicate an extreme overbought condition, which could be a stronger signal for a sell, while a cross below 120 might indicate an extreme oversold condition, which could be a stronger signal for a buy.
RSI & Stochastic Overbought (OB) Band Customization:
OB Level 1: Width, Style, and Color:
What it is: Customization options for the visual appearance of the first overbought band on the chart.
What it does: Allows you to set the line width, style (solid, dotted, dashed), and color for the first overbought band, enhancing its visibility on the chart.
Example: A dashed red line with medium width can clearly indicate the first overbought level, helping traders quickly identify when this threshold is crossed.
OB Level 2: Width, Style, and Color:
What it is: Customization options for the visual appearance of the second overbought band on the chart.
What it does: Allows you to set the line width, style, and color for the second overbought band, providing a clear distinction from the first band.
Example: A dashed red line with a slightly thicker width can represent a more significant overbought level, making it easier to differentiate from the first level.
RSI & Stochastic Oversold (OS) Band Customization:
OS Level 1: Width, Style, and Color:
What it is: Customization options for the visual appearance of the first oversold band on the chart.
What it does: Allows you to set the line width, style (solid, dotted, dashed), and color for the first oversold band, making it visually prominent.
Example: A dashed green line with medium width can highlight the first oversold level, helping traders identify potential buying opportunities.
OS Level 2: Width, Style, and Color:
What it is: Customization options for the visual appearance of the second oversold band on the chart.
What it does: Allows you to set the line width, style, and color for the second oversold band, providing an additional visual cue for extreme oversold conditions.
Example: A dashed green line with a thicker width can represent a more significant oversold level, offering a stronger visual cue for potential buying opportunities.
RSI DIVERGENCES
Display of RSI Divergence Labels:
Display of RSI Divergence Settings:
RSI Divergence Lookback Explanation
The RSI Divergence settings allow traders to customize the parameters for detecting divergences between the RSI (Relative Strength Index) and price action. Divergences occur when the price moves in the opposite direction to the RSI, potentially signaling a trend reversal. These settings help refine the accuracy of divergence detection by adjusting the lookback period and range. ( NOTE: This setting only imply to the RSI. This doesn't effect the STOCHASTIC RSI. )
RSI Divergence Lookback Input Settings:
Lookback Left: Default: 10
What it is: The number of bars to look back from the current bar to detect a potential divergence.
What it does: Defines the left-side lookback period for identifying pivot points in the RSI, which are used to spot divergences. A longer lookback period may capture more significant trends but could also miss shorter-term divergences.
Example: A setting of 10 bars means the script will consider pivot points up to 10 bars before the current bar to check for divergence patterns.
Lookback Right: Default: 1
What it is: The number of bars to look forward from the current bar to complete the divergence pattern.
What it does: Defines the right-side lookback period for confirming a potential divergence. This setting helps ensure that the identified divergence is valid by allowing the script to check subsequent bars for confirmation.
Example: A setting of 1 bar means the script will look at the next bar to confirm the divergence pattern, ensuring that the signal is reliable.
Lookback Range Min: Default: 5
What it is: The minimum range of bars required to detect a valid divergence.
What it does: Sets a lower bound on the range of bars considered for divergence detection. A lower minimum range might capture more frequent but possibly less significant divergences.
Example: Setting the minimum range to 5 ensures that only divergences spanning at least 5 bars are considered, filtering out very short-term patterns.
Lookback Range Max: Default: 60
What it is: The maximum range of bars within which a divergence can be detected.
What it does: Sets an upper bound on the range of bars considered for divergence detection. A larger maximum range might capture more significant divergences but could also include less relevant long-term patterns.
Example: Setting the maximum range to 60 bars allows the script to detect divergences over a longer timeframe, capturing more extended divergence patterns that could indicate major trend reversals.
RSI Divergence Explanation
RSI divergences occur when the RSI indicator and price action move in opposite directions, signaling potential trend reversals. This section of the settings allows traders to customize the appearance and detection of both regular and hidden bullish and bearish divergences.
RSI Divergence Input Settings:
R. Bullish Div Label: Default: True
What it is: An option to display labels for regular bullish divergences.
What it does: Enables or disables the visibility of labels that mark regular bullish divergences, where the price makes a lower low while the RSI makes a higher low, indicating a potential upward reversal.
Example: A trader might use this to spot buying opportunities in a downtrend when a bullish divergence suggests the trend may be reversing.
Bullish Label Color, Line Width, and Line Color:
What it is: Settings to customize the appearance of regular bullish divergence labels.
What it does: Allows you to choose the color of the labels, adjust the width of the divergence lines, and select the color for these lines.
Example: Selecting a green label color and a distinct line width makes bullish divergences easily recognizable on your chart.
R. Bearish Div Label: Default: True
What it is: An option to display labels for regular bearish divergences.
What it does: Enables or disables the visibility of labels that mark regular bearish divergences, where the price makes a higher high while the RSI makes a lower high, indicating a potential downward reversal.
Example: A trader might use this to spot selling opportunities in an uptrend when a bearish divergence suggests the trend may be reversing.
Bearish Label Color, Line Width, and Line Color:
What it is: Settings to customize the appearance of regular bearish divergence labels.
What it does: Allows you to choose the color of the labels, adjust the width of the divergence lines, and select the color for these lines.
Example: Choosing a red label color and a specific line width makes bearish divergences clearly stand out on your chart.
H. Bullish Div Label: Default: False
What it is: An option to display labels for hidden bullish divergences.
What it does: Enables or disables the visibility of labels that mark hidden bullish divergences, where the price makes a higher low while the RSI makes a lower low, indicating potential continuation of an uptrend.
Example: A trader might use this to confirm an existing uptrend when a hidden bullish divergence signals continued buying strength.
Hidden Bullish Label Color, Line Width, and Line Color:
What it is: Settings to customize the appearance of hidden bullish divergence labels.
What it does: Allows you to choose the color of the labels, adjust the width of the divergence lines, and select the color for these lines.
Example: A softer green color with a thinner line width might be chosen to subtly indicate hidden bullish divergences, keeping the chart clean while providing useful information.
H. Bearish Div Label: Default: False
What it is: An option to display labels for hidden bearish divergences.
What it does: Enables or disables the visibility of labels that mark hidden bearish divergences, where the price makes a lower high while the RSI makes a higher high, indicating potential continuation of a downtrend.
Example: A trader might use this to confirm an existing downtrend when a hidden bearish divergence signals continued selling pressure.
Hidden Bearish Label Color, Line Width, and Line Color:
What it is: Settings to customize the appearance of hidden bearish divergence labels.
What it does: Allows you to choose the color of the labels, adjust the width of the divergence lines, and select the color for these lines.
Example: A muted red color with a thinner line width might be selected to indicate hidden bearish divergences without overwhelming the chart.
Divergence Text Size and Color: Default: S (Small)
What it is: Settings to adjust the size and color of text labels for RSI divergences.
What it does: Allows you to customize the size and color of text labels that display the divergence information on the chart.
Example: Choosing a small text size with a bright white color can make divergence labels easily readable without taking up too much space on the chart.
STOCHASTIC DIVERGENCES
Display of Stochastic RSI Divergence Labels:
Display of Stochastic RSI Divergence Settings:
Stochastic RSI Divergence Explanation
Stochastic RSI divergences occur when the Stochastic RSI indicator and price action move in opposite directions, signaling potential trend reversals. These settings allow traders to customize the detection and visual representation of both regular and hidden bullish and bearish divergences in the Stochastic RSI.
Stochastic RSI Divergence Input Settings:
R. Bullish Div Label: Default: True
What it is: An option to display labels for regular bullish divergences in the Stochastic RSI.
What it does: Enables or disables the visibility of labels that mark regular bullish divergences, where the price makes a lower low while the Stochastic RSI makes a higher low, indicating a potential upward reversal.
Example: A trader might use this to spot buying opportunities in a downtrend when a bullish divergence in the Stochastic RSI suggests the trend may be reversing.
Bullish Label Color, Line Width, and Line Color:
What it is: Settings to customize the appearance of regular bullish divergence labels in the Stochastic RSI.
What it does: Allows you to choose the color of the labels, adjust the width of the divergence lines, and select the color for these lines.
Example: Selecting a blue label color and a distinct line width makes bullish divergences in the Stochastic RSI easily recognizable on your chart.
R. Bearish Div Label: Default: True
What it is: An option to display labels for regular bearish divergences in the Stochastic RSI.
What it does: Enables or disables the visibility of labels that mark regular bearish divergences, where the price makes a higher high while the Stochastic RSI makes a lower high, indicating a potential downward reversal.
Example: A trader might use this to spot selling opportunities in an uptrend when a bearish divergence in the Stochastic RSI suggests the trend may be reversing.
Bearish Label Color, Line Width, and Line Color:
What it is: Settings to customize the appearance of regular bearish divergence labels in the Stochastic RSI.
What it does: Allows you to choose the color of the labels, adjust the width of the divergence lines, and select the color for these lines.
Example: Choosing an orange label color and a specific line width makes bearish divergences in the Stochastic RSI clearly stand out on your chart.
H. Bullish Div Label: Default: False
What it is: An option to display labels for hidden bullish divergences in the Stochastic RSI.
What it does: Enables or disables the visibility of labels that mark hidden bullish divergences, where the price makes a higher low while the Stochastic RSI makes a lower low, indicating potential continuation of an uptrend.
Example: A trader might use this to confirm an existing uptrend when a hidden bullish divergence in the Stochastic RSI signals continued buying strength.
Hidden Bullish Label Color, Line Width, and Line Color:
What it is: Settings to customize the appearance of hidden bullish divergence labels in the Stochastic RSI.
What it does: Allows you to choose the color of the labels, adjust the width of the divergence lines, and select the color for these lines.
Example: A softer blue color with a thinner line width might be chosen to subtly indicate hidden bullish divergences, keeping the chart clean while providing useful information.
H. Bearish Div Label: Default: False
What it is: An option to display labels for hidden bearish divergences in the Stochastic RSI.
What it does: Enables or disables the visibility of labels that mark hidden bearish divergences, where the price makes a lower high while the Stochastic RSI makes a higher high, indicating potential continuation of a downtrend.
Example: A trader might use this to confirm an existing downtrend when a hidden bearish divergence in the Stochastic RSI signals continued selling pressure.
Hidden Bearish Label Color, Line Width, and Line Color:
What it is: Settings to customize the appearance of hidden bearish divergence labels in the Stochastic RSI.
What it does: Allows you to choose the color of the labels, adjust the width of the divergence lines, and select the color for these lines.
Example: A muted orange color with a thinner line width might be selected to indicate hidden bearish divergences without overwhelming the chart.
Divergence Text Size and Color: Default: S (Small)
What it is: Settings to adjust the size and color of text labels for Stochastic RSI divergences.
What it does: Allows you to customize the size and color of text labels that display the divergence information on the chart.
Example: Choosing a small text size with a bright white color can make divergence labels easily readable without taking up too much space on the chart.
Alert System:
Custom Alerts for Divergences and Reversals:
What it is: The script includes customizable alert conditions to notify you of detected divergences or potential reversals based on WaveTrend, RSI, and Stochastic RSI.
What it does: Helps you stay informed of key market movements without constantly monitoring the charts, enabling timely decisions.
Example: Setting an alert for regular bearish divergence on the WaveTrend could notify you of a potential sell opportunity as soon as it is detected.
How to Use Alerts:
Set up custom alerts in TradingView based on these conditions to be notified of potential trading opportunities. Alerts are triggered when the indicator detects conditions that match the selected criteria, such as divergences or potential reversals.
By following the detailed guidelines and examples above, you can effectively use and customize this powerful indicator to suit your trading strategy.
For further understanding and customization, refer to the input settings within the script and adjust them to match your trading style and preferences.
How Components Work Together
Synergy and Cross-Validation: The indicator combines multiple layers of analysis to validate trading signals. For example, a WaveTrend buy signal that coincides with a bullish divergence in RSI and positive fast money flow is likely to be more reliable than any single indicator’s signal. This cross-validation reduces the likelihood of false signals and enhances decision-making.
Comprehensive Market Analysis: Each component plays a role in analyzing different aspects of the market. WaveTrend focuses on trend strength, Money Flow indicators assess market sentiment, while RSI and Stochastic RSI offer detailed views of price momentum and potential reversals.
Ideal For
Traders who require a reliable, multifaceted tool for detecting market trends and reversals.
Investors seeking a deeper understanding of market dynamics across different timeframes and conditions, whether in forex, equities, or cryptocurrency markets.
This script is designed to provide a comprehensive tool for technical analysis, combining multiple indicators and divergence detection into one versatile and customizable script. It is especially useful for traders who want to monitor various indicators simultaneously and look for convergence or divergence signals across different technical tools.
Acknowledgements
Special thanks to these amazing creators for inspiration and their creations:
I want to thank these amazing creators for creating there amazing indicators , that inspired me and also gave me a head start by making this indicator! Without their amazing indicators it wouldn't be possible!
vumanchu: VuManChu Cipher B Divergences.
MisterMoTa: RSI + Divergences + Alerts .
DevLucem: Plain Stochastic Divergence.
Note
This indicator is designed to be a powerful tool in your trading arsenal. However , it is essential to backtest and adjust the settings according to your trading strategy before applying it to live trading . If you have any questions or need further assistance, feel free to reach out.

RSI Profile [Kodexius]RSI Profile is an advanced technical indicator that turns the classic RSI into a distribution profile instead of a single oscillating line. Rather than only showing where the RSI is at the current bar, it displays where the RSI has spent most of its time or most of its volume over a user defined lookback period.
The script builds a histogram of RSI values between 0 and 100, splits that range into configurable bins, and then projects the result to the right side of the chart. This gives you a clear visual representation of the RSI structure, including the Point of Control (POC), the Value Area High (VAH), and the Value Area Low (VAL). The POC marks the RSI level with the highest activity, while VAH and VAL bracket the percentage based value area around it.
By combining standard RSI, a distribution profile, and value area logic, this tool lets you study RSI behavior statistically instead of only bar by bar. You can immediately see whether the current RSI reading is located inside the dominant zone, extended above it, or depressed below it, and whether the recent regime has been biased toward overbought, oversold, or neutral territory. This is particularly useful for swing traders, mean reversion systems, and anyone who wants to integrate RSI context into a more profile oriented workflow.
🔹 Features
1. RSI-Based Distribution Profile
-Builds a histogram of RSI values between 0 and 100.
-The RSI range is divided into a user-defined number of bins (e.g., 30 bins).
-Each bin represents a band of RSI values, such as 0–3.33, 3.33–6.66, ..., 96.66–100.
-For each bar in the lookback period, the script:
-Finds which bin the RSI value belongs to
Adds either:
-1.0 → if using time/frequency
-volume → if using volume-weighted RSI distribution
This creates a clear profile of where RSI has been concentrated over the chosen lookback window.
2. Time / Volume Weighting Mode
Under Profile Settings, you can choose:
-Weight by Volume = false
→ Profile is built using time spent at each RSI level (frequency).
-Weight by Volume = true
→ Profile is built using volume traded at each RSI level.
This flexibility allows you to decide whether you want:
-A pure momentum structure (time spent at each RSI)
-Or a participation-weighted structure (where higher-volume zones are emphasized)
3. Configurable Lookback & Resolution
-Profile Lookback: number of historical bars to analyze.
-Number of Bins: controls the resolution of the histogram:
Fewer bins → smoother, fewer gaps
More bins → more detail, but potentially more visual sparsity
-Profile Width (Bars): defines how wide the histogram extends into the future (visually), converted into time using average bar duration.
This provides a balance between performance, clarity, and visual density.
4. Value Area, POC, VAH, VAL
The script computes:
-POC (Point of Control)
→ The RSI bin with the highest total value (time or volume).
-Value Area (VA)
→ The range of RSI bins that contain a user-specified percentage of total activity (e.g., 70%).
-VAH & VAL
→ Upper and lower RSI boundaries of this Value Area.
These are then drawn as horizontal lines and labeled:
-POC line and label
-VAH line and label
-VAL line and label
This gives you a profile-style view similar to classical volume profile, but entirely on the RSI axis.
5. Color Coding & Visual Design
The histogram bars (boxes) are colored using a smart scheme:
-Below 30 RSI → Oversold zone, uses the Oversold Color (default: green).
-Above 70 RSI → Overbought zone, uses the Overbought Color (default: red).
-Between 30 and 70 RSI → Neutral zone, uses a gradient between:
A soft blue at lower mid levels
A soft orange at higher mid levels
Additional styling:
-POC bin is highlighted in bright yellow.
-Bins inside the Value Area → lower transparency (more solid).
-Bins outside the Value Area → higher transparency (faded).
This makes it easy to visually distinguish:
-Core RSI activity (VA)
-Extremes (oversold/overbought)
-The single dominant zone (POC)
🔹 Calculations
This section summarizes the core logic behind the script and highlights the main building blocks that power the profile.
1. Profile Structure and Bin Initialization
A custom Profile type groups together configuration, bins and drawing objects. During initialization, the script splits the 0 to 100 RSI range into evenly spaced bins, each represented by a Bin record:
method initBins(Profile p) =>
p.bins := array.new()
float step = 100.0 / p.binCount
for i = 0 to p.binCount - 1
float low = i * step
float high = (i + 1) * step
p.bins.push(Bin.new(low, high, 0.0, box(na)))
2. Filling the Profile Over the Lookback Window
On the last bar, the script clears previous drawings and walks backward through the selected lookback window. For each historical bar, it reads the RSI and volume series and feeds them into the profile:
if barstate.islast
myProfile.reset()
int start = math.max(0, bar_index - lookback)
int end = bar_index
for i = 0 to (end - start)
float r = rsi
float v = volume
if not na(r)
myProfile.add(r, v)
The add method converts each RSI value into a bin index and accumulates either a frequency count or the bar volume, depending on the chosen mode:
method add(Profile p, float rsiValue, float volumeValue) =>
int idx = int(rsiValue / (100.0 / p.binCount))
if idx >= p.binCount
idx := p.binCount - 1
if idx < 0
idx := 0
Bin targetBin = p.bins.get(idx)
float addedValue = p.useVolume ? volumeValue : 1.0
targetBin.value += addedValue
3. Finding POC and Building the Value Area
Inside the draw method, the script first scans all bins to determine the maximum value and the total sum. The bin with the highest value becomes the POC. The value area is then constructed by expanding from that center bin until the desired percentage of total activity is covered:
for in p.bins
totalVal += b.value
if b.value > maxVal
maxVal := b.value
pocIdx := i
float vaTarget = totalVal * (p.vaPercent / 100.0)
float currentVaVol = maxVal
int upIdx = pocIdx
int downIdx = pocIdx
while currentVaVol < vaTarget
float upVol = (upIdx < p.binCount - 1) ? p.bins.get(upIdx + 1).value : 0.0
float downVol = (downIdx > 0) ? p.bins.get(downIdx - 1).value : 0.0
if upVol == 0 and downVol == 0
break
if upVol >= downVol
upIdx += 1
currentVaVol += upVol
else
downIdx -= 1
currentVaVol += downVol

RSI ExtremesRSI Extremes — Educational Indicator (Pine v5)
Per-Tick Dual-RSI Extremes · Real-Time Visualization · Cooldown Logic
Overview
RSI Extremes is a real-time educational indicator built to show where the Relative Strength Index (RSI) reaches its most extreme levels during every tick of live price action.
Instead of using only the candle close, it continuously tracks both RSI(low) and RSI(high) to reveal how deeply each bar stretches into demand or supply extremes.
This tool is meant solely for study and visualization, helping you understand how RSI behaves intrabar when price wicks expand. It produces no signals, no alerts, and no trade suggestions — it’s a microscope for momentum pressure.
Core Idea
Standard RSI hides a lot of the wick-based stress in price because it calculates from close values only.
RSI Extremes solves this by splitting the measurement into two perspectives:
RSI of LOW (green) → shows how far momentum falls into potential demand exhaustion.
RSI of HIGH (red) → shows how far momentum extends into potential supply exhaustion.
Seeing both together exposes the full oscillation envelope — what RSI looks like between candle opens and closes, not just after the fact.
What Gets Plotted
RSI (Low) — green line representing intrabar downside pressure.
RSI (High) — red line representing intrabar upside pressure.
RSI Ghost (Smoothed) — gray line for soft context only.
Bands: 30 / 50 / 70 visual guides with a shaded 30–70 region.
Markers:
Enter marker when RSI(low) ≤ levelEnter (default 15).
Exit marker when RSI(high) ≥ levelExit (default 85).
Markers appear in real time as soon as a touch occurs and are locked per bar to avoid duplicates.
Inputs & Educational Purpose
Input Description Learning Focus
Source (for ghost smoother) Data used for the ghost RSI. Observe RSI smoothing lag.
RSI Length Period for both RSI(high) and RSI(low). Shorter = faster reaction; longer = smoother.
RSI-based MA Length (ghost) Smoothing for the ghost line. Compare sharp vs smoothed RSI rhythm.
levelEnter (touch or below) Default 15. Study how deep RSI(low) falls during market stress.
levelExit (touch or above) Default 85. Study how high RSI(high) rises during momentum bursts.
Rest period (bars) Cooldown after any event. Encourages post-event observation and prevents overlap.
Real-Time Behavior
Evaluates conditions per tick, not only at bar close.
Uses both real-time detection and bar-close backup for reliability.
Employs per-bar locks to prevent duplicate markers.
Integrates a cooldown so new markers only appear after the rest period.
The result is a clean, stable display of RSI stress points in live price motion — no flicker, no repaint.
How to Study with RSI Extremes
Watch how Enter markers form during sharp sell wicks — these highlight where intrabar RSI(low) dives into extreme territory.
Watch how Exit markers appear during aggressive tops — these show when RSI(high) surges beyond its upper boundary.
Compare both lines to the gray ghost: if the ghost is rising while Enter markers print, you’re seeing a temporary overshoot within strengthening momentum; if it’s falling while Exit markers print, you’re seeing supply exhaustion in weakening momentum.
Use cooldown spacing to examine how long markets take to recover or consolidate after an extreme tick.
Educational Value
Learn how RSI behaves inside a candle rather than only at its close.
Visualize how volatility affects the amplitude of RSI swings.
Understand that extremes don’t mean reversal — they measure intensity, not direction.
Build intuition for momentum saturation and liquidity hunts.
This indicator turns RSI into a real-time stress monitor rather than a delayed oscillator.
Category & Tags
Category: Indicator → Momentum (or Indicator → Educational / Research)
Tags: indicator, rsi, momentum, extremes, enter-exit, levelenter, levelexit, realtime, educational, research, visualization, pine-v5
Disclaimer
This indicator is intended exclusively for educational and research purposes.
It does not issue trade signals or financial advice.
All market activity carries risk; use this tool to learn, not to predict or execute trades.

RSI ROC Signals with Price Action# RSI ROC Signals with Price Action
## Overview
The RSI ROC (Rate of Change) Signals indicator is an advanced momentum-based trading system that combines RSI velocity analysis with price action confirmation to generate high-probability buy and sell signals. This indicator goes beyond traditional RSI analysis by measuring the speed of RSI changes and requiring price confirmation before triggering signals.
## Core Concept: RSI Rate of Change (ROC)
### What is RSI ROC?
RSI ROC measures the **velocity** or **acceleration** of the RSI indicator, providing insights into momentum shifts before they become apparent in traditional RSI readings.
**Formula**: `RSI ROC = ((Current RSI - Previous RSI) / Previous RSI) × 100`
### Why RSI ROC is Superior to Standard RSI:
1. **Early Momentum Detection**: Identifies momentum shifts before RSI reaches traditional overbought/oversold levels
2. **Velocity Analysis**: Measures the speed of momentum changes, not just absolute levels
3. **Reduced False Signals**: Filters out weak momentum moves that don't sustain
4. **Dynamic Thresholds**: Adapts to market volatility rather than using fixed RSI levels
5. **Leading Indicator**: Provides earlier signals compared to traditional RSI crossovers
## Signal Generation Logic
### 🟢 Buy Signal Process (3-Stage System):
#### Stage 1: Trigger Activation
- **RSI ROC** > threshold (default 7%) - RSI accelerating upward
- **Price ROC** > 0 - Price moving higher
- Records the **trigger high** (highest point during trigger)
#### Stage 2: Invalidation Check
- Signal invalidated if **RSI ROC** drops below negative threshold
- Prevents false signals during momentum reversals
#### Stage 3: Confirmation
- **Price breaks above trigger high** - Price action confirmation
- **Current candle is green** (close > open) - Bullish price action
- **State alternation** - Ensures no consecutive duplicate signals
### 🔴 Sell Signal Process (3-Stage System):
#### Stage 1: Trigger Activation
- **RSI ROC** < negative threshold (default -7%) - RSI accelerating downward
- **Price ROC** < 0 - Price moving lower
- Records the **trigger low** (lowest point during trigger)
#### Stage 2: Invalidation Check
- Signal invalidated if **RSI ROC** rises above positive threshold
- Prevents false signals during momentum reversals
#### Stage 3: Confirmation
- **Price breaks below trigger low** - Price action confirmation
- **Current candle is red** (close < open) - Bearish price action
- **State alternation** - Ensures no consecutive duplicate signals
## Key Features
### 🎯 **Smart Signal Management**
- **State Alternation**: Prevents signal clustering by alternating between buy/sell states
- **Trigger Invalidation**: Automatically cancels weak signals that lose momentum
- **Price Confirmation**: Requires actual price breakouts, not just momentum shifts
- **No Repainting**: Signals are confirmed and won't disappear or change
### ⚙️ **Customizable Parameters**
#### **RSI Length (Default: 14)**
- Standard RSI calculation period
- Shorter periods = more sensitive to price changes
- Longer periods = smoother, less noisy signals
#### **Lookback Period (Default: 1)**
- Period for ROC calculations
- 1 = compares to previous bar (most responsive)
- Higher values = smoother momentum detection
#### **RSI ROC Threshold (Default: 7%)**
- Minimum RSI velocity required for signal trigger
- Lower values = more signals, potentially more noise
- Higher values = fewer but higher-quality signals
### 📊 **Visual Signals**
- **Green Arrow Up**: Buy signal below price bar
- **Red Arrow Down**: Sell signal above price bar
- **Clean Chart**: No additional lines or oscillators cluttering the view
- **Size Options**: Customizable arrow sizes for visibility preferences
## Advantages Over Traditional Indicators
### vs. Standard RSI:
✅ **Earlier Signals**: Detects momentum changes before RSI reaches extremes
✅ **Dynamic Thresholds**: Adapts to market conditions vs. fixed 30/70 levels
✅ **Velocity Focus**: Measures momentum speed, not just position
✅ **Better Timing**: Combines momentum with price action confirmation
### vs. Moving Average Crossovers:
✅ **Leading vs. Lagging**: RSI ROC is forward-looking vs. backward-looking MAs
✅ **Volatility Adaptive**: Automatically adjusts to market volatility
✅ **Fewer Whipsaws**: Built-in invalidation logic reduces false signals
✅ **Momentum Focus**: Captures acceleration, not just direction changes
### vs. MACD:
✅ **Price-Normalized**: RSI ROC works consistently across different price ranges
✅ **Simpler Logic**: Clear trigger/confirmation process vs. complex crossovers
✅ **Built-in Filters**: Automatic signal quality control
✅ **State Management**: Prevents over-trading through alternation logic
## Trading Applications
### 📈 **Trend Following**
- Use in trending markets to catch momentum continuations
- Combine with trend filters for directional bias
- Excellent for breakout strategies
### 🔄 **Swing Trading**
- Ideal timeframes: 4H, Daily, Weekly
- Captures major momentum shifts
- Perfect for position entries/exits
### ⚡ **Scalping (Advanced Users)**
- Lower timeframes: 1m, 5m, 15m
- Reduce threshold for more frequent signals
- Combine with volume confirmation
### 🎯 **Momentum Strategies**
- Perfect for momentum-based trading systems
- Identifies acceleration phases in trends
- Complements breakout and continuation patterns
## Optimization Guidelines
### **Conservative Settings (Lower Risk)**
- RSI Length: 21
- ROC Threshold: 10%
- Lookback: 2
### **Standard Settings (Balanced)**
- RSI Length: 14 (default)
- ROC Threshold: 7% (default)
- Lookback: 1 (default)
### **Aggressive Settings (Higher Frequency)**
- RSI Length: 7
- ROC Threshold: 5%
- Lookback: 1
## Best Practices
### 🎯 **Entry Strategy**
1. Wait for signal arrow confirmation
2. Consider market context (trend, support/resistance)
3. Use proper position sizing based on volatility
4. Set stop-loss below/above trigger levels
### 🛡️ **Risk Management**
1. **Stop Loss**: Place beyond trigger high/low levels
2. **Position Sizing**: Use 1-2% risk per trade
3. **Market Context**: Avoid counter-trend signals in strong trends
4. **Time Filters**: Consider avoiding signals near major news events
### 📊 **Backtesting Recommendations**
1. Test on multiple timeframes and instruments
2. Analyze win rate vs. average win/loss ratio
3. Consider transaction costs in backtesting
4. Optimize threshold values for different market conditions
## Technical Specifications
- **Pine Script Version**: v6
- **Signal Type**: Non-repainting, confirmed signals
- **Calculation Basis**: RSI velocity with price action confirmation
- **Update Frequency**: Real-time on bar close
- **Memory Management**: Efficient state tracking with minimal resource usage
## Ideal For:
- **Momentum Traders**: Captures acceleration phases
- **Swing Traders**: Medium-term position entries/exits
- **Breakout Traders**: Confirms momentum behind breakouts
- **System Traders**: Mechanical signal generation with clear rules
This indicator represents a significant evolution in momentum analysis, combining the reliability of RSI with the precision of rate-of-change analysis and the confirmation of price action. It's designed for traders who want sophisticated momentum detection with built-in quality controls.

RSI Crossover AlertRSI Crossover Alert Indicator - User Guide
The RSI Crossover Alert Indicator is a comprehensive technical analysis tool that detects multiple types of RSI crossovers and generates real-time alerts. It combines traditional RSI analysis with signal lines, divergence detection, and multi-level crossing alerts.
1. Multiple Crossover Detection
- RSI/Signal Line Cross: Signals a primary trend change.
- RSI/Second Signal Cross: Confirmation signals for stronger trends.
- Level Crossings: Crosses of Overbought 70, Oversold 30, and Midline 50.
- Divergence Detection: Hidden and regular divergences for reversal signals.
2. Alert Types
- Alert: RSI > Signal
Description: Bullish momentum is building.
Signal: Consider long positions.
- Alert: RSI < Signal
Description: Bearish momentum is building.
Signal: Consider short positions.
- Alert: RSI > 70
Description: Entering the overbought zone.
Signal: Prepare for a potential reversal.
- Alert: RSI < 30
Description: Entering the oversold zone.
Signal: Watch for a bounce opportunity.
- Alert: RSI crosses 50
Description: A shift in momentum.
Signal: Trend confirmation.
3. Visual Components
- Lines: RSI blue, Signal orange, Second Signal purple
- Histogram: Visualizes momentum by showing the difference between RSI and the Signal line.
- Background Zones: Red overbought, Green oversold
- Markers: Up/down triangles to indicate crossovers.
- Info Table: Real-time RSI values and status.
Strategy 1: Classic Crossover
- Entry Long: RSI crosses above the Signal Line AND RSI is below 50.
- Entry Short: RSI crosses below the Signal Line AND RSI is above 50.
- Take Profit: On the opposite signal.
- Stop Loss: At the recent swing high/low.
Strategy 2: Extreme Zone Reversal
- Entry Long: RSI is below 30 and crosses above the Signal Line.
- Entry Short: RSI is above 70 and crosses below the Signal Line.
- Risk Management: Higher win rate but fewer signals. Use a minimum 2:1 risk-reward ratio.
Strategy 3: Divergence Trading
- Setup: Enable divergence alerts and look for price/RSI divergence. Wait for an RSI crossover for confirmation.
- Entry: Enter on the crossover after the divergence appears. Place the stop loss beyond the starting point of the divergence.
Strategy 4: Multi-Timeframe Confirmation
1. Check the higher timeframe e.g. Daily to identify the main trend.
2. Use the current timeframe e.g. 4H/1H for your entry.
3. Only enter in the direction of the main trend.
4. Use the RSI crossover as the entry trigger.
Optimal Settings by Market
- Forex Major Pairs
RSI Length: 14, Signal Length: 9, Overbought/Oversold: 70/30
- Crypto High Volatility
RSI Length: 10-12, Signal Length: 6-8, Overbought/Oversold: 75/25
- Stocks Trending
RSI Length: 14-21, Signal Length: 9-12, Overbought/Oversold: 70/30
- Commodities
RSI Length: 14, Signal Length: 9, Overbought/Oversold: 80/20
Risk Management Rules
1. Position Sizing: Never risk more than 1-2% on a single trade. Reduce size in ranging markets.
2. Stop Loss Placement: Place stops beyond the recent swing high/low for crossovers. Using an ATR-based stop is also effective.
3. Profit Taking: Take partial profits at a 1:1 risk-reward ratio. Switch to a trailing stop after reaching 2:1.
1. Filtering Signals
- Combine with volume indicators.
- Confirm the trend on a higher timeframe.
- Wait for candlestick pattern confirmation.
2. Avoid Common Mistakes
- Don't trade every single crossover.
- Avoid taking signals against a strong trend.
- Do not ignore risk management.
3. Market Conditions
- Trending Market: Focus on midline 50 crosses.
- Ranging Market: Look for reversals from overbought/oversold levels.
- Volatile Market: Widen the overbought/oversold levels.
- If you get too many false signals:
Increase the signal line period, add other confirmation indicators, or use a higher timeframe.
- If you are missing major moves:
Decrease the RSI length, shorten the signal line period, or check your alert settings.
Recommended Combinations
1. RSI + MACD: For dual momentum confirmation.
2. RSI + Bollinger Bands: For volatility-adjusted signals.
3. RSI + Volume: To confirm the strength of a signal.
4. RSI + Moving Averages: To use as a trend filter.
This indicator provides a comprehensive RSI analysis. Success depends on proper configuration, risk management, and combining signals with the overall market context. Start with the default settings, then optimize based on your trading style and market conditions.

RSI Standard Deviation | viResearchRSI Standard Deviation | viResearch
The "RSI Standard Deviation" indicator, developed by viResearch, introduces a new approach to combining the Relative Strength Index (RSI) with a standard deviation measure to offer a more dynamic view of market momentum. By applying standard deviation to the RSI values, this indicator refines the traditional RSI, providing a more precise and adaptive way to measure overbought and oversold conditions. This unique combination allows traders to better understand the underlying volatility in RSI movements, leading to more informed decisions in trending and ranging markets.
Technical Composition and Calculation:
The core of the "RSI Standard Deviation" lies in calculating the RSI based on user-defined input parameters and then applying standard deviation to these RSI values. This method enhances the sensitivity of the RSI, making it more responsive to market volatility.
RSI Calculation:
RSI Length (len): The script computes the Relative Strength Index over a customizable length (default: 21), offering a traditional measure of momentum in the market. The RSI tracks the speed and change of price movements, oscillating between 0 and 100 to indicate overbought and oversold conditions.
Standard Deviation Applied to RSI:
Standard Deviation Length (sdlen): The script calculates the standard deviation of the RSI values over a user-defined period (default: 35). This standard deviation represents the volatility in RSI movements, adding a new layer of analysis to traditional RSI.
Upper (u) and Lower (d) Bands:
The standard deviation values are used to create upper and lower bands around the RSI, offering an adaptive range that expands or contracts based on market volatility. This helps traders identify moments when the market is more likely to reverse or continue its trend.
Trend Identification:
Uptrend (L): The script identifies an uptrend when the RSI moves above the lower band and stays above the midline (50). This indicates that the market is gaining upward momentum, potentially signaling a long position.
Downtrend (S): A downtrend is identified when the RSI moves below 50, suggesting a weakening market and a potential short position.
Features and User Inputs:
The "RSI Standard Deviation" script offers various customization options, enabling traders to tailor it to their specific needs and strategies:
RSI Length: Traders can adjust the length of the RSI calculation to control how quickly the indicator responds to price movements.
Standard Deviation Length: Adjusting the standard deviation length allows users to control the sensitivity of the upper and lower bands, fine-tuning the indicator’s responsiveness to market volatility.
Source Input: The script can be applied to different price sources, offering flexibility in how it calculates RSI and standard deviation values.
Practical Applications:
The "RSI Standard Deviation" indicator is particularly useful in volatile markets, where traditional RSI may produce false signals due to rapid price movements. By adding a standard deviation measure, traders can filter out noise and better identify trends.
Key Uses:
Trend Following: The standard deviation bands provide a clearer view of momentum shifts in the RSI, allowing traders to follow the trend more confidently.
Volatility Assessment: The indicator dynamically adjusts to market volatility, making it easier to assess when the market is overbought or oversold and when a trend reversal is likely.
Signal Confirmation: By comparing the RSI to the adaptive standard deviation bands, traders can confirm signals and avoid false entries during periods of high volatility.
Advantages and Strategic Value:
The "RSI Standard Deviation" offers several advantages:
Enhanced Precision: The combination of RSI and standard deviation results in a more refined momentum indicator that adapts to market conditions.
Noise Reduction: The standard deviation bands help filter out short-term market noise, making it easier to identify significant trend changes.
Dynamic Volatility Awareness: By using standard deviation, the indicator adjusts its bands based on real-time volatility, providing more accurate overbought and oversold signals.
Summary and Usage Tips:
The "RSI Standard Deviation" is a powerful tool for traders looking to enhance their RSI analysis with volatility measures. For optimal performance, traders should experiment with different RSI and standard deviation lengths to suit their trading timeframe and strategy. Whether used to follow trends or confirm momentum signals, the "RSI Standard Deviation" provides a reliable and adaptive solution for modern trading environments.

RSI Primed [ChartPrime]
RSI Primed combines candlesticks, patterns, and the classic RSI indicator for advanced market trend indications
Introduction
Technical traders are always looking for innovative methods to pinpoint potential entry and exit points in the market. The RSI Prime indicator provides such traders with an enhanced view of market conditions by combining various charting styles and the Relative Strength Index (RSI). It offers users a unique perspective on the market trends and price momentum, enabling them to make better-informed decisions and stay ahead of the market curve.
The RSI Primed is a versatile indicator that combines different charting styles with the Relative Strength Index (RSI) to help traders analyze market trends and price momentum. It offers multiple visualization modes that serve specific purposes and provide unique insights into market performance:
Regular Candlesticks
Candlesticks with Patterns
Heikin Ashi Candles
Line Style
Regular Candlestick Mode
The Regular Candlestick Mode in RSI Primed depicts traditional Japanese candlesticks that most traders are familiar with. This mode bypasses any smoothing or modified calculations, representing real-price movements. Regular candlesticks offer a clear and straightforward way to visualize market trends and price action.
Candlestick with Patterns Mode
The Candlestick with Patterns Mode focuses on identifying high-probability candlestick patterns while incorporating RSI values. By leveraging the information captured by the RSI, this mode allows traders to spot significant market reversals or continuation patterns that could signal potential trading opportunities. Some recognizable patterns include engulfing bullish, engulfing bearish, morning star bullish, and evening star bearish patterns.
Heikin Ashi Candles Mode
The Heikin Ashi Candles Mode presents an advanced candlestick charting technique known for its excellent trend-following capabilities. Heikin Ashi Candles filter out noise in the market and provide a clear representation of market trends. In this mode, candlesticks are plotted based on RSI values of the open, high, low, and close prices, helping traders understand and utilize market trends effectively.
Line Style Mode
The Line Style Mode offers a simpler and minimalistic representation of the RSI values by using a line instead of candlesticks to visualize market trends. This mode helps traders focus on the overall trend direction and eliminates potential distractions caused by the complexity of candlestick patterns.
Candle Color Overlay Mode
The Candle Color Overlay Mode is a unique feature in the RSI Primed indicator that allows traders to visualize the RSI values on the chart's candles as a heat gradient. This mode adds a color overlay to the candlesticks, representing the RSI values in relation to the candlesticks' price action.
By displaying the RSI as a color gradient, traders can quickly assess market momentum and identify overbought or oversold conditions without having to switch between different modes or charts. The gradient ranges from cool colors (blue and green) for lower RSI values, indicating oversold conditions, to warm colors (orange and red) for higher RSI values, signifying overbought situations.
To enable the Candle Color Overlay Mode, traders can toggle the "Color Candles" option in the indicator settings. Once enabled, the color gradient will be applied to the candlesticks on the chart, providing a visually striking and informative representation of the RSI values in relation to price action. This mode can be used in tandem with any of the other charting styles, allowing traders to gain even more insights into market trends and momentum.
RSI Primed Implementation
The RSI Primed indicator combines the benefits of various charting styles with the RSI to help traders gain a comprehensive view of market trends and price momentum. It incorporates the Heikin Ashi and RSI values as inputs to generate several visualization modes, enabling traders to select the one that best suits their needs.
Chebyshev Digital Audio Filter in RSI Primed Indicator
A unique feature of the RSI Primed Indicator is the incorporation of the Chebyshev Digital Audio Filter, a powerful tool that significantly influences the indicator's accuracy and responsiveness. This signal processing method brings several benefits to the context of the RSI indicator, improving its performance and capabilities.
1. Improved Signal Filtering
The Chebyshev filter excels in its ability to remove high-frequency noise and unwanted signals from the RSI data. While other filtering techniques might introduce unwanted side effects or distort the RSI data, the Chebyshev filter accurately retains the main signal components, enhancing the RSI Primed's overall accuracy and reliability.
2. Faster Response Time
The Chebyshev filter offers a faster response time than most other filtering techniques. In the context of the RSI Primed Indicator, this means that the filtering process is quicker and more efficient, allowing traders to act swiftly during rapidly changing market conditions.
3. Enhanced Trend Detection
By effectively removing noise from the RSI data, the Chebyshev filter contributes to the enhanced detection of underlying market trends. This feature helps traders identify potential entry and exit points more accurately, improving their overall trading strategy and performance.
How to Use RSI Primed
Traders can choose from different visualization modes to suit their preferences while using the RSI Primed indicator. By closely monitoring the chosen visualization mode and the position of the moving average, traders can make informed decisions about market trends.
Green candlesticks or an upward line slope indicate a bullish trend, and red candlesticks or a downward line slope suggest a bearish trend. If the candles or line are above the moving average, it could signify an uptrend, whereas a position below the moving average may indicate a downtrend.
The RSI Primed indicator offers a unique and comprehensive perspective on market trends and price momentum by combining various charting styles with the RSI. Traders can choose from different visualization modes and make well-informed decisions to capitalize on market opportunities. This innovative indicator provides a clear and concise view of the market, enabling traders to make swift decisions and enhance their trading results.

RSI Candle Advanced V2RSI Advanced
As the period value is longer than 14, the RSI value sticks to the value of 50 and becomes useless.
Also, when the period value is less than 14, it moves excessively, so it is difficult for us to see the movement of the RSI .
So, using the period value and the RSI value as variables, I tried to make it easier to identify the RSI value through a new function expression.
This is how RSI Advanced was developed.
Period below 14 reduce the volatility of RSI , and period above 14 increase the volatility of RSI, allowing overbought and oversold zones to work properly and give you a better view of the trend.
By applying the custom algorithm so that the 'RSI Advanced' with period on a 5-minute timeframe has the same value as the 'original RSI' with period on a 60-minute timeframe.
As another example, an 'RSI Advanced' with a period in a 60-minute time frame has the same value as an 'original RSI' with a period in a 240-minute time frame.
Compare the difference in the RSI with a period value of 200 in the snapshot.
------------------------------------------------------------------------------------------
RSI Candlestick
RSI derives its value using only the closing price as a variable.
I solved the RSI equation in reverse and tried to include the high and low prices of candlesticks in the equation.
As a result, 'if the high or low was the closing price, the value of RSI would be like this' was implemented.
Just like when a candle comes down after setting a high price, an upper tail is formed when RSI Candle goes down after setting a high price!!
In divergence, we had to look only at the relationship between closing prices, but if we use RSI candles, we can find divergences in highs and highs, and lows and lows.
Existing indicators could not express "gap", but Version 2 made it possible to express "gap"!!!!!!
RSI can be displayed as candlesticks, bars and lines
Then enjoy my RSI!
----------------------------------------------------------------------------------------
RSI Advanced
기간값이 14보다 길어질수록 RSI값은 50값에 달라붙게 되어서 쓸모가 없어집니다.
또 기간값이 14보다 줄어들수록 과도하게 움직여서 우리는 RSI의 움직임을 보기가 힘듭니다.
그래서 기간 값과 RSI 값을 변수로 사용하여 새로운 함수 식을 통해 RSI 값을 식별하기 편하도록 해보았습니다.
이렇게 RSI Advanced가 개발되었습니다.
기간값이 14보다 낮으면 rsi의 변동폭이 줄어들고, 기간값이 14보다 크면 변동폭이 넓어져 과매수 및 과매도 영역이 제대로 작동하여 추세를 더 잘 볼 수 있습니다.
또한 저는 5분 타임프레임의 기간값이 168(=14*12)인 RSI가 주기 값이 14인 60분 타임프레임의 RSI와 동일한 값을 갖도록 적절한 함수 표현식을 적용하여 RSI를 변경했습니다.
다른 예로, 15분 시간 프레임에서 기간값이 56(=14*4)인 RSI는 60분 시간 프레임의 기간값이 14인 RSI와 동일한 값을 갖습니다.
기간값이 200인 RSI의 차이를 스냅샷에서 비교해보십시오.
-----------------------------
RSI Candlestick
RSI는 종가만을 변수로 사용하여 값을 도출해냅니다.
저는 RSI 식을 역으로 풀어내어서 캔들스틱의 고가와 저가, 시가를 식에 포함시켜보았습니다.
결과적으로, '만약 고가나 저가가 종가였다면 RSI의 값이 이럴것이다'를 구현해내었습니다.
캔들이 고가를 찍고 내려오면 윗꼬리가 생기듯 RSI Candle에서도 고가를 찍고 내려오면 윗꼬리가 생기는겁니다!!
다이버전스 또한 원래는 종가끼리의 관계만 봐야했지만 RSI 캔들을 이용한다면 고가와 고가, 저가와 저가에서도 다이버전스를 발견할 수 있습니다.
기존의 지표는 "갭"을 표현하지 못했지만 Version 2 에서는 "갭"을 표현할 수 있게 만들었습니다!!!!!!
그럼 잘 사용해주십시오!!!

RSI Candle with Advanced RSI fomulaRSI Advanced
As the period value is longer than 14, the RSI value sticks to the value of 50 and becomes useless.
Also, when the period value is less than 14, it moves excessively, so it is difficult for us to see the movement of the RSI.
So, using the period value and the RSI value as variables, I tried to make it easier to identify the RSI value through a new function expression.
This is how RSI Advanced was developed.
Period values below 14 reduce the volatility of RSI, and period values greater than 14 allow wider fluctuations, allowing overbought and oversold zones to work properly and give you a better view of the trend.
I also changed the RSI by applying the appropriate function expression so that the RSI with a period value of 168 (=14*12) on a 5 minute timeframe has the same value as the RSI on a 60 minute timeframe with a period value of 14.
As another example, an RSI with a period value of 56 (=14*4) in a 15-minute time frame has the same value as an RSI with a period value of 14 in a 60-minute time frame.
Compare the difference in the RSI with a period value of 200 in the snapshot.
------------------------------------------------------------------------------------------
RSI Candlestick
RSI derives its value using only the closing price as a variable. I solved the RSI equation in reverse and tried to include the high and low prices of candlesticks in the equation.
As a result, 'if the high or low was the closing price, the value of RSI would be like this' was implemented. Just like when a candle comes down after setting a high price, an upper tail is formed when RSI Candle goes down after setting a high price!!
In divergence, we had to look only at the relationship between closing prices, but if we use RSI candles, we can find divergences in highs and highs, and lows and lows.
Then enjoy my RSI!
----------------------------------------------------------------------------------------
RSI Advanced
기간값이 14보다 길어질수록 RSI값은 50값에 달라붙게되어서 쓸모가 없어집니다.
또 기간값이 14보다 줄어들수록 과도하게 움직여서 우리는 RSI의 움직임을 보기가 힘듭니다.
그래서 기간 값과 RSI 값을 변수로 사용하여 새로운 함수 식을 통해 RSI 값을 식별하기 편하도록 해보았습니다.
이렇게 RSI Advanced가 개발되었습니다.
기간값이 14보다 낮으면 rsi의 변동폭이 줄어들고, 기간값이 14보다 크면 변동폭이 넓어져 과매수 및 과매도 영역이 제대로 작동하여 추세를 더 잘 볼 수 있습니다.
또한 저는 5분 타임프레임의 기간값이 168(=14*12)인 RSI가 주기 값이 14인 60분 타임프레임의 RSI와 동일한 값을 갖도록 적절한 함수 표현식을 적용하여 RSI를 변경했습니다.
다른 예로, 15분 시간 프레임에서 기간값이 56(=14*4)인 RSI는 60분 시간 프레임의 기간값이 14인 RSI와 동일한 값을 갖습니다.
기간값이 200인 RSI의 차이를 스냅샷에서 비교해보십시오.
-----------------------------
RSI Candlestick
RSI는 종가만을 변수로 사용하여 값을 도출해냅니다. 저는 RSI 식을 역으로 풀어내어서 캔들스틱의 고가와 저가를 식에 포함시켜보았습니다.
결과적으로, '만약 고가나 저가가 종가였다면 RSI의 값이 이럴것이다'를 구현해내었습니다. 캔들이 고가를 찍고 내려오면 윗꼬리가 생기듯 RSI Candle에서도 고가를 찍고 내려오면 윗꼬리가 생기는겁니다!!
다이버전스 또한 원래는 종가끼리의 관계만 봐야했지만 RSI 캔들을 이용한다면 고가와 고가, 저가와 저가에서도 다이버전스를 발견할 수 있습니다.
그럼 잘 사용해주십시오!!!

RSI Distribution [Kodexius]RSI Distribution is a statistics driven visualization companion for the classic RSI oscillator. In addition to plotting RSI itself, it continuously builds a rolling sample of recent RSI values and projects their distribution as a forward drawn histogram, so you can see where RSI has spent most of its time over the selected lookback window.
The indicator is designed to add context to oscillator readings. Instead of only treating RSI as a single point estimate that is either “high” or “low”, you can evaluate the current RSI level relative to its own recent history. This makes it easier to recognize when the market is operating inside a familiar regime, and when RSI is pushing into rarer tail conditions that tend to appear during momentum bursts, exhaustion, or volatility expansion.
To complement the histogram, the script can optionally overlay a Gaussian curve fitted to the sample mean and standard deviation. It also runs a Jarque Bera normality check, based on skewness and excess kurtosis, and surfaces the result both visually and in a compact dashboard. On the oscillator panel itself, RSI is presented with a clean gradient line and standard overbought and oversold references, with fills that become more visible when RSI meaningfully extends beyond key thresholds.
🔹 Features
1. Distribution Histogram of Recent RSI Values
The script stores the last N RSI values in an internal sample and uses that rolling window to compute a frequency distribution across a user selected number of bins. The histogram is drawn into the future by a configurable width in bars, which keeps it readable and prevents it from colliding with the active RSI plot. The result is a compact visual summary of where RSI clusters most often, whether it is spending more time near the center, or shifting toward higher or lower regimes.
2. Gaussian Overlay for Shape Intuition
If enabled, a fitted bell curve is drawn on top of the histogram using the sample mean and standard deviation. This overlay is not intended as a direct trading signal. Its purpose is to provide a fast visual comparator between the empirical RSI distribution and a theoretical normal shape. When the histogram diverges strongly from the curve, you can quickly spot skew, heavy tails, or regime changes that often occur when market structure or volatility conditions shift.
3. Jarque Bera Normality Check With Clear PASS/FAIL Feedback
The script computes skewness and excess kurtosis from the RSI sample, then forms the Jarque Bera statistic and compares it to a fixed 95% critical value. When the distribution is closer to normal under this test, the status is marked as PASS, otherwise it is marked as FAIL. This result is displayed in the dashboard and can also influence the histogram styling, giving immediate feedback about whether the recent RSI behavior resembles a bell shaped distribution or a more distorted, regime driven profile.
Jarque Bera is a goodness of fit test that evaluates whether a dataset looks consistent with a normal distribution by checking two shape properties: skewness (asymmetry) and kurtosis (tail heaviness, expressed here as excess kurtosis where a perfect normal has 0). Under the null hypothesis of normality, skewness should be near 0 and excess kurtosis should be near 0. The test combines deviations in both into a single statistic, which is then compared to a chi square threshold. A PASS in this script means the sample does not show strong evidence against normality at the chosen threshold, while a FAIL means the sample is meaningfully skewed, heavy tailed, or both. In practical trading terms, a FAIL often suggests RSI is behaving in a regime where extremes and asymmetry are more common, which is typical during strong trends, volatility expansions, or one sided market pressure. It is still a statistical diagnostic, not a prediction tool, and results can vary with lookback length and market conditions.
4. Integrated Stats Dashboard
A compact table in the top right summarizes key distribution moments and the normality result: Mean, StdDev, Skewness, Kurtosis, and the JB statistic with PASS/FAIL text. Skewness is color coded by sign to quickly distinguish right skew (more time at higher RSI) versus left skew (more time at lower RSI), which can be helpful when diagnosing trend bias and momentum persistence.
5. RSI Visual Quality and Context Zones
RSI is plotted with a gradient color scheme and standard overbought and oversold reference lines. The overbought and oversold areas are filled with a smart gradient so visual emphasis increases when RSI meaningfully extends beyond the 70 and 30 regions, improving readability without overwhelming the panel.
🔹 Calculations
This section summarizes the main calculations and transformations used internally.
1. RSI Series
RSI is computed from the selected source and length using the standard RSI function:
rsi_val = ta.rsi(rsi_src, rsi_len)
2. Rolling Sample Collection
A float array stores recent RSI values. Each bar appends the newest RSI, and if the array exceeds the configured lookback, the oldest value is removed. Conceptually:
rsi_history.push(rsi_val)
if rsi_history.size() > lookback
rsi_history.shift()
This maintains a fixed size window that represents the most recent RSI behavior.
3. Mean, Variance, and Standard Deviation
The script computes the sample mean across the array. Variance is computed as sample variance using (n - 1) in the denominator, and standard deviation is the square root of that variance. These values serve both the dashboard display and the Gaussian overlay parameters.
4. Skewness and Excess Kurtosis
Skewness is calculated from the standardized third central moment with a small sample correction. Kurtosis is computed as excess kurtosis (kurtosis minus 3), so the normal baseline is 0. These two metrics summarize asymmetry and tail heaviness, which are the core ingredients for the Jarque Bera statistic.
5. Jarque Bera Statistic and Decision Rule
Using skewness S and excess kurtosis K, the Jarque Bera statistic is computed as:
JB = (n / 6.0) * (S^2 + 0.25 * K^2)
Normality is flagged using a fixed critical value:
is_normal = JB < 5.991
This produces a simple PASS/FAIL classification suitable for fast chart interpretation.
6. Histogram Binning and Scaling
The RSI domain is treated as 0 to 100 and divided into a configurable number of bins. Bin size is:
bin_size = 100.0 / bins
Each RSI sample maps to a bin index via floor(rsi / bin_size), with clamping to ensure the index stays within valid bounds. The script counts occurrences per bin, tracks the maximum frequency, and normalizes each bar height by freq/max_freq so the histogram remains visually stable and comparable as the window updates.
7. Gaussian Curve Overlay (Optional)
The Gaussian overlay uses the normal probability density function with mu as the sample mean and sigma as the sample standard deviation:
normal_pdf(x) = (1 / (sigma * sqrt(2*pi))) * exp(-0.5 * ((x - mu)/sigma)^2)
For drawing, the script samples x across the histogram width, evaluates the PDF, and normalizes it relative to its peak so the curve fits within the same visual height scale as the histogram.

RSI Cascade DivergencesRSI Cascade Divergences is a tool for detecting divergences between price and RSI with an extended cascade-based strength accumulation logic. A “cascade” represents a sequence of multiple divergences linked through RSI pivot points. The indicator records RSI pivots, checks whether a divergence is present, assigns a strength value to each structure, and displays only signals that meet your minimum strength thresholds.
How Divergence Logic Works
The indicator identifies local RSI extremes (pivots) based on Pivot Length and Pivot Confirm.
For every confirmed pivot it stores:
the RSI value at the pivot,
the corresponding value of the RSI Source price,
the pivot’s bar index.
How a Divergence Is Formed
A divergence is detected when two consecutive RSI pivots of the same type show opposite dynamics relative to the price source defined in RSI Source (default: close), not relative to chart highs/lows.
Bearish divergence: the price source value at the second pivot is higher, but RSI forms a lower high.
Bullish divergence: the price source value at the second pivot is lower, but RSI forms a higher low.
The indicator does not use price highs/lows — only the selected price source at the pivot points.
Cascade Strength Calculation
Each new pivot is compared only with the previous pivot of the same type.
A cascade grows in strength if:
divergence conditions are met,
the difference in RSI values exceeds Min. RSI Distance,
the previous structure already had some strength or the previous pivot was formed in the OB/OS zone.
If the divergence occurs as RSI exits OB/OS, strength is additionally increased by +1.
Behavior in Strong Trends
Divergences may appear repeatedly and even form cascades with high strength. However, if price does not react meaningfully, this indicates strong trend pressure.
In such cases, divergences stop functioning as reversal signals:
RSI attempts to counter-move, but the dominant trend continues.
The indicator accurately reflects this — cascades may form but fail to trigger any reversal, which itself suggests a powerful, persistent trend.
Filtering and Context Reset
To avoid retaining irrelevant pivots:
when RSI is above Overbought → low pivots are cleared;
when RSI is below Oversold → high pivots are cleared.
This prevents false cascades during extreme RSI conditions.
Input Parameters
RSI Source — price source used in RSI calculations (close, hl2, ohlc4, etc.).
RSI Length — RSI calculation period.
Overbought / Oversold — RSI threshold zones.
Pivot Length — number of bars to the left required for a pivot.
Pivot Confirm — bars to the right required to confirm the pivot.
Min. RSI Distance — minimum difference between two pivot RSI values for the divergence to be considered meaningful.
Min. Strength (Bull / Bear) — minimum accumulated strength for:
confirming the signal,
displaying the strength label,
triggering alerts.
Weaker signals below these thresholds appear as dashed guide structures.
Visual
Display settings for lines, markers, and colors.
These parameters do not affect the indicator logic.
Important
Divergences — including cascades — should not be used as a standalone trading signal.
Always combine them with broader market context, trend analysis, structure, volume, and risk management tools.

RSI Failure Swing Pattern (with Alerts & Targets)RSI Failure Swing Pattern Indicator – Detailed Description
Overview
The RSI Failure Swing Pattern Indicator is a trend reversal detection tool based on the principles of failure swings in the Relative Strength Index (RSI). This indicator identifies key reversal signals by analyzing RSI swings and confirming trend shifts using predefined overbought and oversold conditions.
Failure swing patterns are one of the strongest RSI-based reversal signals, initially introduced by J. Welles Wilder. This indicator detects these patterns and provides clear buy/sell signals with labeled entry, stop-loss, and profit target levels. The tool is designed to work across all timeframes and assets.
How the Indicator Works
The RSI Failure Swing Pattern consists of two key structures:
1. Bullish Failure Swing (Buy Signal)
Occurs when RSI enters oversold territory (below 30), recovers, forms a higher low above the oversold level, and finally breaks above the intermediate swing high in RSI.
Step 1: RSI dips below 30 (oversold condition).
Step 2: RSI rebounds and forms a local peak.
Step 3: RSI retraces but does not go below the previous low (higher low confirmation).
Step 4: RSI breaks above the previous peak, confirming a bullish trend reversal.
Buy signal is triggered at the breakout above the RSI peak.
2. Bearish Failure Swing (Sell Signal)
Occurs when RSI enters overbought territory (above 70), declines, forms a lower high below the overbought level, and then breaks below the intermediate swing low in RSI.
Step 1: RSI rises above 70 (overbought condition).
Step 2: RSI declines and forms a local trough.
Step 3: RSI bounces but fails to exceed the previous high (lower high confirmation).
Step 4: RSI breaks below the previous trough, confirming a bearish trend reversal.
Sell signal is triggered at the breakdown below the RSI trough.
Features of the Indicator
Custom RSI Settings: Adjustable RSI length (default 14), overbought/oversold levels.
Buy & Sell Signals: Buy/sell signals are plotted directly on the price chart.
Entry, Stop-Loss, and Profit Targets:
Entry: Price at the breakout of the RSI failure swing pattern.
Stop-Loss: Lowest low (for buy) or highest high (for sell) of the previous two bars.
Profit Targets: Two levels calculated based on Risk-Reward ratios (1:1 and 1:2 by default, customizable).
Labeled Price Levels:
Entry Price Line (Blue): Marks the point of trade entry.
Stop-Loss Line (Red): Shows the calculated stop-loss level.
Target 1 Line (Orange): Profit target at 1:1 risk-reward ratio.
Target 2 Line (Green): Profit target at 1:2 risk-reward ratio.
Alerts for Trade Execution:
Buy/Sell signals trigger alerts for real-time notifications.
Alerts fire when price reaches stop-loss or profit targets.
Works on Any Timeframe & Asset: Suitable for stocks, forex, crypto, indices, and commodities.
Why Use This Indicator?
Highly Reliable Reversal Signals: Unlike simple RSI overbought/oversold strategies, failure swings filter out false breakouts and provide strong confirmation of trend reversals.
Risk Management Built-In: Stop-loss and take-profit levels are automatically set based on historical price action and risk-reward considerations.
Easy-to-Use Visualization: Clearly marked entry, stop-loss, and profit target levels make it beginner-friendly while still being valuable for experienced traders.
How to Trade with the Indicator
Buy Trade Example (Bullish Failure Swing)
RSI drops below 30 and recovers.
RSI forms a higher low and then breaks above the previous peak.
Entry: Buy when RSI crosses above its previous peak.
Stop-Loss: Set below the lowest low of the previous two candles.
Profit Targets:
Target 1 (1:1 Risk-Reward Ratio)
Target 2 (1:2 Risk-Reward Ratio)
Sell Trade Example (Bearish Failure Swing)
RSI rises above 70 and then declines.
RSI forms a lower high and then breaks below the previous trough.
Entry: Sell when RSI crosses below its previous trough.
Stop-Loss: Set above the highest high of the previous two candles.
Profit Targets:
Target 1 (1:1 Risk-Reward Ratio)
Target 2 (1:2 Risk-Reward Ratio)
Final Thoughts
The RSI Failure Swing Pattern Indicator is a powerful tool for traders looking to identify high-probability trend reversals. By using the RSI failure swing concept along with built-in risk management tools, this indicator provides a structured approach to trading with clear entry and exit points. Whether you’re a day trader, swing trader, or long-term investor, this indicator helps in capturing momentum shifts while minimizing risk.
Would you like any modifications or additional features? 🚀

Super RSI: Multi-Timeframe, Multi-RSI-MA, Multi Symbol [DucTri]█ Overview
RSI is a very popular indicator that almost every trader knows about. I created this indicator with the goal of helping you use RSI more conveniently and effectively.
█ Uses
Monitor the RSI of 10 currency pairs simultaneously.
The first column shows the RSI of the current currency pair.
RSI below 30 will have a Red background, and above 70 will have a Green background.
Display multiple RSI lines with different lengths (or timeframes).
Displays 3 RSI with 3 different lengths 7, 14 and 21
Displays two RSI lines with two different timeframes. The purple line shows RSI (14) for the 1H timeframe, and the blue line shows RSI (14) for the 4H timeframe.
Display MA and Bollinger Band lines for RSI.
Shows the RSI line along with two MA lines of the RSI: EMA (9) in blue and WMA (45) in red.
Identify RSI Divergence with custom settings
█ Input
- You can have up to three RSI lines, with customizable lengths and timeframes.
- You also have up to three RSI-MA lines, where you can customize the MA type and length.
- You can track RSI for up to 10 currency pairs at the same time.
- Additionally, you can change how the top (or bottom) is determined when identifying divergence.
█ Alerts
Send alerts when two RSI lines cross. For example, when the RSI 14 crosses above the RSI 21, or the RSI on the 1H timeframe crosses above the RSI on the 4H timeframe.*
Send alerts when RSI crosses above or below the RSI-MA line.
Send alerts when two RSI-MA lines cross. For example, when the RSI-EMA (9) crosses above the RSI-WMA (45).*
Send alerts when Divergence (Convergence) appears.
Send alerts when any currency pair in the monitored list shows an Overbought or Oversold signal.
