RSI Support & Resistance by DGTRSI Sᴜᴘᴘᴏʀᴛ & Rᴇꜱɪꜱᴛᴀɴᴄᴇ ʙʏ DGT
This experimental study attempts to translate Relative Strength Index (RSI) threshold levels of oversold/overbought and bull/bear zones as probable Price Support and Resistance levels
█ OPTIONS
Support & Resistance Levels , the main aim of the study. Level calculations are based on Relative Strength Index (RSI) threshold levels of oversold/overbought and bull/bear zones, where all threshold values are customizable through the user dialog box. Background of the levels can be colored optionally
RSI Weighted Colored Bars and/or Mark Overbought/Oversold Bars , Bar colors can be painted to better emphasis RSI values. Darker colors when the oscillator is in oversold/overbought zones, light colors when oscillator readings are below/above the bull/bear zone respectively, and remain unchanged otherwise. Besides the colors, with “Display RSI Overbought/Oversold Price Bars” option little triangle shapes can be plotted on top or bottom of the bars when RSI is in oversold/overbought zones
Example usage of the study with explanations
█ OTHERS
More regarding Support & Resistance concept (definition, identifying levels, trading S&R, etc) you are kindly invited to check my previous publication
Price Action - Support & Resistance by DGT
More regarding Relative Strength Index (RSI) and Relative Strength of Volume Indicators , please check Relative Strength of Volume Indicators by DGT
Disclaimer:
Trading success is all about following your trading strategy and the indicators should fit within your trading strategy, and not to be traded upon solely
The script is for informational and educational purposes only. Use of the script does not constitute professional and/or financial advice. You alone have the sole responsibility of evaluating the script output and risks associated with the use of the script. In exchange for using the script, you agree not to hold dgtrd TradingView user liable for any possible claim for damages arising from any decision you make based on use of the script
Cerca negli script per "rsi"

RSI Multi Time FrameHello Traders,
Recently we got new features in Pine such Arrays of Lines, Labels and Strings. Thanks to the Pine Team! ( here )
So I decided to make new style of Multi Time Frame indicator and I used Array of Lines in this script. here it is, RSI Multi Time Frame script. it shows RSI for current time frame as it is and also it gets RSI for the Higher Time Frame and converts it and shows it as in time frame. as you can see, RSI for HTF moves to the right on each candle until higher time frame was completed.
You have color and line width options for both RSI, also if you want you can limit the number of bars to show higher time frame RSI by the option " Number of Bars for RSI HTF ", following example show RSI HTF for 100 bars.
Most of you know that old style Multi Time Frames indicators was like:
Hope you like this new Multi time frame style ;)
Enjoy!

RSI Step Oscillator [racer8]Purpose of RSO is to identify when RSI has reached key levels. These levels are 80, 70, 60, 40, 30, and 20.
When indicator displays a bar with color...
Purple : RSI > 80
Blue : RSI > 70
Green : RSI > 60
Gray : RSI is inbetween 40 and 60.
Yellow : RSI < 40
Orange : RSI < 30
Red : RSI < 20
Hit the like button and enjoy 😁

RSI on VWAP Upgraded strategyFirst of all, the idea of apply RSI to VWAP was inspired by XaviZ; at least, that where I first saw that.
I simply applied the idea and searched for apply this on lower timeframe (M15) to increase the number of positions and improve the profit factor.
The conditions to enter are the same :
long : enter on RSI crossover oversold level
short : enter on RSI crossunder oversell level
To close position, I found a little change to apply :
long : close position when RSI(VWAP) went in overbought zone and crossunder the overbought level OR after being at least x bars in the overbought zone (parameter is 28 by default) => when the first condition happens
short : close position when RSI(VWAP) went in oversold zone and crossover the oversold level OR after being at least x bars in the oversell zone (parameter is 28 by default) => when the first condition happens
With this change, I got better results specially on BTCUSDTPERP (M15) where I reach a 6.8 profit factor with 119 trades closed. Not BAD !
The defaults parameters are the best found for BTCUSDTPERP (M15), but the strategy works fine for other pairs if you take time to find the rights combinations.
In this strategy you can change (with defaults in () ):
RSI length (28)
RSI overbought level (85)
RSI oversell level (30)
Number of bars before leaving as explain above (28)
The choice to take longs only, shorts only or both
The number of coin/token by position
The start date for backtesting
Please note that the script use a pyramiding parameter of 3 (can be changed in the first line of the script); that means that you can take up to 3 positions before closing. It lets you improve average enter price but increase the risk. 3 is the best I found to improve profit factor without expose myself too much.
This script would be better if automated because of the conditions of buy and sell.
It's only for educative purpose, not an advice to invest.
All my free scripts here : fr.tradingview.com
Leave a message and don't forget to follow me ;) !

RSI Correlation with future priceThis script measures the correlation of the hourly RSI of 24 hours ago with the difference of price between now and the price 24 hours ago. In other words, this is an indicator which measures the predictive power of the RSI.
Green means that the price is strongly correlated with the past RSI (which is the normal state when the market is flat and there is no news).
Red means that the price is inversely correlated with the past RSI.
The hourly RSI is a leading indicator which enables you to (sort of) see into the future. It shows you how the current price is, compared to the price 24 (or 48) hours into the future.
If the RSI is low, it means the current price is low compared to the future price, and if the RSI is high, it means the current price is high compared to the future price.
So the hourly RSI really correlates (in the way I described) to the price 24 hours in the future.
Except when it doesn't!!!
What happens when the correlation breaks (RED on this indicator)? Usually there are important news - a strong signal external to the chart. There are either economy at large news, or security-specific news.
Following a strong break of this RSI-future price correlation, some cash can be made by understanding what happened and playing the restoration of the RSI-price correlation.

RSI/MFI - MTF - Entry signals/Trend colored bars - JD@version=2
This indicator is designed to give early entry signals as well as to follow trend moves, according to different settings.
The indicator shows a histogram of the RSI ro MFI in relation to an ema of the RSI or MFI.
The histogram is then smoothed to give early reversal/entry signals.
The actual RSI/MFI line with oversold/overbought indication can be displayed or omitted, as preferred.
in addition to the RSI/MFI line or as an alternative to it, the background colour can be set to change folowing the RSI/MFI signals.
The timeframe can be chosen. Higher timeframes (eg. 3h) tend to give less false signals.
version 5.
added support for custom Multiple Time Frame selection.
added option for choice of RSI or MFI as base indicator.
added option for price bar coloring according to the indicator. (deselecting "borders" in the "style" tab is recommended)
price bar coloring can be adjusted for different strategies:
1. following the slope of the histogram (for faster entry/exit signals)
2. according to positive or negative histogram (for longer moves)
3. according to pos. or neg. RSI/MFI (for longer term trend holds)
4. uptrend: biased towards faster buy signals and slower sell signals to stay in the uptrend
5. downtrend: biased towards faster sell signals and slower buy signals to stay in the downtrend
A longer timeframe (eg. 3x) is recommended for following trend moves.
try different strategies to see what works better for RSI or MFI.
JD.

RSI Bars - OnlyFlowThis indicator applies the RSI (Relative Strength Index) to candle coloring so that bar colors reflect momentum conditions instead of a fixed scheme.
RSI Logic: Bars shift color when RSI values move into overbought or oversold regions, with intensity scaled by how far RSI extends beyond the thresholds.
Gradient / Step Mode: Choose between a smooth gradient or a 3-step palette to visualize strength.
Directional Neutral Colors: Neutral zones can follow candle direction for clearer trend context.
Customization: Overbought/oversold levels and color palettes are user-configurable.
Optional RSI Panel: An RSI plot with overbought/oversold lines can be enabled in a separate pane if desired.
This tool is meant to give traders a more intuitive view of RSI conditions directly on price bars, helping to quickly see momentum extremes without needing to glance away from the chart.

RSI(7) + MACD ZoneTitle: RSI(7) + MACD Zone Combo
Description:
This indicator combines RSI (7) and MACD (12,26,9) into a single panel with a unified scale for easier analysis.
RSI (7) is plotted in white and automatically turns red when the market reaches overbought (>70) or oversold (<30) conditions.
MACD is normalized to align with the RSI scale (0–100).
A value of 50 represents MACD = 0.
Above 50 (teal) indicates positive momentum.
Below 50 (red) indicates negative momentum.
This combination allows traders to quickly identify when short-term RSI conditions align with overall momentum shifts from MACD.
How to use:
Look for potential buy opportunities when RSI is oversold (<30) and MACD is above 50 (positive momentum).
Look for potential sell opportunities when RSI is overbought (>70) and MACD is below 50 (negative momentum).
Use in conjunction with price action and risk management — not as a standalone signal.

RSI with Moving Averages[UO] EnhancedWhat This Indicator Does
Displays the RSI (Relative Strength Index) with two customizable moving averages to help identify trend direction and momentum shifts.
Key Features
RSI Line: Shows momentum (overbought above 70, oversold below 30)
Two Moving Averages: Smooth RSI signals and show trend direction
Color-Coded Fills: Visual areas between lines indicate bullish/bearish conditions
Support/Resistance Lines: Bull market support (40) and bear market resistance (60)
Customization Options
Moving Average Types: Choose SMA or EMA for each line
Periods: Adjust RSI (14), First MA (13), Second MA (33)
Visual Elements: Toggle background shading and fills on/off
Colors & Styles: Customize all line colors and widths in Style tab
How to Read It
Green Fill: Second MA below first MA (bullish momentum)
Red Fill: Second MA above first MA (bearish momentum)
RSI Above 70: Potentially overbought
RSI Below 30: Potentially oversold
Perfect for traders wanting enhanced RSI analysis with flexible moving average confirmation signals.

Advanced RSI — Mark 4 RSI was introduced by J. Welles Wilder Jr. in 1978 in New Concepts in Technical Trading Systems. It measures the velocity of gains vs. losses on a bounded 0–100 scale and popularized the 14-period lookback with 70/30 guide rails for overbought/oversold. Over time, traders added variations (different lengths, thresholds, smoothing, adaptive levels), but the core idea stayed the same: momentum turns often precede price turns.
and i initially started to make minor adjustments for personal use like changing the default to 17 , and using Tradingviews official RSI which comes with a MA embedded. but it was not enough. especially the visuals.
so, for this public release Mark 4 i enhanced RSI by incorporating :
1. Dual-Length Fusion
Two RSI periods (default 17 + 21) blended then lightly smoothed (TEMA by default) → steadier
line without dulling turns.
2. Adaptive OB/OS (ATR-aware) for fewer whipsaws.
3. OB/OS alt solution:
Brief yellow segments appear only at local extremes (default: >72 tops, <32 bottoms) to
emphasize exhaustion without repainting the whole line.
4. Signals you can actually see
Triangle markers for:
Bullish: RSI crossing up through adaptive OS (and still <40 at the cross).
Bearish: RSI crossing down through adaptive OB (and still >60 at the cross).
“Strong Bull/Bear” background nudges appear when momentum is pushing beyond the
bands.
Optional Divergence Tags
and
Tiny diamonds to flag potential bullish/bearish divergences (look-back based).
Info Table (can be hidden)
my Fav feature i included 5 colorways with modern themes.(pls check under INPUTS)
and i made all that to make the indicator visualization look awesome on high end displays.
Credits & acknowledgment
Inspired by the original RSI by J. Welles Wilder Jr. (1978).
Built to be modern, focused, and comfortable for long sessions—especially on dark/OLED displays.
THIS INDICATOR IS MORE THAN ENOUGH BUT I DO HAVE PRIVATE INDICATORS WITH DIFFERENT LOGIC FUNCTIONS.
I'm open for feedback/collaboration.
drsamc.

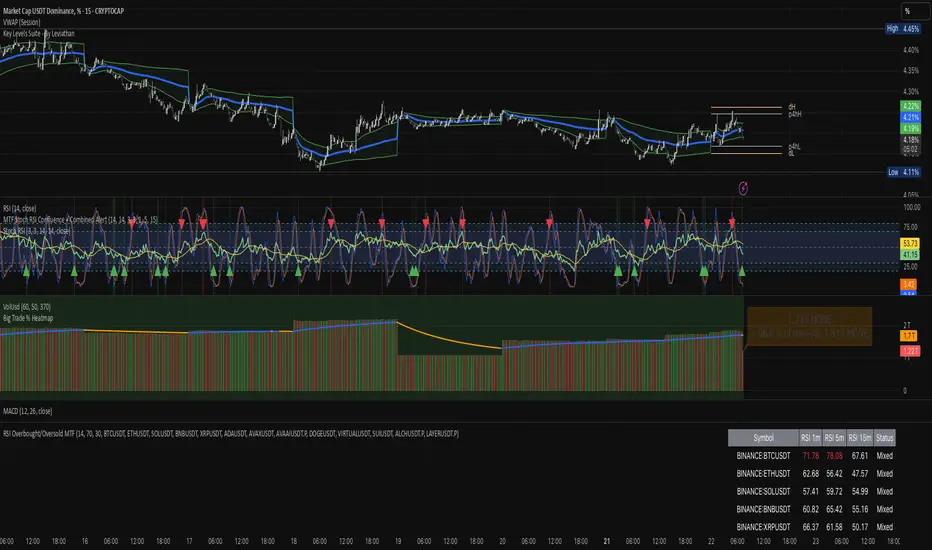
RSI Overbought/Oversold MTFRSI Overbought / Oversold MTF — Dashboard & Alerts
What it does
This script scans up to 13 symbols at once and shows their RSI readings on three lower‑time‑frames (1 min, 5 min, 15 min).
If all three RSIs for a symbol are simultaneously above the overbought threshold or below the oversold threshold, the script:
Prints the condition (“Overbought” / “Oversold”) in a color‑coded dashboard table.
Fires a one‑per‑bar alert so you never miss the move.
Key features
Feature Details
Multi‑symbol Default list includes BTC, ETH, SOL, BNB, XRP, ADA, AVAX, AVAAI, DOGE, VIRTUAL, SUI, ALCH, LAYER (all Binance pairs). Replace or reorder in the inputs.
Triple‑time‑frame check RSI is calculated on 1 m, 5 m, 15 m for each symbol.
Customizable thresholds Set your own RSI Period, Overbought and Oversold levels. Defaults: 14 / 70 / 30.
Color‑coded dashboard Top‑right table shows:
• Symbol name
• RSI 1 m / 5 m / 15 m (red = overbought, green = oversold, white = neutral)
• Overall Status column (“Overbought”, “Oversold”, “Mixed”).
Alerts built in Triggers once per bar whenever a symbol is overbought or oversold on all three time‑frames simultaneously.
Typical use cases
Scalp alignment — Enter when all short TFs agree on overbought/oversold extremes.
Mean‑reversion spotting — Identify stretched conditions across multiple coins without switching charts.
Quick sentiment scan — Glance at the dashboard to see where momentum is heating up or cooling down.
How to use
Add to chart (overlay = false; it sits in its own pane).
Adjust symbols & thresholds in the Settings panel.
Create alerts → choose “RSI Overbought/Oversold MTF” → “Any Alert() Function Call” to receive push, email, or webhook notifications.
Note: The script queries many symbols each bar; use on lower time‑frames only if your data limits allow.
For educational purposes only — not financial advice. Always test on paper before trading live.
RSI + ADX + ATR 18-01-25Combining RSI (Relative Strength Index), ADX (Average Directional Index), and ATR (Average True Range) creates a synergistic approach to technical analysis. This powerful trio covers momentum, trend strength, and volatility, providing comprehensive insights into market conditions. Here's a deeper exploration of their combined results:
1. Momentum Assessment with RSI
Purpose: RSI measures the speed and magnitude of recent price changes to determine overbought or oversold levels.
Benefit in Combination:
When RSI indicates overbought (above 70) or oversold (below 30) levels, it signals a potential reversal or correction.
However, these signals can be false in strongly trending markets, which is why ADX is used alongside it.
2. Trend Strength Confirmation with ADX
Purpose: ADX confirms the presence and strength of a trend.
Benefit in Combination:
If RSI shows a potential reversal but ADX indicates a strong trend (above 25), the trend is likely to continue, and RSI signals may need to be approached with caution.
Conversely, if ADX is below 20 (weak trend), RSI signals are more likely to indicate genuine reversals, as the market lacks a strong directional push.
3. Volatility Analysis with ATR
Purpose: ATR evaluates the level of price volatility.
Benefit in Combination:
High ATR values indicate volatile conditions where prices can move significantly; this helps in setting wider stop-loss levels to avoid premature exits.
Low ATR values suggest quieter markets, where tighter stop-losses and profit targets are more suitable.

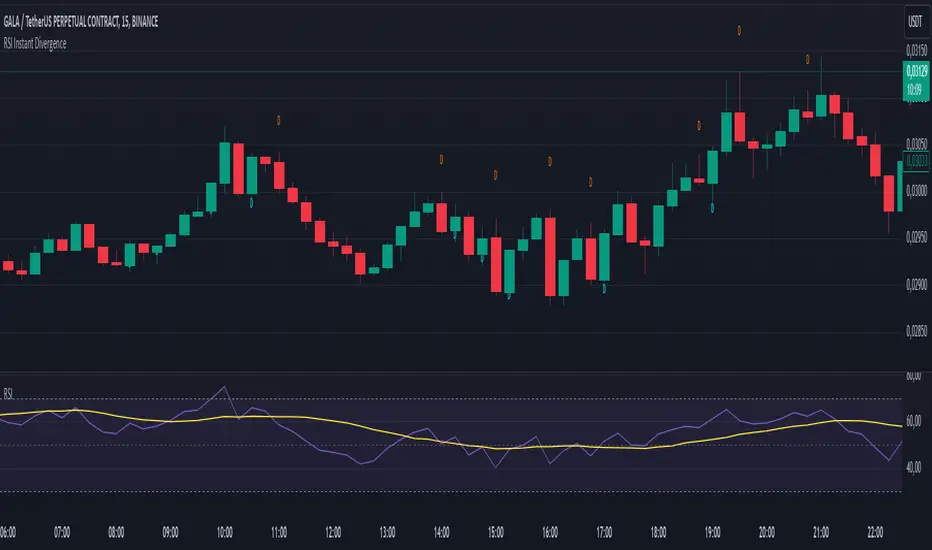
RSI Instant DivergenceThis script detects RSI divergence—a common signal indicating potential trend reversals. It compares price action and RSI behavior to identify two types of divergences:
1- Bearish Divergence (Sell Signal):
Occurs when the price forms a higher high while RSI drops (weaker momentum).
A label appears above the candle, and an alert is triggered: "Divergence: Sell Signal."
2 -Bullish Divergence (Buy Signal):
Occurs when the price makes a lower low while RSI rises (stronger momentum).
A label appears below the candle, and an alert is triggered: "Divergence: Buy Signal."
The labels are color-coded (orange for sell, blue for buy) and include detailed RSI and price info in a tooltip. Alerts help you act immediately when divergence is detected.
This tool is perfect for spotting potential trend reversals and refining your entry/exit strategy. Let me know if you'd like to customize it further! 😊
Tooltip Feature: Each label includes a tooltip with precise RSI and price details (current and previous values) as well as the percentage change in RSI, giving you deeper insight into the divergence. This tool is great for identifying trend reversal points and includes visual labels, tooltips, and alerts to make real-time trading decisions easier. Let me know if you’d like adjustments!
RSI - Made EasyThis indicator is a visually improved version of RSI. It makes it much easier to see what's happening by simplifying those confusing, intersecting lines. With this, you can detect the RSI direction more clearly. All the features are also explained in the tooltips of the input fields. Some extra features are included, such as average top and bottom calculation, standard deviation and divergences.
Color legend:
Green: RSI Above MA and Rising
Light Green: RSI Above MA and Falling
Red: RSI Below MA and Falling
Light Red: RSI Below MA and Rising
Blue: RSI Crossover MA
Orange: RSI Crossunder MA
Blue Arrow: Bullish Divergence
Orange Arrow: Bearish Divergence
RSI over screener (any tickers)█ OVERVIEW
This screener allow you to watch up to 240 any tickers you need to check RSI overbought and oversold using multiple periods, including the percentage of RSIs of different periods being overbought/oversold, as well as the average between these multiple RSIs.
█ THANKS
LuxAlgo for his RSI over multi length
I made function for this RSI and screener based on it.
allanster for his amazing idea how to split multiple symbols at once using a CSV list of ticker IDs
█ HOW TO USE
- hide chart:
- add 6 copies of screener
- change list number at settings from 1 to 6
- add you tickers
Screener shows signals when RSI was overbought or oversold and become to 0, this signal you may use to enter position(check other market condition before enter).
At settings you cam change Prefics, Appendix and put you tickers.
limitations are:
- max 40 tickers for one list
- max 4096 characters for one list
- tickers list should be separated by comma and may contains one space after the comma
By default it shows almost all BINANCE USD-M USDT tickers
Also you can adjust table for your screen by changing width of columns at settings.
If you have any questions or suggestions write comment or message.

RSI of Zero Lag MA (ValueRay)The RSI of a Zero Lag Moving Average a powerful tool for for reliable exit signals.
The Relative Strength Index (RSI) is a widely recognized momentum oscillator that measures the speed and change of price movements. It provides valuable insights into overbought and oversold conditions, enabling traders to identify potential reversal points and take advantage of market inefficiencies.
The RSI of a Zero Lag Indicator takes this concept a step further by incorporating the Zero Lag Moving Average. The Zero Lag Moving Average is a cutting-edge indicator that minimizes lag and provides a smoother representation of price action, allowing for quicker and more precise responses to market movements.
By combining the RSI with the Zero Lag Moving Average, this indicator offers traders a superior exit strategy. When the RSI reaches extreme levels of overbought or oversold conditions, it indicates a potential reversal in the market. The Zero Lag Moving Average further enhances this signal by reducing delays and providing timely exit points.
Moreover, the RSI of a Zero Lag Indicator is not limited to mean reversion strategies. While it excels in identifying mean reversion opportunities, it can also be used in conjunction with other trading approaches. Traders can take advantage of its objective signals to exit trades profitably, regardless of their chosen strategy.
With its ability to accurately pinpoint overbought and oversold conditions, the RSI of a Zero Lag Indicator offers traders a competitive edge in the market. By providing timely exit signals and minimizing lag, it helps traders optimize their trading decisions and increase their chances of success.

RSI MTF DashboardThis is an RSI dashboard, which allows you to see the current RSI value for five timeframes across up to 8 tickers of your choice. This is a useful tool to gauge momentum across multiple timeframes, where you would look to enter a buy with high RSI values across the timeframes (and vice versa for sell positions).
Conversely, some traders use RSI to identify potential areas for reversals, so you would look to buy with low RSI values (and vice versa for sell positions).
In the settings, please select which 5 timeframes you require. Then select which tickers you wish to see, and you will find a dashboard on your chart to show the RSI values. The dashboard can be highlighted when the RSI value shows bearish momentum (a value under 50, of your choice) and bullish momentum (a value over 50, again of your choice). These colours and values are fully customisable.
In the settings you can also select the location of the dashboard, as well as some colour and transparency settings to enable the best possible view on screen.

RSI Past Can Turn RSI Into a Directional ToolThe Relative Strength Index was created by J. Welles Wilder to measure overbought and oversold conditions. It’s also found popularity as an overall measure of direction because upward-trending stocks often hit overbought conditions. The opposite can be true with underperformers.
Today’s custom script, RSI Past, attempts to capture this secondary use of RSI as a directional indicator.
RSI Past achieves this by comparing how many bars have passed since RSI's most recent overbought and oversold readings. It then plots a simple difference between those two numbers.
Stocks with “bullish” signals will have positive readings that will increase each time RSI hits an overbought condition.
“Bearish” readings are just the opposite, growing more negative as oversold conditions occur.
An examination of some individual stocks may show the usefulness of this approach.
Meta Platforms , for example, hit an oversold condition almost exactly one year ago, and has remained under heavy selling pressure since:
Exxon Mobil , on the other hand, flipped to a bullish reading last October and has trended higher since:
This raises some interesting questions for Apple, shown on the main chart above. AAPL’s RSI Past has maintained a bullish reading for over a year -- unlike most other big technology stocks and the broader Nasdaq-100. Could this reflect bigger directional strength, especially with prices holding the $150 level that’s had relevance several times mid-2021?
TradeStation has, for decades, advanced the trading industry, providing access to stocks, options, futures and cryptocurrencies. See our Overview for more.
Important Information
TradeStation Securities, Inc., TradeStation Crypto, Inc., and TradeStation Technologies, Inc. are each wholly owned subsidiaries of TradeStation Group, Inc., all operating, and providing products and services, under the TradeStation brand and trademark. You Can Trade, Inc. is also a wholly owned subsidiary of TradeStation Group, Inc., operating under its own brand and trademarks. TradeStation Crypto, Inc. offers to self-directed investors and traders cryptocurrency brokerage services. It is neither licensed with the SEC or the CFTC nor is it a Member of NFA. When applying for, or purchasing, accounts, subscriptions, products, and services, it is important that you know which company you will be dealing with. Please click here for further important information explaining what this means.
This content is for informational and educational purposes only. This is not a recommendation regarding any investment or investment strategy. Any opinions expressed herein are those of the author and do not represent the views or opinions of TradeStation or any of its affiliates.
Investing involves risks. Past performance, whether actual or indicated by historical tests of strategies, is no guarantee of future performance or success. There is a possibility that you may sustain a loss equal to or greater than your entire investment regardless of which asset class you trade (equities, options, futures, or digital assets); therefore, you should not invest or risk money that you cannot afford to lose. Before trading any asset class, first read the relevant risk disclosure statements on the Important Documents page, found here: www.tradestation.com .

RSI based support resistance levelsThis indicator draws support line and resistance lines in the price chart.
How ?
For drawing the support/resistance line we need to first determine the demand and supply.
We are using too-familiar indicator RSI to determine when the script is oversold and overbought.
Now oversold (in RSI) is not a point, it’s a zone. The RSI indicator comes below 30, stays there and goes up above 30. Similarly for overbought.
Now if you carefully look at the oversold region – the lowest point of the oversold region is the place where the demand came (for surety) and push the indicator (and price) up.
Similarly: the highest point of overbought is the place where (for surety) the supply came and push the indicator (and price) down.
So that’ the supply / demand line (for surety).
In this indicator, based on the RSI we are just drawing support and resistance lines in the chat. That’s all.
What is unique ?
Trendline concept is not new. RSI is not new. RSI overbought/oversold is not new.
There are indicators exist to draw trendlines. Some of them works beautifully.
However, none of these, we are aware of, uses RSI to determine it. And, we believe, the most logical way to determine support/resistance is RSI.
Note: We are not responsible for any trading/investment decision you are taking out of the outcome of this indicator.

RSI PacingThe RSI Pacing indicator compares the movement of the RSI directly with the movement of the asset to help identify divergences.
Bullish Divergences
The RSI is increasing at a greater rate than the pace of the asset.
The RSI is decreasing at a lesser rate than the pace of the asset.
Bearish Divergences
The RSI is decreasing at a greater rate than the pace of the asset.
The RSI is increasing at a lesser rate than the pace of the asset.
Warning: Does not yet work on higher timeframes yet. Working on getting the pace normalized to the RSI's bounds.

[_ParkF]RSIRSI
Typical RSI indicators were plotted with candles and expressed wick to resemble a candle chart,
and linear regression was added to predict changes in force intensity,
which allowed us to confirm support and resistance within linear regression.
In addition, divergence signal was marked as an additional basis for the price fluctuation point due to support and resistance.
In other words,
if the diversity signal appears together when the rsi candle is supported and resisted within linear regression,
this is the basis for predicting that it is a point of change in the existing trend.
Finally, the period value and standard deviation of linear regression can be arbitrarily modified and used.
I hope it will help you with your trading.
일반적인 RSI 지표를 캔들화 하였고 꼬리까지 포함하여 캔들 차트와 유사하게 표현 하고,
캔들화한 RSI 지표에 선형회귀(채널)를 추가 하여 RSI 지표 특유의 힘의 강도의 변화를 지지와 저항으로 확인할 수 있게 해봤습니다.
또한 다이버전스 신호를 추가하여 선형회귀(채널)로 인한 지지와 저항에 따른 가격 변동의 근거로 삼을 수 있습니다.
즉, 선형회귀(채널) 안에서 RSI 캔들이 지지와 저항을 받을 때 다이버전스 신호가 함께 나타난다면 이는 기존 추세의 변화 지점임을
예측해 볼 수 있는 근거가 됩니다.
마지막으로 선형회귀(채널)의 기간값과 표준편차는 임의로 수정하여 사용할 수 있습니다.
당신의 트레이딩에 도움이 되었으면 합니다.
* I would like to express my gratitude to zdmre for revealing the linear regression source.

RSI StrategySimple way how to use RSI and MA indicators for trading.
What we use:
• RSI
• SMA calculated by RSI (title: SMA_RSI)
• Delta of RSI and SMA_RSI (title: delta)
• SMA calculated by delta of RSI and SMA & RSI (title: SMA_RSI2)
Logic:
Upon the fact that we use the difference between two indicators that have similar values ( RSI and SMA_RSI), we get number around zero. Next, result is smoothed by calculated the SMA . This is the blue/purple line that appears on the chart - SMA_RSI2.
The trade open when SMA_RSI2 cross over the threshold. The trade close when SMA_RSI2 cross under the threshold below.
Also, the usual EMA 200 is used as a filter, which you can switch on or switch off.

RSI StrategyThis RSI strategy is different than most in that it doesn't pick a buy signal based on the RSI rising above a specific number (usually 30). Instead, it creates a 14 day exponential moving average of the Relative Strength Index and uses the following two conditions together to trigger a buy:
Entry conditions:
Condition1: Rising of the RSI's moving average for (user defined) candles in a row
Condition 2: The RSI is < 70
The reasoning behind condition 1 is that we are trying to buy into a rising trend, the moving average helps to confirm the trend, whereas the RSI rising above a specific number (usually 30) gives us no real indication that the asset will increase and produces less wins overall. The reasoning behind condition 2 is to avoid buying at the top of a climb.
Exit conditions:
Condition 1: The RSI moving average is falling
Condition 2: Close < Trailing stop activation Level
Condition 3: We have at least (user defined) % profit
The reasoning behind sell condition 1 is a falling RSI moving average (down trend starting). The close has to be under the trailing stop activation level, if we've triggered the trailing stop, we want the trailing stop to do it's job and not exit the trade until the trailing stop takes us out. The reasoning behind condition 3 is to not exit without at least some profit (user defined).
