RSI Buy/Sell SignalsThis Pine Script is designed to plot Buy and Sell signals based on the Relative Strength Index (RSI) for both 15-minute and hourly timeframes. It calculates the RSI values for the current 15-minute chart and requests the hourly RSI data for comparison. Buy signals are generated when the RSI crosses above 60 in either timeframe, while sell signals occur when the RSI crosses below 40. The script also plots visual markers on the chart, indicating buy signals with green labels below the price bars and sell signals with red labels above the price bars. Additionally, it allows for alert conditions, notifying the user when a buy or sell signal is triggered.
Cerca negli script per "rsi"

RSI Sector analysis
Screening tool that produces a table with the various sectors and their RSI values. The values are shown in 3 rows, each with a user-defined length, and can be averaged out and displayed as a single value. The chart is color coded as well. Each ETF representing a sector can be looked at individually, with the top holdings in each preprogrammed, but users can define their own if they wish. The left most ticker is the "benchmark"; SPY is the benchmark for the various sectors, and the ETF is the benchmark for the tickers within.
Symbols are color coded: light blue text indicates that a symbol has greater RSI values in all three timeframes than the benchmark (the leftmost symbol). Orange text indicates that a symbol has a lower RSI value for all three timeframes. In the first row, light blue text indicates the largest RSI increase from the third row to the first row. Orange text indicates the largest RSI decrease from the third row to the first row.
A blue highlight indicates that the value is the highest among the tickers, excluding the benchmark, and an orange highlight indicates that the value is the lowest among the tickers, also excluding the benchmark. A blue highlight on the ticker indicates that it has the highest average value of the 3 rows, and a orange highlight on the ticker indicates that it has the lowest average value of the 3 rows.

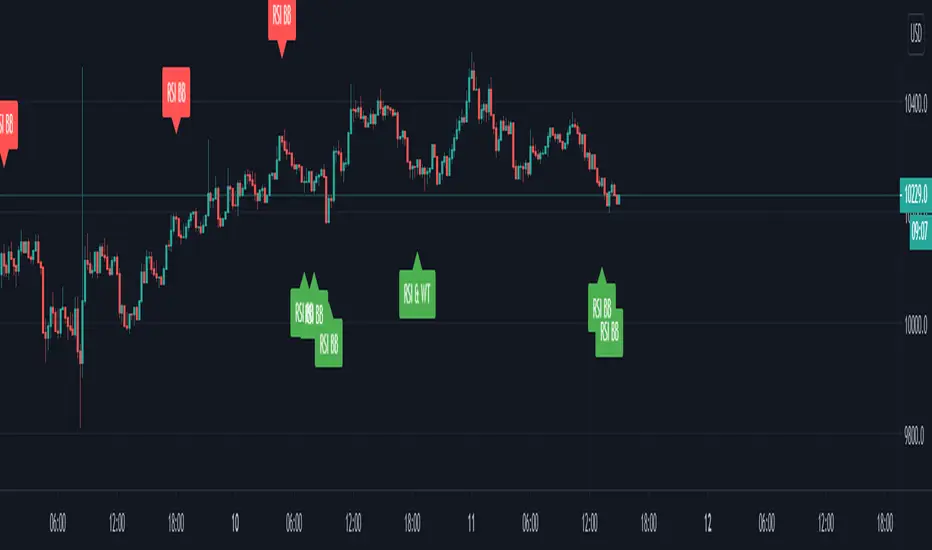
RSI TrendsThis TradingView script combines RSI trend analysis with FVG (Fair Value Gap) detection to identify potential buy and sell opportunities in financial markets. The script is customizable and provides extensive visual feedback directly on the chart, enhancing both strategic entry and exit points for traders. Raw code of FVG was taken from LuxAlgo
Features
FVG Detection: Identifies Fair Value Gaps (FVG), and provides options to display these gaps based on user settings.
RSI Trend Bars: Utilizes the Relative Strength Index (RSI) to paint bars indicating overbought and oversold conditions. This helps traders understand current market sentiment and potential reversal points.
Customizable Settings: Users can customize the timeframe, FVG types, and RSI thresholds. This flexibility allows the script to be adapted to various trading styles and timeframes.
Historical Analysis: Option to display or hide historical FVGs, helping users analyze past market behavior without cluttering the chart.
Alert System: Integrated alerts for detected buy and sell signals based on RSI conditions and the presence or absence of FVGs. This feature notifies traders of potential trading opportunities.
Trading Signals
Buy, Buy+, and Buy++ Signals: These signals are triggered based on overbought conditions without corresponding bearish FVG presence, with increasing stringency for higher tiers of buy signals.
Sell, Sell+, and Sell++ Signals: These signals are based on oversold conditions devoid of bullish FVG presence, with each subsequent plus sign indicating a higher level of confirmation required to trigger the signal.
Use Case
Ideal for traders who rely on technical analysis and are looking for an automated way to spot potential buy and sell points using both price action gaps and momentum indicators.
Customization
All input parameters are adjustable directly from the indicator's settings panel, making it easy to tailor the tool to your trading needs and preferences.

RSI-HeatmapThis unique indicator is a comprehensive tool designed for traders seeking to gain an edge in the market. It consists of three main components: a revised RSI, a dynamic heatmap, and an integrated alert system.
1.Modified RSI:
Unlike the traditional RSI that calculates delta as the difference between the current price and the previous price (Δ = {price} - {previous price}), this version computes delta by comparing the current price with the price n periods ago (Δ = {price} - {n-th previous price}). This delta is then smoothed using a Volume Weighted Moving Average (VWMA) with a short length to preserve the RSI's core characteristics while adapting it to capture longer-term momentum shifts more effectively.
2.Heatmap:
The heatmap feature introduces a novel approach to visualize market conditions, with 5 high levels and 5 low levels identified around the current price. When the price crosses these thresholds, the RSI-based heatmap changes colors, ranging from blue (indicative of oversold conditions) to red (signaling overbought conditions). This visual tool helps traders quickly gauge the strength and potential reversal points in the market.
3.Alert:
The Alert system employs MACD (Moving Average Convergence Divergence) and CCI (Commodity Channel Index) indicators to signal potential buy or sell opportunities. It categorizes alerts into four color-coded recommendations:
Green and Lighter Green: Strong buy signal, suggesting favorable conditions for entering buy positions.
Blue and Lighter Blue: Moderate buy signal, indicating less robust but potentially profitable buy conditions.
Red and Lighter Red: Strong sell signal, advising traders to consider taking sell positions.
Orange and Lighter Orange: Moderate sell signal, hinting at sell conditions that are not as compelling as those indicated by red.

RSI MFI MultiTimeframe Oversold/OverboughtHello Traders,
This indicator is designed to easily visualize the overbought/oversold states of RSI and MFI across multiple timeframes.
The indicator is very straightforward.
The deeper the red, the closer it is to 0, and the deeper the green, the closer it is to 100. The intermediate values are rendered in a transparent gray to focus on the key regions.
However, I understand that traders may have an interest in knowing the most recent state of the oscillator, whether it was overbought or oversold.
For this reason, I have included the 'Gradient Color' option in the color settings.
By turning off this option, you can easily see at a glance which region the oscillator was in most recently.
(Gradient Color Option Off)
In addition, I know that many traders are interested in the actual RSI/MFI values across multiple timeframes.
Thus, I have displayed the RSI/MFI values for each timeframe on the far right.
Furthermore, although the name of this indicator is RSI MFI MultiTimeframe Oversold/Overbought, I have also included the Stochastic RSI as an option, as I find it personally useful.
Feel free to use it if you find it helpful.

RSI Chart LevelsThe RSI Chart Levels shows you in a simple way where Support/Resistance might be. You want to make sure all settings are the same in the RSI that you are using with this overlay to be accurate.
This is also good at spotting divergence in real-time. If price goes over the Higher High but the RSI hasn't gained a new Higher High it is showing divergence, vice versa for Lower Low.
This overlay was created with the idea of RSI Divergence Scanner by zdmre indicator. Add his RSI and match the settings to the chart overlay. The default Zigzag is set to 7 which zdmre settings is different so change to whatever you prefer.
Shoutout to zdmre original work!

RSI Accumulation/Distribution [M]Hello everyone,
After my long tests, I observed that the rate of change of direction of the price was high after the periods when the RSI spent a long time outside the band. As a result of my observations, I prepared this indicator.
This indicator shows you the accumulation and distribution areas that occur outside the rsi band.
There are 3 different levels available.
Level 1 = 5 Bars
Level 2 = 7 Bars
Level 3 = 9 Bars
For example, if the RSI spends more than 9 bars below the 30 level or above the 70 level, it will paint that area red. Levels can be changed from the indicator settings. The rsi is smoothed with simple moving average to reduce fake signals.
Using the RSI A/D indicator with different indicators or patterns will increase your success rate.
Examples:

RSI Objective LinesThe RSI is a contrarian indicator bounded between 0 and 100 where values close to the area of 30 represent an oversold condition and values close to the area of 70 represent an overbought condition.
Generally, we use the area of 70/75 and the area of 30/25 as extremes that signal a market reversal or a correction. But what if we calculate a simple way to make these levels more dynamic?
The main idea from these objective support and resistance levels is that market regime and dynamics move and as such fixed levels are unlikely to always provide value which means that we can try creating variable levels. The objective support and resistance levels are created following these steps:
* Calculate a 14-period RSI on the close price, let's call this RSI_Close.
* Calculate a 14-period RSI on the high price, let's call this RSI_High.
* Calculate a 14-period RSI on the low price, let's call this RSI_Low.
* Calculate the maximum range which is the highest value of RSI_High in the last 200 periods minus the lowest value of RSI_Low in the last 200 periods. Let's call this Max_Range
* Define the range width. By default, it is set to 5%. Let's call this Threshold.
* The objective support is calculated as the sum of the RSI_Low + (Max_Range * Threshold).
* The objective resistance is calculated as the sum of the RSI_High - (Max_Range * Threshold).
The levels are used in the same way as the oversold and overbought levels. They are more dynamic as they take into account the fluctuations of the RSI so you might see at some point in time a support at 20 and at another at 35.

RSI Trend Veracity (RSI TV)The RSI only plots itself between a high and a low value. It does not show its bullish/bearish sentiment.
The RSI TV shows the sentiment and helps anticipate the RSI trend but not the price trend.
When the Trend Veracity Line is in green, there is bullish sentiment. When it is in red, there is bearish sentiment.
The closer the lines get to their extremities, the more the current trend of the RSI is exhausted.
It works quite well even in choppy markets. See notes in the picture for more details.

RSI Buy & Sell Trading ScriptThis is my first attempt at a trading script using the RSI indicator for Buy & Sell signals (so please be nice but would appreciate any constructive comments).
Starting with $100 initial capital and using 10% per trade
You can select which month the backtesting starts
There is also a monthly table (sorry can’t remember who I got this from) that shows the total monthly profits, but you’ll need to turn it on by going into settings, Properties and in the Recalculate section tick the “On every tick” box
It should do the following:
Open Buy order if the RSI > 68 and the current Moving Average is greater than the previous Moving average
• TP1 = 50% of Order at 0.4%
• TP2 = 50% of order at 0.8%
• SL = 2% below entry
• Close Buy order if the RSI < 30
Open Sell order if the RSI < 28 and the current Moving Average is less than the previous Moving average
• TP1 = 50% of Order at 0.4%
• TP2 = 50% of order at 0.8%
• SL = 2% above entry
• Close Buy order if the RSI < 60
I would like to build on this if you have any ideas/ code that could help like the following:
• Move the SL to break even when it hits TP1
• Move the SL to TP1 when TP2 hits
• Moving take profit code so I can let the some of the trade stay in play (activate if it hits 1% profit and close trade if price retracts 0.5%)

RSI Wave SignalsQuick Description: Smoothed RSI with optimized trailing moving average. Look for cross above or cross under signals for buy and sell orders respectively.
VIDYA moving average of RSI incorporated with "optimized trend tracker" system. Thanks to kivancozbilgic and anilozeksi for implementing this great idea on Tradingview. The indicator adds "1,000" to the RSI MA values for more natural and accurate percentage trailing.
Settings:
- Period MA is the moving average length of the blue line
- Trailing Percentage of MA adjusts the percentage (sort of) trailing level of the moving average.
- RSI Length adjusts the rsi length in calculation.
Trading Tips:
- System might be enhanced by taking signals only on "oversold" or "overbought" territories (i.e <~1020 or >~1080)
- Adjust position size of by 4 times of atr(length=14)
- Take 50% of position as profit when position reaches the 4*atr TP Level (breakeven)
- Let the rest ride.
- Best performing on short frequencies such as 1, 3, 5 mins.

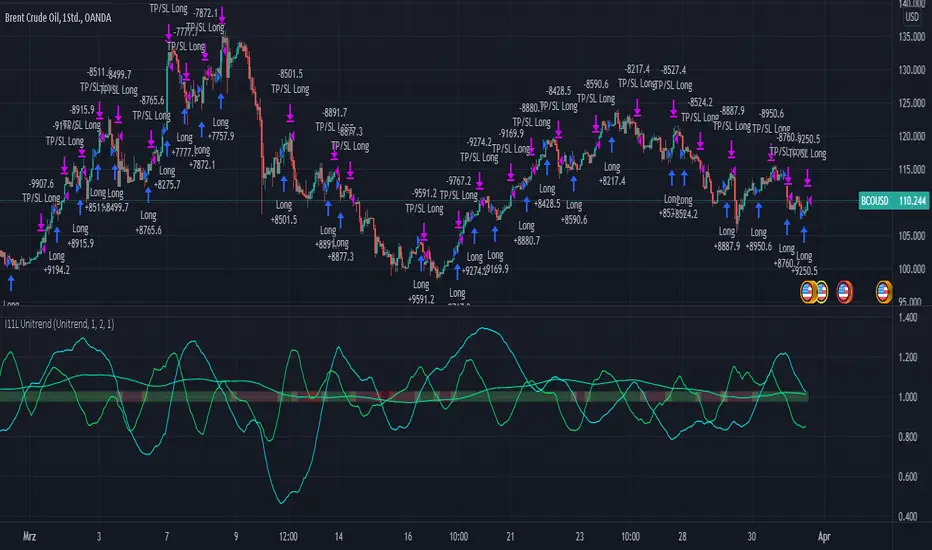
RSI, EMA, SMA Trendtrading - Oil Daytrading 1HThe Unitrend trading System produces trading recommendations on a pure Trend basis.
It is a Score based system.
--- How to use the System --
Simply adjust your capital you want to risk per trade and your TP Factor.
The TP Factor is the multiple of your risked Capital, also known as Risk/Reward ratio.
Furthermore you can toggle between a always Buy mode, to see if the System is better then market.
Compounding mode helps you to get a better understanding of your maximum drawdown with a total equity based approach.
--- How are Signals produced? ---
A score of 2 or 3 is a BUY signal.
You can count the score by looking at the lines above 1, or by reading the color.
Green is 3, yellow 2, orange 1 and red is 0.
The score is calculated by 3 conditions.
Each applying condition yields one point for the score.
The score resets each bar.
The rules are:
RSI > 45: Well known indicator, usually looks for reversal points but seems to produce above average results when above 45.
EMA(RSI) > SMA(RSI): My approach to momentum detection for the RSI movement, I consider a faster growing RSI as a good thing.
EMA(close) > SMA(close): My approach to trend detection for the market movement. Common Wisdom would be a fast SMA > slow SMA which I found to be too slow for the modern market.
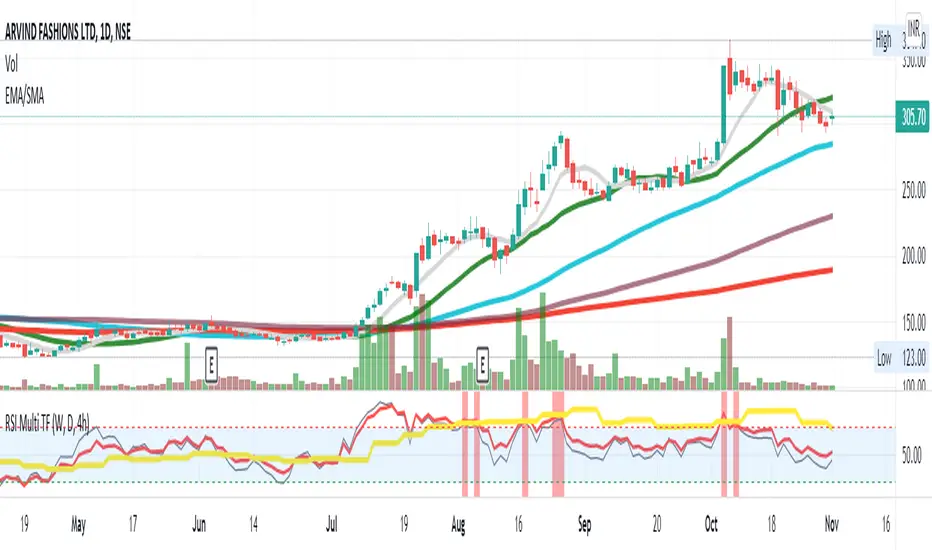
RSI Multi TF strategy
The RSI is a very popular indicator that follows price activity.
It calculates an average of the positive net changes, and an average
of the negative net changes in the most recent bars, and it determines
the ratio between these averages. The result is expressed as a number
between 0 and 100. Commonly it is said that if the RSI has a low value,
for example, 30 or under, the symbol is oversold. And if the RSI has a
high value, 70 for example, the symbol is overbought.
Plots 3 RSI (Weekly, Daily, 4h) at the same time, regardless of the Chart Timeframe.
Highlights in green (or red) if all RSI is oversold (or overbought).
Can trigger custom oversold and overbought alerts when all 3 lines grey(4h), yellow(weekly), and red(daily) go in the oversold or overbought zone. The strongest the curves break the barrier the strongest the alert (vertical red and green bars) shows.
RSI CrayonsThis simple script colors candles based on the Relative Strength Index. RSI Values > 50 are solid colors, RSI values < 50 are pastels, with additional colors/fills/alerts for overheated and oversold (both user adjustable thresholds) conditions.
As an added bonus, RSI can be calculated by non-traditional methods (not using the running/smoothed moving average) using a variety of different moving averages, but you may have to adjust the time-frame for 'faster' moving averages. An option for plotting the moving average basis is also available.
Value Added:
This indicator can be used to chart RSI without adding an "oscillator frame" to your chart, since we don't normally care too much about RSI values between 30 and 70 under normal conditions.

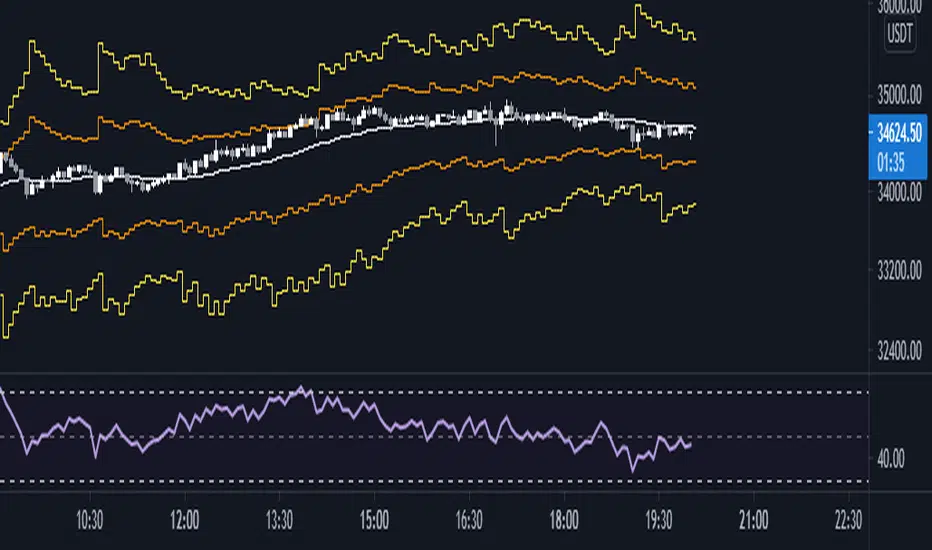
RSI OverBought/Sold Price PredictUsing the RSI formula, predict what price should be next to be oversold or overbought.
For using support and resistance, turn on "smoothing" option.
White Line = what price should be next to be RSI = 50.
Orange Line = what price should be next to be RSI = 70 or 30 (Default)
Yellow Line = what price should be next to be RSI = 80 or 20 (Default)
Green Line = what price should be next to be RSI = 90 or 10 (Default)
RSI medianA RSI implementation tailored for a specific use case.
Instead of using RSI with oversold and overbought values, I use it as a median value.
If the RSI is above 50, the trend is bullish.
If the RSI is below 50, the trend is bearish.
This indicator is customized to help you easily identify market strength/weakness based on which side of the median value the RSI is.

RSI Divergence (chiefwils0n)Greetings All,
This simple indicator is a stylistic modification of the original TradingView Divergence indicator. I've enhanced the following:
Styles
RSI will turn RED when overbought and CYAN when oversold. CYAN presents an LONG opportunity, while RED is where I look for SHORT entries.
Added background color to the the Oversold/Mid-Level and Overbought/Mid-Level. The idea is to go LONG when RSI is in the GREEN channel, and consider closing your position when RSI is the RED channel. Or, SHORT in the RED, and close your position in the GREEN.
Hidden Divergences are styled with muted colors. Maroon is Hidden Bearish and Dark Green is Hidden Bullish.
Regular Divergences have brighter labels with Red (Bearish) and Lime (Bullish). My logic is to bring attention to these divergences, since they are stronger than hidden divergences.
Alerts:
I also added the following alerts:
Bullish Divergence
Hidden Bullish Divergence
Bearish Divergence
Hidden Bearish Divergence
RSI Overbought
RSI Oversold'
The alerts really distinguish this script for me. I hope you enjoy.
Happy Trading!
RSI Trend CryptoDear community,
Today I want to present you one of my favorite and simple trading bots: The RSI Trend.
This bot is based on the RSI, which normally is used as a trend reversal indicator. However, here it’s used as a trend finding indicator, often with great success. This bot making long-only trades, which is quite successful in bull-markets like the one we’re currently in.
In case you want to use an emergency exit for your trade, toggle the Emergency Exit parameter. During bull-markets it’s better in the long term to keep this option off.
Currently the bot only makes one trade at a time (pyramiding = 1), for higher risk and higher rewards you can increase this parameter. More than 5 is not advised.
I’ve optimized this bot on 15min time frame. It has some decent results for most cryptos on this TF, feel free to test this out.
In case you want to hook this bot up to your exchange, feel free to edit the ALERT messages in the code.
Default Trading Rules:
Long: RSI crosses over 35
Close Long: RSI crosses under 75
Emergency Exit: RSI crosses under 10

RSI+PA+DCA StrategyDear Tradingview community,
This RSI based trading strategy is created as a training exercise. I am not a professional trader, but a committed hobbyist. This not a finished trading strategy meant for trading, but more a combination of different trading ideas I liked to explore deeper. The aim with this exercise was to gain more knowledge and understanding about price averaging and dollar cost averaging strategies. Aside that I wanted to learn how to program a pyramiding strategy, how to plot different order entry layers and how to open positions on a specific time interval.
In this script I adapted code from a couple of strategy examples by Coinrule . Who wrote simple and powerful examples of RSI based strategies and pyramiding strategies.
Also the HOWTO scripts shared by vitvlkv were very helpful for this exercise. In the script description you can find all the sources to the code.
A PA strategy could be a helpful addition to ease the 'stress-management to buy when price drops and resolution in selling when the price is rising' (Coinrule).
The idea behind the strategy is fairly simple and is based on an RSI strategy of buying low. A position is entered when the RSI and moving average conditions are met. The position is closed when it reaches a specified take profit percentage. As soon as the first the position is openend multiple PA (price average) layers are setup based on a specified percentage of price drop. When the price crosses the layer another position with somewhat the same amount of assets is entered. This causes the average cost price (the red plot line) to decrease. If the price drops more, another similar amount of assets is bought with another price average decrease as result. When the price starts rising again the different positions are separately closed when each reaches its specified take profit. The positions can be re-openend when the price drops again. And so on. When the price rises more and crosses over the average price and reached the specified take profit on top of it, it closes all the positions at once and cancels all orders. From that moment on it waits for another price dip before it opens a new position.
Another option is to activate a DCA function that opens a position based on a fixed specified amount. It enters a position at the start of every week and only when there are already other positions openend and if the current price is below the average price of the position. Like this buying on a time interval can help lowering the average price in case the market is down.
I read in some articles that price averaging is also called dollar cost averaging as the result is somewhat the same. Although DCA is really based on buying on fixed time intervals. These strategies are both considered long term investment strategies that can be profitable in the long run and are not suitable for short term investment schemes. The downturn is that the postion size increases when the general market trend is going down and that you have to patiently wait until the market start rising again.
Another notable aspect is that the logic in this strategy works the way it does because the entries are exited based on the FIFO (first in first out) close entry rule. This means that the first exit is applied to the first entry position that is openend. In other words that when the third entry reaches its take profit level and exits, it actually exits the first entry. If you take a close look in the 'List of Trades' of your Strategy Tester panel, you can see that some 'Long1' entries are closed by an 'Exit 3' and not by an 'Exit 1'. This means that your trade partly loses, but causes a decrease in average price that is later balanced out by lower or repeated entering and closing other positions. You can change this logic to a real sequential way of closing your entries, but this changes the averaging logic considerably. In case you want to test this you need to change, in this line in the strategy call 'close_entries_rule = "FIFO"', the word FIFO to ANY.
In the settings you can specify the percentage of portfolio to use for each trade to spread the risk and for each order a trading fee of 0.075% is calculated.

RSI Classic Strategy (by Coinrule)One of the questions hobbyist traders more often ask is: what is the perfect trading indicator?
Every indicator is just a tool, so its efficiency is proportional to your ability to read its signals and translate them into an actionable trading strategy. The RSI is likely the most flexible and easy to use among the technical indicators.
This trading strategy tries to catch short-term swings on the coins of your choice with a simple yet profitable setup.
Buy when the RSI is lower than 30 (you can adjust it to 35 in times of steep uptrend).
Sell when the RSI is greater than 65 (the target may range between 60 and 75 depending on the volatility of the coin).
Note that the buy signal comes when the indicator crosses below 30 and not when it crosses above 30 as it happens on the built-in RSI strategy on Tradingview.
The present script overperforms the built-in strategy, even adding trading fees and using a lower amount of capital for each trade (30%). That means that the system can deliver higher net-profits with lower risk levels.
A typical example of market conditions where this strategy works perfectly is as follows.
The first initial breakout indicates that a new leg up in the trend may start. Bitcoin starts to trade within a range which you can identify when it reaches the point 3. That is the perfect time to start the rule because
- trading within a channel anticipates possible swings up and down
- the trend is on the upside, providing low downside risk in buying the dips.
This strategy works well with selected coins of your choice, and it's a great fit on leverage exchanges like Binance Futures.
If you prefer to run it across all available coins on the market, instead, you may choose an optimized version.

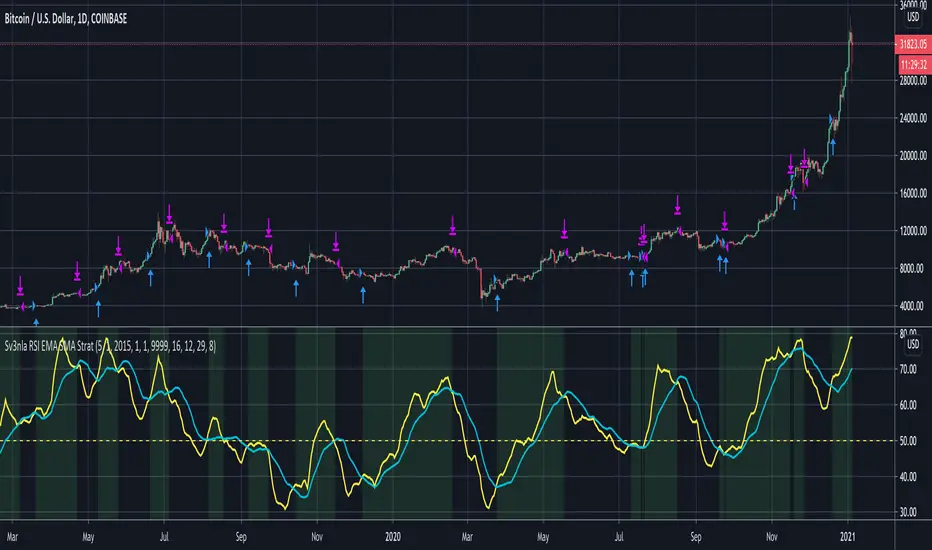
RSI EMA SMA StratThis script looks at the RSI EMA and RSI SMA crossovers when above a certain price EMA
It was mainly written for swingtrading and only for long positions on a daily timeframe for BTC and ETH. They idea is to have a script that indicates when to convert your BTC /ETC to a stable coin and when to buy in again.
You could try to use it for other positions (short, long, etc..) and other coins but I didn't test these.
When the RSI EMA & SMA hover around 50 for a few days in flat lines and you get a buy signal it may be best to wait a few days longer to see what direction they take.
The default values for RSI EMA , RSI SMA and price EMA gave the best return (start out with an amount of x coins in 2015 and end up with the biggest possible amount of coins today). Again, this was only tested on daily. Feel free to tweak these when using other timeframes or other coins
RSI of VWAP [SHORT selling]This is SHORT selling version of RSIofVWAP strategy. Settings and Logic are totally different from LONG side version , hence I am publishing it as a new strategy.
Settings
============
VWAP of RSI Length 15
Slow EMA Length 200
Short entry level 25
Cover short level 70
stop loss 5
SHORT Entry
============
condition1 : When RSIofVWAP crossdown below 25 and VWAP is below ema200
condition2: When weekly RSIofVWAP crossdown 70 and VWAP (note : session vwap , not weekly vwap) is below ema200
condition3: Use VIX value , if you want to short when the price is above ema200
vwap RSI crossing down 70 and VIX RSI is cossing up 70
enter short ... This is like falling knife :-)
I need to add the code -- later
if any of above condition is TRUE , SHORT entry will be taken
Take Profit
============
When close less than short entry price and RSIofVWAp is crossing up 25 , take profit ...close 1/3 of the position
Exit
============
When RSIofVWAP crossing up 70 level
Stop Loss
============
Stop Loss is set to 5%
Note:
1. When strategy is in SHORT position , background and bar color changes to gray
2. When strategy is already in short position , possible entries are shown in yellow background
3. RSI Length 15 is working most of the equities on hourly chart. ( RSI length 9 and 14 also works good , but not for all ... You may want to try which setting works for your symbol)
4. weekly VWAP (blue color) is also plotted by default ... you can disable it if you dont want to see it. But there is advantage keeping it on the chart , you can notice whenever weekly VWAP crosses above 70 line , trend is UP ... if you have LONG position you can hold on it ... Hurray :-)
Warning
============
For the educational purposes only

RSI combined with 3 different indicatorsThis is RSI combined with 3 different indicators that prints signals as a overlay
1. RSI cross Bollinger Band indicator that paints bgcolor short and long signals when the RSI cross's up through the lower bollinger band ( Long ) or cross's down through the upper bollinger band ( Short )
2. RSI and Wave Trend Dot combination
3. RSI and Directional Index Indicator combinations
You can turn on and off any of the signals, and have alerts for all 3, or individually
Please note the Range Filter code in the script is not part of the final signals as i have set the bars back 100, so thatis always that condition meet
Also please note there is still noise with this, you need to use with something else like MFI or VFI