RSI Classic Strategy (by Coinrule)One of the questions hobbyist traders more often ask is: what is the perfect trading indicator?
Every indicator is just a tool, so its efficiency is proportional to your ability to read its signals and translate them into an actionable trading strategy. The RSI is likely the most flexible and easy to use among the technical indicators.
This trading strategy tries to catch short-term swings on the coins of your choice with a simple yet profitable setup.
Buy when the RSI is lower than 30 (you can adjust it to 35 in times of steep uptrend).
Sell when the RSI is greater than 65 (the target may range between 60 and 75 depending on the volatility of the coin).
Note that the buy signal comes when the indicator crosses below 30 and not when it crosses above 30 as it happens on the built-in RSI strategy on Tradingview.
The present script overperforms the built-in strategy, even adding trading fees and using a lower amount of capital for each trade (30%). That means that the system can deliver higher net-profits with lower risk levels.
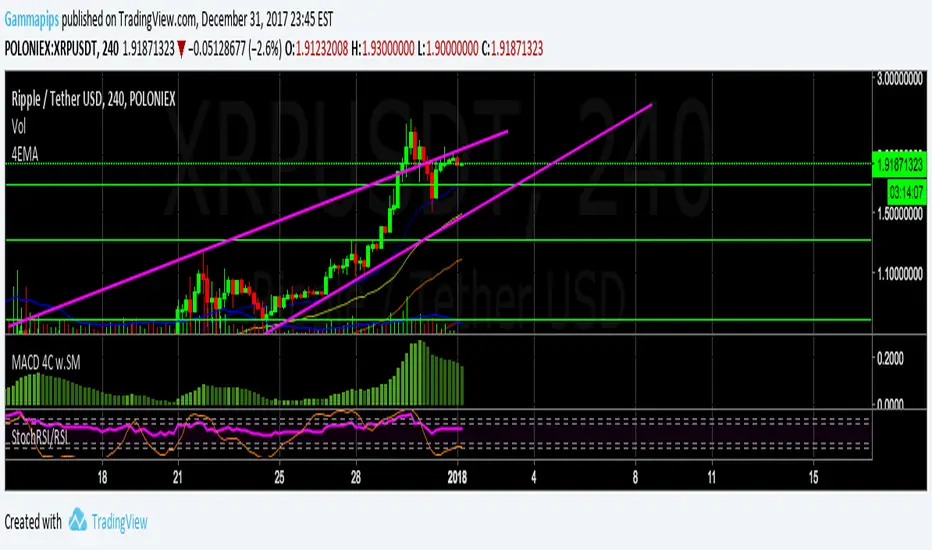
A typical example of market conditions where this strategy works perfectly is as follows.
The first initial breakout indicates that a new leg up in the trend may start. Bitcoin starts to trade within a range which you can identify when it reaches the point 3. That is the perfect time to start the rule because
- trading within a channel anticipates possible swings up and down
- the trend is on the upside, providing low downside risk in buying the dips.
This strategy works well with selected coins of your choice, and it's a great fit on leverage exchanges like Binance Futures.
If you prefer to run it across all available coins on the market, instead, you may choose an optimized version.
Cerca negli script per "rsi"

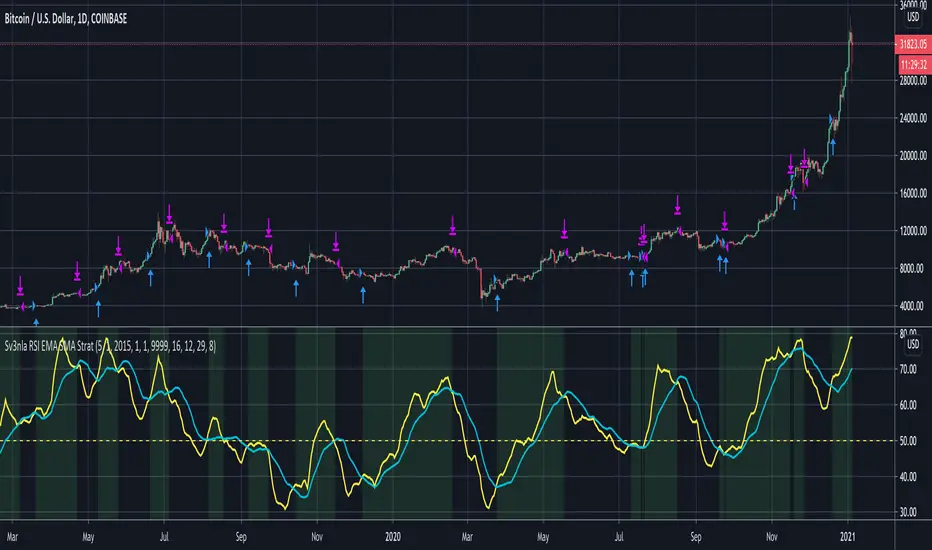
RSI EMA SMA StratThis script looks at the RSI EMA and RSI SMA crossovers when above a certain price EMA
It was mainly written for swingtrading and only for long positions on a daily timeframe for BTC and ETH. They idea is to have a script that indicates when to convert your BTC /ETC to a stable coin and when to buy in again.
You could try to use it for other positions (short, long, etc..) and other coins but I didn't test these.
When the RSI EMA & SMA hover around 50 for a few days in flat lines and you get a buy signal it may be best to wait a few days longer to see what direction they take.
The default values for RSI EMA , RSI SMA and price EMA gave the best return (start out with an amount of x coins in 2015 and end up with the biggest possible amount of coins today). Again, this was only tested on daily. Feel free to tweak these when using other timeframes or other coins
RSI of VWAP [SHORT selling]This is SHORT selling version of RSIofVWAP strategy. Settings and Logic are totally different from LONG side version , hence I am publishing it as a new strategy.
Settings
============
VWAP of RSI Length 15
Slow EMA Length 200
Short entry level 25
Cover short level 70
stop loss 5
SHORT Entry
============
condition1 : When RSIofVWAP crossdown below 25 and VWAP is below ema200
condition2: When weekly RSIofVWAP crossdown 70 and VWAP (note : session vwap , not weekly vwap) is below ema200
condition3: Use VIX value , if you want to short when the price is above ema200
vwap RSI crossing down 70 and VIX RSI is cossing up 70
enter short ... This is like falling knife :-)
I need to add the code -- later
if any of above condition is TRUE , SHORT entry will be taken
Take Profit
============
When close less than short entry price and RSIofVWAp is crossing up 25 , take profit ...close 1/3 of the position
Exit
============
When RSIofVWAP crossing up 70 level
Stop Loss
============
Stop Loss is set to 5%
Note:
1. When strategy is in SHORT position , background and bar color changes to gray
2. When strategy is already in short position , possible entries are shown in yellow background
3. RSI Length 15 is working most of the equities on hourly chart. ( RSI length 9 and 14 also works good , but not for all ... You may want to try which setting works for your symbol)
4. weekly VWAP (blue color) is also plotted by default ... you can disable it if you dont want to see it. But there is advantage keeping it on the chart , you can notice whenever weekly VWAP crosses above 70 line , trend is UP ... if you have LONG position you can hold on it ... Hurray :-)
Warning
============
For the educational purposes only

RSI combined with 3 different indicatorsThis is RSI combined with 3 different indicators that prints signals as a overlay
1. RSI cross Bollinger Band indicator that paints bgcolor short and long signals when the RSI cross's up through the lower bollinger band ( Long ) or cross's down through the upper bollinger band ( Short )
2. RSI and Wave Trend Dot combination
3. RSI and Directional Index Indicator combinations
You can turn on and off any of the signals, and have alerts for all 3, or individually
Please note the Range Filter code in the script is not part of the final signals as i have set the bars back 100, so thatis always that condition meet
Also please note there is still noise with this, you need to use with something else like MFI or VFI
RSI cyclic smoothed v2Cyclic Smoothed Relative Strength Indicator
The cyclic smoothed RSI indicator is an enhancement of the classic RSI , adding
additional smoothing according to the market vibration,
adaptive upper and lower bands according to the cyclic memory and
using the current dominant cycle length as input for the indicator.
The cRSI is used like a standard indicator. The chart highlights trading signals where the signal line crosses above or below the adaptive lower/upper bands. It is much more responsive to market moves than the basic RSI.
You can also review this short idea where BTC went down from 4300 USD (3 Sept 17) to 3700 USD (15 Sept 17) after the idea was posted and showed the clear short exit with the next low:
The indicator uses the dominant cycle as input to optimize signal, smoothing and cyclic memory. To get more in-depth information on the cyclic-smoothed RSI indicator, please read Chapter 4 "Fine tuning technical indicators" of the book "Decoding the Hidden Market Rhythm, Part 1" available at your favorite book store.
This is the open-source code version of the requested script already published as protected indicator back in 2017 "RSI cyclic smoothed". Now made public as v2. Would love to receive feedback and see your ideas.

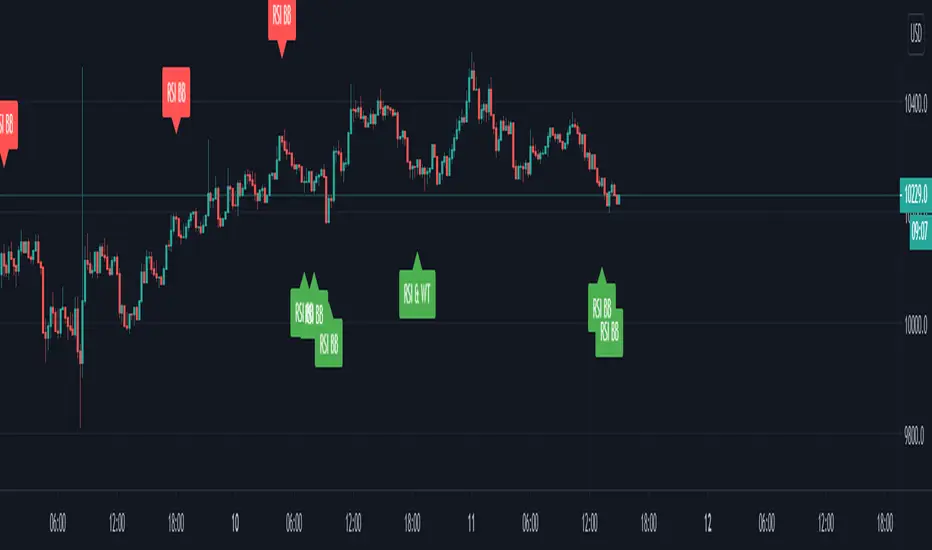
RSI Call-outs [BigBitsIO]This is a simple RSI indicator that overlays the current chart to show labels for specified oversold and overbought areas defined with inputs.
It will delete any labels of the same kind within the last 3 candles so you don't see as many labels as you would otherwise.
Red labels with white text represent overbought RSI levels as defined by the user.
Green labels with black test represent oversold RSI levels as defined by the user.
This RSI overlay help easily call-out overbought and oversold candles on a chart without sacrificing screen space for a traditional RSI indicator that is not overlayed on the chart.

RSI & StochasticA combination of RSI and Stochastic using default settings.
- RSI or Relative Strength Index is the white line.
- Stochastic %K is the aqua line
- Stochastic %D is the orange line
- The purple rectangle is the RSI range going from 30 (oversold) at the bottom to 70 (overbought)
- The top dotted line indicates the price being overbought on the stochastic
- The bottom dotted line indicates the price oversold on the stochastic
I mainly use both indicators to spot divergence/ potential upcoming turning points (tops or bottoms).
For example on the chart the white line shows the price of Bitcoin Rising
While the yellow line shows the stochastic declining and the red RSI stayed more or less at the same level.
Another way to use this indicator is to use the aqua line crossing above the orange line as an entry for a long trade this strategy is most useful when both are near the bottom of the range. The opposite is true for short trades but
both should be combined with other indicators such as moving averages support levels or volume for best results.
Generally RSI is more useful in trending markets & the stochastic is more useful in sideways or choppy markets.

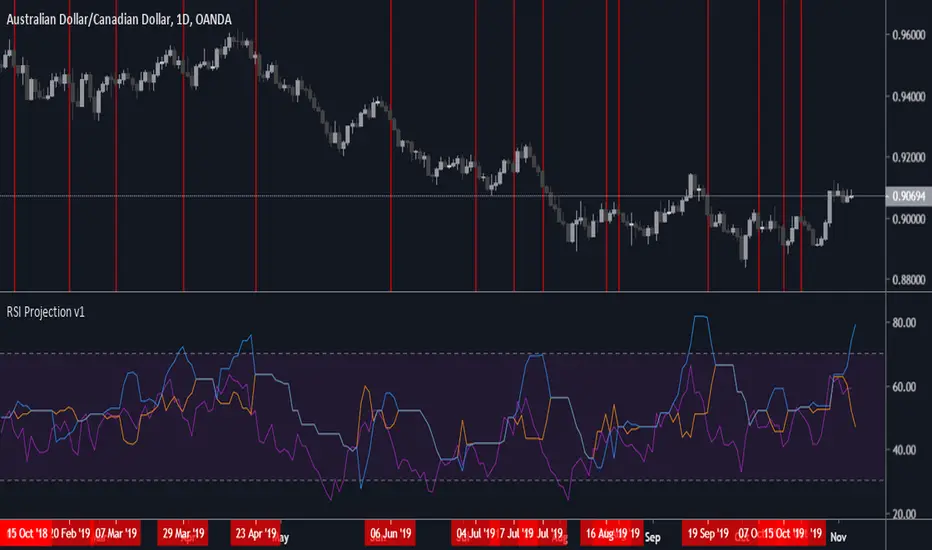
RSI Projection v1Application of concepts from Constance Brown "Technical Analysis for Trading Professionals", specifically: Chapter 7: Price Projections By Reverse Engineering Indicators , and Chapter 8: Price Objectives Derived From Positive and Negative Reversals In The RSI .
Specifically: I wanted to see if better Exit signals for the RSI could be generated from a basic application of some of the concepts in those chapters, and that is what I've found so far:
Exit when the RSI (purple) crosses below the orange line
Orange line is forecasted RSI for positive price reversals, blue line is forecasted RSI for negative price reversals
From what I can tell, this indicator does not work well during chop/consolidation and ranging periods, generating too many false signals without additional confluence from trending indicators and price analysis
This indicator should be considered highly experimental - do not use live trading without proper backtesting and parameter adjustment.
Tuning per asset and timeframe is required due to calculation type for highs/lows used for projection calculations
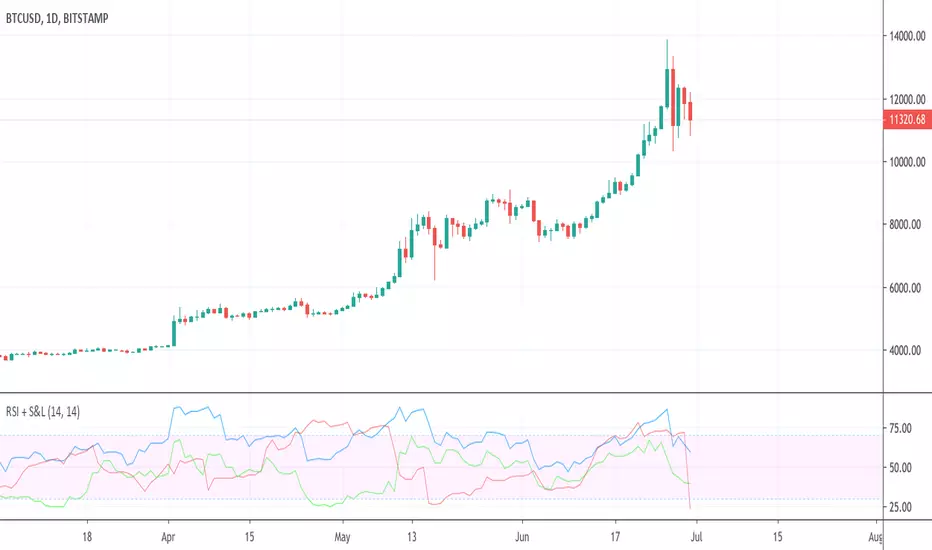
RSI + BTC Short & Long RSIsPlots the RSI for the current chart (same as the built-in RSI indicator) and adds the RSI values for the Shorts and Longs (S&L) from Bitmex. The main reason I've used the RSI value is to have it on the same scale as the price chart's RSI. The general trend of the S&L is preserved.
RSI + SMAx3Ceci est un script assez simple, un RSI comme celui qui est intégré mais avec la possibilité de tracer 3 droites de plus permettant ainsi de soulager certains chartiste qui pourrant régler la position de ces droites (horizontales) avec une parfaite précision.
S'ajoute à celà 3 moyennes mobiles arithmétique intégrées à l'indicateur RSI.
__________________________________________
This is a pretty simple script, with three lines to help relieve some chartists that make it possible to position these (horizontal) positions with perfect precision.
Add to this 3 arithmetic moving averages integrated in the RSI indicator.
__________________________________________
Este es un script bastante simple, un RSI como el que está integrado pero con la posibilidad de dibujar 3 líneas más, lo que permite liberar a algunos chartistas que pueden ajustar la posición de estas líneas (horizontal) con una precisión perfecta.
Agregue a esto 3 promedios móviles aritméticos integrados en el indicador RSI.
__________________________________________
Dies ist ein ziemlich einfaches Skript, ein RSI wie der, der integriert ist, aber mit der Möglichkeit, 3 weitere Linien zu zeichnen, wodurch einige Chartisten entlastet werden können, die die Position dieser Linien (horizontal) mit einer perfekten Genauigkeit einstellen können.
Hinzu kommen 3 in den RSI-Indikator integrierte arithmetische gleitende Durchschnitte.

RSI / Stoch / Stoch RSI (SRSI) Overlay [SigmaDraconis]One indicator combining RSI, Stochastic Oscillator and Stochastic RSI in one.
Credits for rwhiteside and his RSI / Stoch RSI Overlay indicator who served as inspiration to all three.
I believe this will be very useful to a lot of people.
If you like, use and i prove to be , you can contribute to my
TIP JAR :

RSI + Stoch/RSIThis is a combination of 2 of the most used indicators. RSI and stochastic/RSI
Ive coded them both to work together to save space on your chart and work as only ONE indicator.
I specifically only use the D line with my rsi , but you have the option to use the K and D line if you so choose.
RSI is good for momentum
Stochastic is good for short term momentum.
They work very well together and if you are a swing trader or scalper they can help immensely when looking for sniper entry areas after you've done you're initial pattern, level, fibonacci and wave analysis.
I like the way this works and have been using these two indicators for a while so I figured I would share.
Happy new year everyone, God bless!
RSI Stochastic Extreme Combo alertThis script will give you red or green columns as an indication for oversold/overbought based upon the rsi and stochastic both being at extreme levels (you set). The default oversold is at 35. If Stochastic and RSI fall below 35, you will get a green column (Both indicators at the extreme). Play with your levels to see how your stock reacts. RSI and Stochastic can both be changed along with each of the levels you would like the color change. I have set mine at RSI low: 37, RSI high: 63, Stoch low: 10, and Stoch high: 90. These levels have been working well for me on AAPL. Enjoy and don't forget to leave a comment if it helps your trading or you have other ideas about what is working for you.

TSM 1987 RSI + Supertrend + High Volume StrategyRSI + Supertrend + High Volume Strategy is a rule-based trading strategy designed to capture high-probability trend reversals and continuations using a combination of trend, momentum, and volume confirmation.
The strategy uses Supertrend to identify the primary market direction, RSI to confirm momentum strength, and High Volume to validate participation from strong market players. Trades are triggered only when all conditions align, helping to filter out low-quality signals.
Each BUY and SELL signal is plotted on the chart along with the exact trade date, and the script is fully compatible with TradingView’s Strategy Tester for backtesting performance across different markets and timeframes.
🔑 Core Logic
BUY
Supertrend turns bullish
RSI is above the defined trend level
Volume is significantly higher than average
SELL
Supertrend turns bearish
RSI is below the defined trend level
Volume confirms strong selling pressure
🎯 Best Use
Works well for intraday and swing trading
Suitable for stocks, indices, crypto, and forex
Designed for trend-following with confirmation
⚠️ Disclaimer
This strategy is for educational purposes only.
Always use proper risk management and stop-loss.
Past performance does not guarantee future results.

TSM RSI + Supertrend + High Volume Strategy (BACKTESTED) 1987RSI + Supertrend + High Volume Strategy is a rule-based trading strategy designed to capture high-probability trend reversals and continuations using a combination of trend, momentum, and volume confirmation.
The strategy uses Supertrend to identify the primary market direction, RSI to confirm momentum strength, and High Volume to validate participation from strong market players. Trades are triggered only when all conditions align, helping to filter out low-quality signals.
Each BUY and SELL signal is plotted on the chart along with the exact trade date, and the script is fully compatible with TradingView’s Strategy Tester for backtesting performance across different markets and timeframes.
Core Logic
BUY
Supertrend turns bullish
RSI is above the defined trend level
Volume is significantly higher than average
SELL
Supertrend turns bearish
RSI is below the defined trend level
Volume confirms strong selling pressure
🎯 Best Use
Works well for intraday and swing trading
Suitable for stocks, indices, crypto, and forex
Designed for trend-following with confirmation
⚠️ Disclaimer
This strategy is for educational purposes only.
Always use proper risk management and stop-loss.
Past performance does not guarantee future results.

RSI > 70 Buy / Exit on Cross Below 70This strategy buys when the RSI (Relative Strength Index) closes above 70, indicating strong market momentum. It closes the position as soon as the RSI crosses down and falls below 70, to secure profits before a possible reversal.
In summary:
Entry: RSI > 70
Exit: RSI crosses down below 70
It’s a momentum-based strategy that aims to take advantage of strong trends but exits as soon as the momentum weakens.

RSI (Custom Background) KDMThis code is a custom version of the RSI (Relative Strength Index) indicator.
Its main purpose is to compare recent price gains and losses to determine whether the market is in an overbought or oversold condition.
30–50 zone (purple tone): represents a weak or pullback area.
50–70 zone (green tone): represents a strengthening or dominant buying area.
Additionally, when the RSI line moves above 70, a green gradient background highlights the overbought region; when it moves below 30, a red gradient background emphasizes the oversold region.
Like the classic RSI, this version is a momentum indicator showing whether the price is losing or gaining strength.
The key difference is the colored background, which allows you to visually identify the RSI zones (e.g., 30–50 weak, 50–70 strong) much faster and more clearly.

RSI FlipIndicator Description: RSI Flip (30/70 Threshold)
This indicator uses a 7-period Relative Strength Index (RSI) to detect potential market reversals based on classic momentum thresholds:
- RSI < 30 → triggers a Long Deal Signal (1) indicating potential bullish reversal.
- RSI > 70 → triggers a Short Deal Signal (2) indicating potential bearish reversal.
🔧 Features:
- Backtest-compatible output: Hidden plots emit 1 for long and 2 for short, enabling seamless integration with strategy scripts.
- Bias tracking: Internal bias state updates on each trigger, allowing for modular lifecycle logic.
- Background tinting ready: The bias variable can be used to drive visual overlays or downstream automation.
🧩 Integration Notes:
- Designed for symbol-specific use — no external feeds or dependencies.
- Ideal for modular signal stacking, lifecycle-safe deal initiation, or audit-grade strategy mapping.
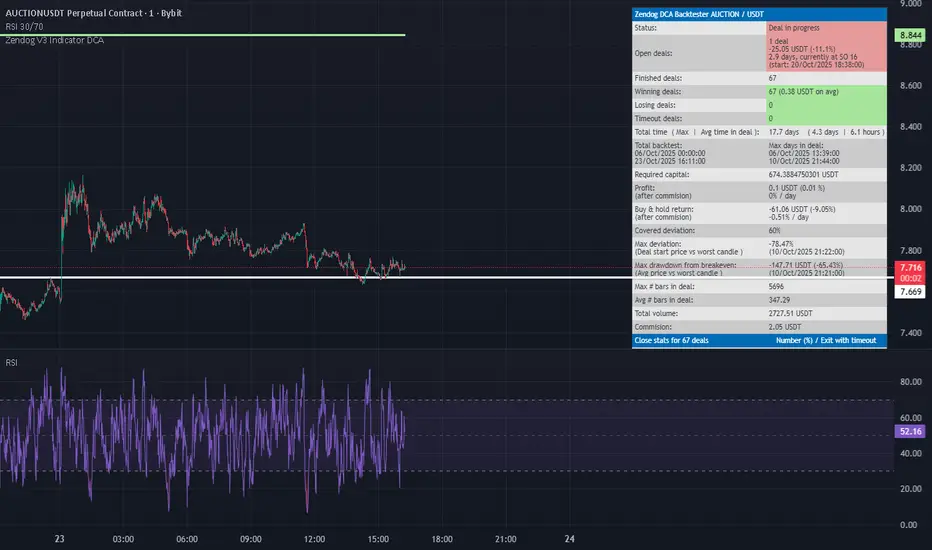
RSI DCA StrategyThis strategy combines RSI oversold signals with a Dollar-Cost Averaging (DCA) buying approach.
Trigger:
When the RSI (Relative Strength Index) crosses below 30, the strategy marks an oversold condition.
DCA Entry:
Once triggered, the strategy executes up to three consecutive daily entries (1 per day), splitting the predefined capital equally (configurable by user).
Position Management:
Take Profit at a configurable % above the average entry price.
Stop Loss at a configurable % below the average entry price.
Exit Conditions:
The strategy automatically exits either on reaching Take Profit or Stop Loss.
Visualization:
RSI plotted with oversold line (30).
Take Profit and Stop Loss lines displayed after entry.
Performance Reporting:
Includes an optional monthly performance table for evaluating results by month.
Note:
This strategy is for testing RSI-based mean reversion with staggered entries. It is not financial advice and should be optimized and validated for each market or timeframe before practical use.

RSI - (R.A Trader)Of course. Here is a descriptive text in English for the custom RSI indicator, written for the students of R.A. Trader.
The R.A. Trader Custom RSI Indicator
1. Overview
Welcome, students of R.A. Trader!
This is the official custom Relative Strength Index (RSI) indicator designed specifically to support the analytical methods taught by Rudá Alves. This tool replaces the standard RSI with a specialized configuration, providing a more nuanced view of market momentum that aligns directly with the R.A. Trader strategy.
Its purpose is to help you quickly and accurately identify key zones of strength, weakness, and potential market exhaustion.

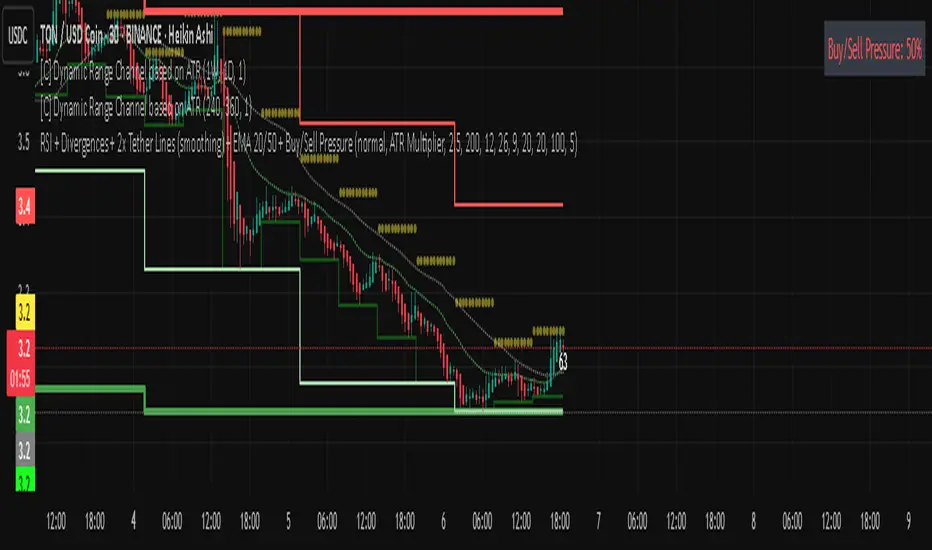
Rsi bar, divergences, tether line, ema 20,50 -Ema 20,50
-Tether Line dominance
-Buy/sell pressure
-Rsi last candle
-byu sell signal
-rsi divergence
-macd divergence
-Coloured candles 25,30 rsi and 70 rsi
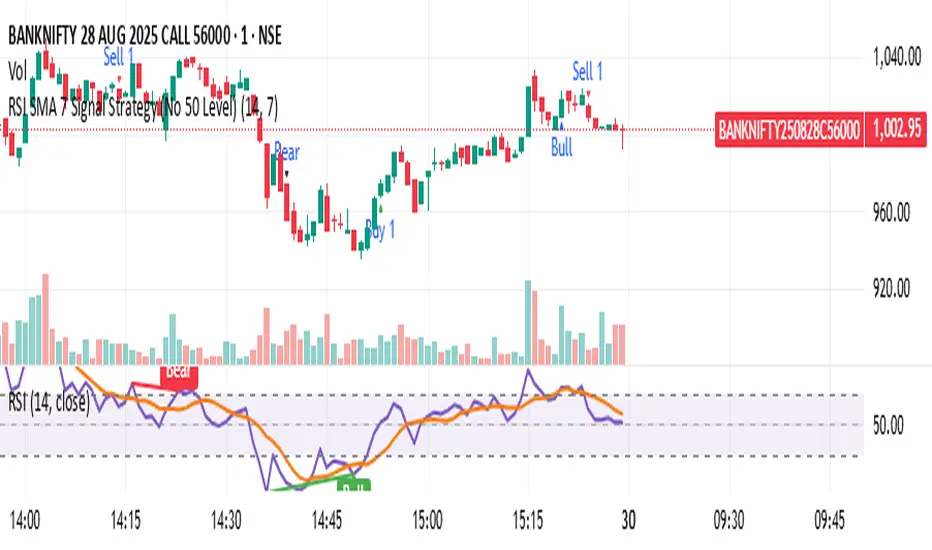
RSI SMA 7 Signal Strategy (No 50 Level)Script uses SMA 7 Perio and 14 Period RSI
If SMA crosses 40 RSI level from below consider it a buy zone or buy signal, if SMA crosses from below 60 RSI level, then super bullish, IF SMA crosses 60 RSI level from above its a profit taking time and Sell zone, if SMA crosses 40 level from above then super bearish sell signal.
RSI+BOLLINGER (LONG & SHORT)This indicator combines two of the most popular tools in technical analysis, the Relative Strength Index (RSI) and Bollinger Bands (BB), to generate both long (BUY) and short (SELL) trading signals.
Strategy:
Entries (Buy/Short): Entry signals are based on the RSI.
A BUY is suggested when the RSI crosses above an oversold level (default: 29), indicating a possible upward reversal.
A SHORT is suggested when the RSI crosses below an overbought level (default: 71), indicating a possible downward reversal.
Exits (Position Closure): Exit signals are based on Bollinger Bands.
A long position is closed when the price crosses below the upper Bollinger Band.
A short position is closed when the price crosses above the lower Bollinger Band.
Key Features:
Cascade Filter: Includes a smart filter that prevents opening new consecutive trades if the price hasn't moved significantly in favor of a new entry, optimizing signal quality.
Automation Alerts: Generates detailed alerts in JSON format for each event (buy, sell, close), designed for easy integration with trading bots and automated systems via webhooks.
Fully Configurable: All parameters of the RSI, Bollinger Bands, and strategy filters can be adjusted from the indicator’s settings menu.
