RSI and MACD Divergence IndicatorThe RSI and MACD Divergence Indicator is a custom Pine Script v6 indicator designed for TradingView that identifies and visualizes divergences between price movements and two technical indicators: the Relative Strength Index (RSI) and the Moving Average Convergence Divergence (MACD). Here's a brief explanation of its functionality:
Divergence Detection: The indicator detects both regular and hidden divergences for RSI, MACD (MACD Line), and Histogram. Regular bullish divergences occur when price makes a lower low but the indicator makes a higher low (suggesting a potential reversal upward), while regular bearish divergences occur when price makes a higher high but the indicator makes a lower high (suggesting a potential reversal downward). Hidden divergences indicate continuation patterns (e.g., higher low in price with a lower low in the indicator for bullish continuation).
Customizable Inputs:
Pivot Bars: Sets the number of bars used to confirm pivot highs and lows (default: 5).
RSI and MACD Parameters: Allows adjustment of RSI length (default: 14) and MACD settings (fast: 12, slow: 26, signal: 9).
Toggle Options: Enables/disables detection of regular and hidden divergences for RSI, MACD, and Histogram individually.
Confirmation: Option to wait for pivot confirmation (default: true), delaying divergence display until the pivot is fully formed.
Show Only Last Divergence: Toggles between showing only the most recent divergence (default: true) or all detected divergences (false), with previous lines and labels cleared when true.
Minimum Divergences: Sets the minimum number of divergence types required at a pivot to display (default: 1, max: 6).
Maximum Pivot Points: Limits the number of historical pivot points to check (default: 10).
Maximum Bars to Check: Restricts analysis to the last specified number of bars (default: 500).
Visualization:
Draws lines connecting the price pivot points where divergences are detected, with customizable colors, widths, and styles (solid, dashed, dotted) for RSI and MACD.
Displays a single label per pivot with vertically stacked text listing all detected divergence types (e.g., "RSI Bull Div\nMACD Bull Div"), using semi-transparent backgrounds (green for bullish, red for bearish) and white text.
Cerca negli script per "rsi"

RSI with Divergences and Trendlines by zenDisplays the standard Relative Strength Index (RSI). The RSI period, line color, and thickness are customizable by the user (defaulting to a 14-period, thin black line).
Includes traditional horizontal lines at the 70 (overbought) and 30 (oversold) levels. The background area between these levels is filled with a customizable color (defaulting to a transparent black).
The indicator intelligently analyzes the RSI's own movements to identify significant recent turning points (peaks and troughs).
It then automatically draws short trendline segments directly on the RSI chart. These lines connect recent, consecutive RSI turning points, dynamically highlighting the indicator's internal structure and immediate directional momentum.
Users can configure the sensitivity used to detect these RSI turning points via 'Pivot Lookback' settings. You can also customize the maximum number of recent trendlines displayed for upward and downward RSI movements (default is 5 each), as well as their colors and width.
These on-RSI trendlines do not extend into the future.

RSI & DPO support/resistanceThis indicator combines the Relative Strength Index (RSI) to identify overbought and oversold conditions with the Detrended Price Oscillator (DPO) to highlight support and resistance levels.
Unlike traditional indicators that display these metrics in a separate window, this tool integrates them directly onto the main price chart.
This allows for a more cohesive analysis, enabling traders to easily visualize the relationship between price movements and momentum indicators in one unified view.
How to Use It:
Identify Overbought and Oversold Conditions:
Look for RSI values above 70 to identify overbought conditions, suggesting a potential price reversal or pullback. Conversely, RSI values below 30 indicate oversold conditions, which may signal a potential price bounce or upward movement.
Analyze Support and Resistance Levels:
Observe the DPO lines on the main chart to identify key support and resistance levels. When the price approaches these levels, it can provide insights into potential price reversals or breakouts.
Combine Signals for Trading Decisions:
Use the RSI and DPO signals together to make informed trading decisions. For example, if the RSI indicates an overbought condition while the price is near a resistance level identified by the DPO, it may be a good opportunity to consider selling or taking profits.
Monitor Divergences:
Watch for divergences between the RSI and price movements. If the price is making new highs while the RSI is not, it could indicate weakening momentum and a potential reversal.
Set Alerts:
Consider setting alerts for when the RSI crosses above or below the overbought or oversold thresholds, or when the price approaches significant support or resistance levels indicated by the DPO.
Practice Risk Management:
Always use proper risk management techniques, such as setting stop-loss orders and position sizing, to protect your capital while trading based on these indicators.
By following these steps, traders can effectively utilize this indicator to enhance their market analysis and improve their trading strategies.

RSI Buy-Sell Indicator - MissouriTimThe RSI Buy-Sell Indicator by MissouriTim, is an advanced trading tool designed to elevate your trading strategy. This indicator leverages the power of the Relative Strength Index (RSI) to provide clear and actionable buy and sell signals, ensuring you make informed trading decisions with confidence.
Key Features:
Customizable RSI Settings: Tailor the RSI source, length, and thresholds for overbought and oversold conditions to fit your trading style.
Real-Time Alerts: Enable BUY and SELL alerts to receive instant notifications when market conditions meet your criteria.
Visual Clarity: Easily distinguish between buy and sell signals with customizable line colors, ensuring you never miss a trading opportunity.
Intelligent Labeling: Buy and Sell labels dynamically update to reflect overbought and oversold current market conditions, providing you with clear entry and exit points.
Swing Lines: Visualize price movements with intuitive swing lines that connect recent highs and lows, helping you spot trends and reversals.
How It Works:
The RSI Buy-Sell Indicator utilizes the RSI and a specially designed algorithm to determine when an asset is overbought or oversold. When the RSI value crosses the specified overbought or oversold thresholds, the indicator generates a signal, displayed as a label on the chart. Additionally, swing lines are drawn to connect recent highs and lows, offering a visual representation of market trends.
This tool is perfect for traders who want to enhance their technical analysis and make more informed decisions. With its customizable settings and real-time alerts, the RSI Buy-Sell Indicator by MissouriTim is a must-have for any serious trader.
RSI Screener / Heatmap - By LeviathanThis script allows you to quickly scan the market by displaying the RSI values of up to 280 tickers at once and visualizing them in an easy-to-understand format using labels with heatmap coloring.
📊 Source
The script can display the RSI from a custom timeframe (MTF) and custom length for the following data:
- Price
- OBV (On Balance Volume)
- Open Interest (for crypto tickers)
📋 Ticker Selection
This script uses a different approach for selecting tickers. Instead of inputting them one by one via input.symbol(), you can now copy-paste or edit a list of tickers in the text area window. This approach allows users to easily exchange ticker lists between each other and, for example, create multiple lists of tickers by sector, market cap, etc., and easily input them into the script. Full credit to @allanster for his functions for extracting tickers from the text. Users can switch between 7 groups of 40 tickers each, totaling 280 tickers.
🖥️ Display Types
- Screener with Labels: Each ticker has its own color-coded label located at its RSI value.
- Group Average RSI: A standard RSI plot that displays the average RSI of all tickers in the group.
- RSI Heatmap (coming soon): Color-coded rows displaying current and historical values of tickers.
- RSI Divergence Heatmap (coming soon): Color-coded rows displaying current and historical regular/hidden bullish/bearish divergences for tickers.
🎨 Appearance
Appearance is fully customizable via user inputs, allowing you to change heatmap/gradient colors, zone coloring, and more.

RSI Momentum Waves [Quantigenics]RSI Momentum Waves Indicator
The RSI Momentum Waves Indicator is your intuitive tool for visualizing market strength and trend persistence. It refines the classic RSI by smoothing the data with Exponential Moving Averages (EMAs), which help clear out the noise to give you a more accurate picture of where the market’s heading. The parameters - RSI Period, Smoothing Period, Overbought, Oversold, Upper Neutral Zone, and Lower Neutral Zone - are all adjustable, so you can tailor the indicator to different market conditions or your trading style.
How It Works:
RSI Period (RsiPer): Adjusts how far back the RSI looks to calculate its value, affecting its sensitivity.
Smoothing Period (SmoothPer): Dictates how smooth the EMA lines are, balancing between sensitivity and noise reduction.
Overbought (OBLevel) / Oversold (OSLevel) Levels: Set the thresholds where the market might be too stretched in either direction and due for a reversal.
Neutral Zones (UpperNZ / LowerNZ): Define the areas where the market is considered neutral, and trend strength is less clear.
Trading Instructions:
Use the RSI Momentum Waves to gain insights into the market’s momentum and make informed decisions:
For Trend Identification: If the waves are consistently above the 50 line and climbing, the market may be bullish; if below and declining, bearish signals are suggested.
Overbought and Oversold Regions: Entering these areas might indicate a potential reversal. A peak and downturn in the overbought region can signal a sell, while a trough and upturn in the oversold region can indicate a buy.
Neutral Zone Caution: In the neutral zones, exercise caution and wait for a breakout in either direction for stronger signals.
Confirm with Other Analysis: Never rely solely on one indicator. Confirm the RSI Momentum Waves signals with other technical indicators or fundamental analysis for best practices.
Remember, the goal is to detect the rhythm of the market’s momentum and act accordingly. Happy trading!

RSI in Candlestick MODEDescription:
The "RSI Bar" indicator is a versatile tool designed to enhance your technical analysis on trading charts. This Pine Script™ code calculates the Relative Strength Index (RSI) for open, close, high, and low prices, and represents the results as bars on the chart. The bars are color-coded based on whether the closing RSI is higher or lower than the opening RSI.
Additionally, the indicator incorporates advanced features such as Pareto analysis and Gaussian smoothing. The Pareto analysis helps identify significant lows and highs in the RSI, providing insights into potential trend reversals. The Gaussian smoothing further refines the analysis, contributing to a more accurate representation of the average RSI trend.
Key Features:
RSI calculation for open, close, high, and low prices.
Color-coded bars for easy visualization of RSI trends.
Pareto analysis to highlight key RSI levels indicating potential reversals.
Gaussian smoothing for improved trend analysis and visualization.
Heiken-Ashi

RSI/MFI Selling Sentiment IndexPsychological Sales Index (Psychological Sales Index)
Fundamental Indicators of Market Sentiment: The Importance of MFI and RSI
The two fundamental indicators that best reflect market sentiment are Money Flow Index (MFI) and Relative Strength Index (RSI). MFI is an indicator of the flow of funds in a market by combining price and volume, which is used to determine whether a stock is over-bought or over-selling. RSI is an indicator of the overheating of the market by measuring the rise and fall of prices, which is applied to the analysis of the relative strength of stock prices. These two indicators allow a quantitative assessment of the market's buying and selling pressure, which provides important information to understand the psychological state of market participants.
Using timing and fundamental metrics
In order to grasp the effective timing of the sale, in-depth consideration was needed on how to use basic indicators. MFI and RSI represent the buying and selling pressures of the market, respectively, but there is a limit to reflecting the overall trend of the market alone. As a result, a study on how to capture more accurate selling points was conducted by comprehensively considering technical analysis along with psychological factors of the market.
The importance of ADX integration and weighting
The "Average Regional Index (ADX)" was missing in the early version. ADX is an indicator of the strength of a trend, and has experienced a problem of less accuracy in selling sentiment indicators, especially in the upward trend. To address this, we incorporated ADX and adopted a method of adjusting the weights of MFI and RSI according to the values of ADX. A high ADX value implies the existence of a strong trend, in which case it is appropriate to reduce the influence of MFI and RSI to give more importance to the strength of the trend. Conversely, a low ADX value increases the influence of MFI and RSI, putting more weight on the psychological elements of the market.
How to use and interpret
The user can adjust several parameters. Key inputs include 'Length', 'Overbought Threshold', 'DI Length', and 'ADX Smoothing'. These parameters are used to set the calculation period, overselling threshold, DI length, and ADX smoothing period of the indicator, respectively. The script calculates the psychological selling index based on MFI, RSI, and ADX. The calculated index is normalized to values between 0 and 100 and is displayed in the graph. Values above 'Overbought Threshold' indicate an overselling state, which can be interpreted as a potential selling signal. This index allows investors to comprehensively evaluate the psychological state of the market and the strength of trends, which can be used to make more accurate selling decisions.

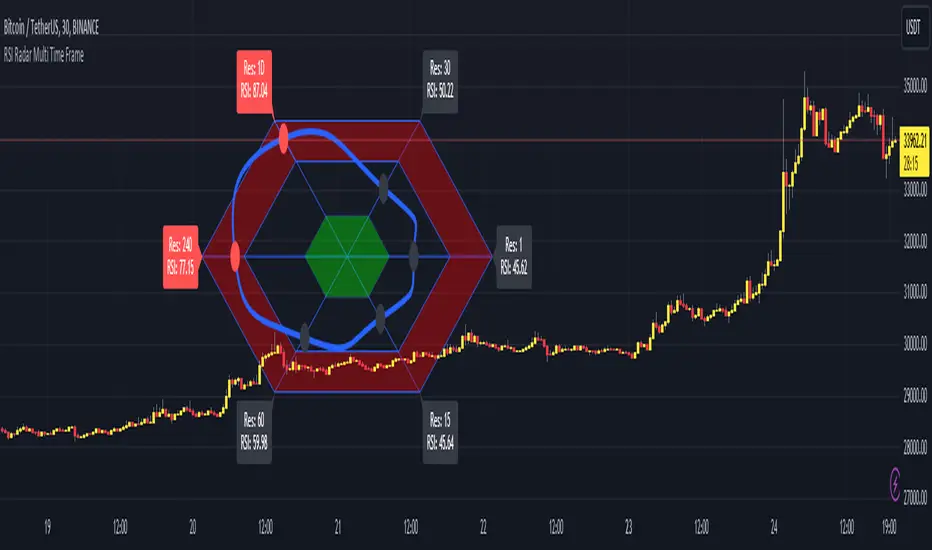
RSI Radar Multi Time FrameHello All!
First of all many Thanks to Tradingview and Pine Team for developing Pine Language all the time! Now we have a new feature and it's called Polylines and I developed RSI Radar Multi Time Frame . This script is an example and experimental work, you can use it as you wish.
The scripts gets RSI values from 6 different time frames, it doesn't matter the time frame you choose is higher/lower or chart time frame. it means that the script can get RSI values from higher or lower time frames than chart time frame.
It's designed to show RSI Radar all the time on the chart even if you zoom in/out or scroll left/right.
You can set OB/OS or RSI line colors. Also RSI polyline is shown as Curved/Hexagon optionally.
Some screenshots here:
Doesn't matter if you zoom out, it can show RSI radar in the visible area:
Another example:
You can change the colors, or see the RSI as Hexagon:
Time frames from seconds to 1Day in this example while chart time frame is any ( 30mins here )
Enjoy!
RSI Bitmap
Function (English):
1. It displays 40 items’(tokens,stocks, futures etc.) RSI oversold and overbought data in the form of bitmap/dots on the chart.
2. The specifi item will be clear after placing mouse on the small dots.
3. The bitmap will show red when the RSI overbought, show green when the RSI oversold, and will show black when the RSI in the middle of the value.
RSI点阵图功能(中文):
功能:
1、在图表上以点阵形式、直观的显示40支商品的RSI超卖超买数据
2、如果需要查看具体是什么商品,直接把鼠标放置在小点上就行
3、当RSI超买时点阵显示红色、当RSI超卖时点阵电视绿色、处于中间则显示黑色
RSI MACDDifferent Perspective : By using the RSI as the source for MACD calculation, you are incorporating the RSI's characteristics into the MACD indicator. The RSI measures the speed and change of price movements, while the MACD focuses on the convergence and divergence of moving averages. Combining these two indicators may provide a different perspective on market conditions.
Smoothed MACD : Since the RSI is being used as the source for the MACD calculation, the resulting MACD line (macd1 in the code) may exhibit smoother movements compared to a traditional MACD calculated directly from price data. This smoothing effect could potentially help filter out noise and provide a clearer representation of trend changes.
RSI Confirmation : The RSI is often used to identify overbought and oversold conditions. By incorporating the RSI into the MACD calculation, you can potentially gain additional confirmation when the MACD line crosses above or below zero. For example, if the MACD line crosses above zero and the RSI is in an oversold region, it could provide stronger confirmation for a bullish signal.
Example:

RSI-MFI Machine Learning [ Manhattan distance ]The RSI-MFI Machine Learning Indicator is a technical analysis tool that combines the Relative Strength Index (RSI) and Money Flow Index (MFI) indicators with the Manhattan distance metric.
It aims to provide insights into potential trade setups by leveraging machine learning principles and calculating distances between current and historical data points.
The indicator starts by calculating the RSI and MFI values based on the specified periods for each indicator.
The RSI measures the strength and speed of price movements, while the MFI evaluates the inflow and outflow of money in the market.
By combining these two indicators, the indicator captures both price momentum and money flow dynamics.
To apply machine learning principles , the indicator utilizes the Manhattan distance metric to quantify the similarity or dissimilarity between different data points.
The Manhattan distance is calculated by taking the absolute differences between corresponding RSI and MFI values of the current point and historical points.
Next, the indicator determines the nearest neighbors based on the calculated Manhattan distances.
The number of nearest neighbors is determined by the square root of the specified count of neighbors.
By identifying similar patterns and behaviors in the historical data, the indicator aims to uncover potential trade opportunities.
Trade signals are generated based on the calculated distances. The indicator compares each distance with the maximum distance encountered so far.
If a new maximum distance is found, it updates the value and considers the corresponding direction as a potential trade signal. The trade signals are stored in an array for further analysis.
Furthermore, the indicator considers the price action and a calculated regression line to differentiate between long and short trade signals.
Long trade signals are identified when the closing price is above the regression line, indicating a potentially bullish setup.
Short trade signals are identified when the closing price is below the regression line, indicating a potentially bearish setup.
The RSI-MFI Machine Learning Indicator visualizes the regression line on the price chart and labels the bars accordingly. It highlights the regression line with different colors based on the trade signals, making it easier for traders to identify potential entry or exit points.
Traders can use the RSI-MFI Machine Learning Indicator as a tool to analyze price movements, evaluate market conditions based on RSI and MFI, leverage machine learning concepts to find similar patterns, and make informed trading decisions.
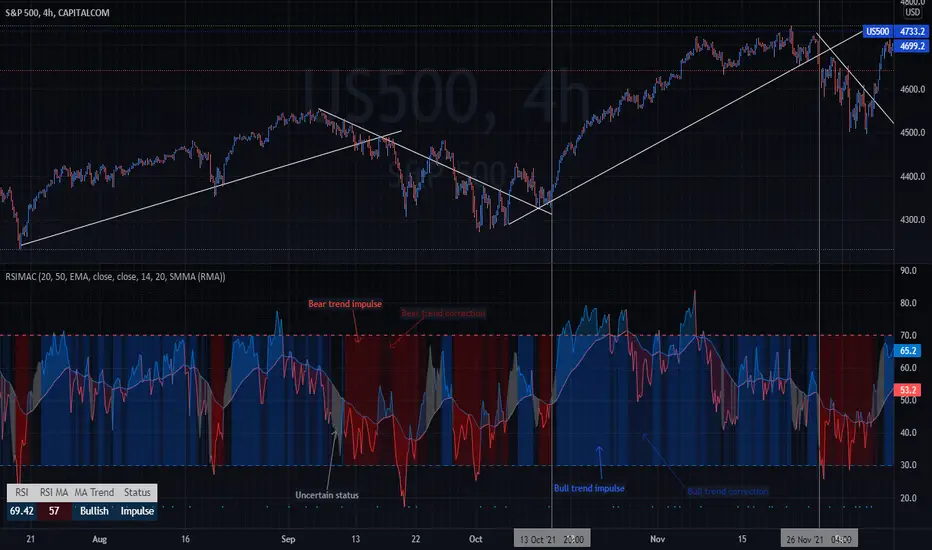
RSI Moving Average CrossoversThis script is an improved version of the RSI indicator, using a moving average on the RSI itself, as well as two other moving averages used to determine the current trend.
A small screener indicating the current movement is displayed in the bottom-left zone of the chart: trend (Bullish/Bearish/Uncertain) and status (Impulse or Correction)
Trends are simply based on moving averages crossovers, coupled to the fact that the current candle closes above the fast MA in a bull trend, and under the fast MA in a bear trend. In other cases, the trend and the movement are considered as "Uncertain" by the indicator.
Options
Various types of moving averages for the RSI and trend MA
Show/Hide crossovers between the RSI and its MA
Color the RSI normal zone with the current trend/movement colors
Show/Hide the screener indicating the current movement
Defaults Parameters
Fast MA 20
Slow MA 50
MA source: Close
RSI Length 14
RSI MA: SMMA (RMA)
RSI MA Length: 20
Don't hesitate to suggest any idea which could improve this indicator.
RSI MACD Same RatioこのインジケータはRSIとMACDを同比率で表示するものです。
なぜ同比率で表示するのでしょうか。
同比率で表示することでRSIとMACDのダイバージェンスを同時に確認することができます。
私には思いつきませんが、他にも使い道はあるかもしれません。
必要と感じた場合はぜひ使ってみてください。
※同比率で表示するためにRSIとMACDの値を変更しています。
そのため、値はあくまで参考程度にご覧ください。
注目すべきはラインのみです。
使う場合は「adjustment ratio」に適当な値を入れて、RSIの比率とMACDの比率を合わせてください。
それでは良いトレードライフを。
-----
This indicator shows RSI and MACD in equal proportions.
Why are they displayed at the same ratio?
By displaying at the same ratio, you can check the divergence of RSI and MACD at the same time.
I can't think of it, but there may be other uses.
If you feel it is necessary, please use it.
caution!
The RSI and MACD values are changed to display the same ratio.
Therefore, please see the values for reference only.
Only the line should be noted.
When using it, enter an appropriate value in "adjustment ratio" and match the RSI ratio with the MACD ratio.
Let's have a good trade life.

RSI/Momentum derivativesthis indicator plots the derivatives of the RSI to get more leading sense of direction of the price
we know that the rsi shows us the momentum of the price, so the easiest/logical way to interpret this indicator and benefit from it is as follows:
- see the price as 'distance'
- see the rsi as 'speed'
- see the rsi/momentum of the above/'speed' as 'velocity'
- see the rsi/momentum of the above/'velocity' as 'acceleration'
once you understand this you can analyse and interpret this indicator to give you a more leading analysis and more accurate entry and exit points.
- also includes the RMA for each RSI derivative which can help for identifying breakouts, direction of price, pivot points and more.
in the above chart
- black is the standard rsi/speed
- orange is the momentum of the rsi/velocity
- green is the momentum of the velocity

RSI Trend Indicator [paRSI]The Relative Strength Index ( RSI ) is a measurement used by traders to assess the price momentum. It is scaled from 0 to 100. when RSI reads below 30, it is usually interpreted as oversold and when RSI is above 70 it is usually interpreted as overbought. However, it is usually not profitable to trade based on overbought and oversold signal.
RSI Trend Indicator or as I like to call it "paRSI" ("Parsa (my name) + RSI") shows that when RSI is above a specific number (default value = 60) it indicates bullish trend and when RSI is below a specific number (default value = 40 ) it indicates bearish trend. Lastly when RSI is below the 2 specified numbers it indicates a neutral trend.
I don't recommend trading based on this single indicator. If you're a trend trader this might be useful tool in addition to your own strategy
Usage:
If the created pattern has worked previously on the chart, you could enter on the first stages of the green or red section (depending on the market's trend).
It is not recommended to trade in any direction when there is no color
*THIS IS A TREND FOLLOWING STRATEGY AND DOES NOT WORK ON ALL MARKETS*

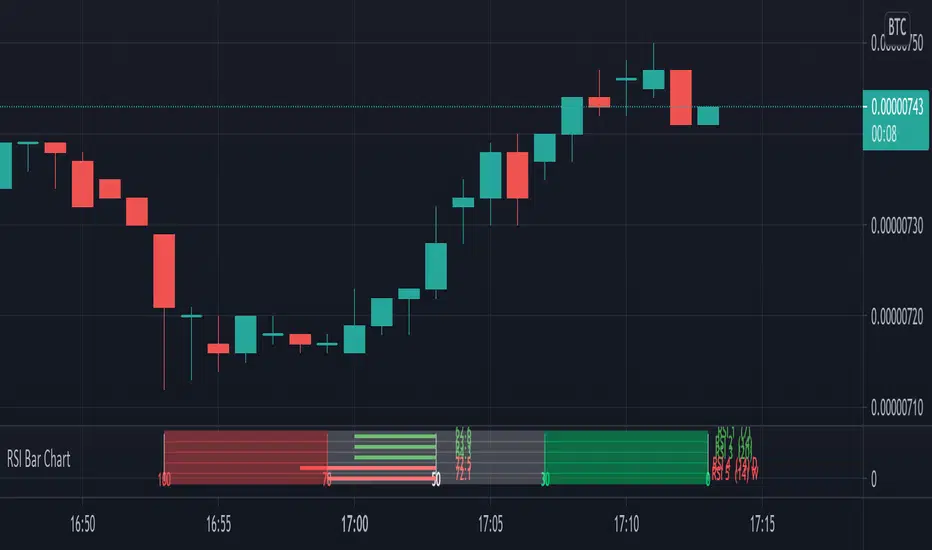
RSI Bar ChartA different way to plot several RSI at once,
5 RSI with different options:
- source, length, timeframe
- size of indicator (width)
- color change
- limit change (30, 70), labels will be changed accordingly
- type of RSI line (line, arrow), linewidth
- offset label (at the right)
There are 4 colors (RSI line)
- when RSI > sell limit
- when RSI > 50 but below sell limit
- when RSI < 50 but above buy limit
- when RSI < buy limit
Arrows:
Different size:
Cheers!
RSI Support & Resistance by DGTRSI Sᴜᴘᴘᴏʀᴛ & Rᴇꜱɪꜱᴛᴀɴᴄᴇ ʙʏ DGT
This experimental study attempts to translate Relative Strength Index (RSI) threshold levels of oversold/overbought and bull/bear zones as probable Price Support and Resistance levels
█ OPTIONS
Support & Resistance Levels , the main aim of the study. Level calculations are based on Relative Strength Index (RSI) threshold levels of oversold/overbought and bull/bear zones, where all threshold values are customizable through the user dialog box. Background of the levels can be colored optionally
RSI Weighted Colored Bars and/or Mark Overbought/Oversold Bars , Bar colors can be painted to better emphasis RSI values. Darker colors when the oscillator is in oversold/overbought zones, light colors when oscillator readings are below/above the bull/bear zone respectively, and remain unchanged otherwise. Besides the colors, with “Display RSI Overbought/Oversold Price Bars” option little triangle shapes can be plotted on top or bottom of the bars when RSI is in oversold/overbought zones
Example usage of the study with explanations
█ OTHERS
More regarding Support & Resistance concept (definition, identifying levels, trading S&R, etc) you are kindly invited to check my previous publication
Price Action - Support & Resistance by DGT
More regarding Relative Strength Index (RSI) and Relative Strength of Volume Indicators , please check Relative Strength of Volume Indicators by DGT
Disclaimer:
Trading success is all about following your trading strategy and the indicators should fit within your trading strategy, and not to be traded upon solely
The script is for informational and educational purposes only. Use of the script does not constitute professional and/or financial advice. You alone have the sole responsibility of evaluating the script output and risks associated with the use of the script. In exchange for using the script, you agree not to hold dgtrd TradingView user liable for any possible claim for damages arising from any decision you make based on use of the script

RSI Multi Time FrameHello Traders,
Recently we got new features in Pine such Arrays of Lines, Labels and Strings. Thanks to the Pine Team! ( here )
So I decided to make new style of Multi Time Frame indicator and I used Array of Lines in this script. here it is, RSI Multi Time Frame script. it shows RSI for current time frame as it is and also it gets RSI for the Higher Time Frame and converts it and shows it as in time frame. as you can see, RSI for HTF moves to the right on each candle until higher time frame was completed.
You have color and line width options for both RSI, also if you want you can limit the number of bars to show higher time frame RSI by the option " Number of Bars for RSI HTF ", following example show RSI HTF for 100 bars.
Most of you know that old style Multi Time Frames indicators was like:
Hope you like this new Multi time frame style ;)
Enjoy!

RSI Step Oscillator [racer8]Purpose of RSO is to identify when RSI has reached key levels. These levels are 80, 70, 60, 40, 30, and 20.
When indicator displays a bar with color...
Purple : RSI > 80
Blue : RSI > 70
Green : RSI > 60
Gray : RSI is inbetween 40 and 60.
Yellow : RSI < 40
Orange : RSI < 30
Red : RSI < 20
Hit the like button and enjoy 😁

RSI Currency Strength Correlation by LukasHello guys.
This is RSI Currency Strength with less noise, combine with my Price CSI to get the best result.
How it works :
This Indicator (on bottom) will tell you RSI information, and my other indicator I mentioned above (on the middle) will tell you price movement.
Sometimes when RSI up doesn't mean Price will go up, that's why divergence happen.
So trading only with RSI will trigger many false signal. Combine both of indicator will help you make better decision.
Buy :
- RSI rising up and price rising up
- If price already strong, wait for the RSI on strong currency pullback and rebound.
Sell :
- RSI going down and price going down
- don't sell when RSI going down but the price is not going down
I use one hour chart, usually can get 3-5 hours trade
Setting :
- Timeframe : you can play around with, your timeframe x 2
- MA length : I use 21,5,8

RSI BammThe standard RSI only has the definition of upper band and lower band, which means overbought and oversold respectively.
But sometimes, we need the middle band to help complete some analysis, such as RSI BAMM (bat action magnet move).
This indicator adds the definition of the mid-track to the standard RSI and automatically identifies the RSI BAMM. Hope it is useful to you.
标准RSI只有上轨和下轨的定义,分别表示超买和超卖。但有时候,我们需要中轨来辅助完成一些分析,比如RSI BAMM (蝙蝠吸磁运动)
此指标在标准RSI的基础上,加入中轨的定义,并自动识别RSI BAMM。 希望对你有用。

Ultimate RSIRSI w/BBands and 12 period moving average.
BBands show the standard deviation of the RSI, and can therefore suggest if a trend is oversold or overbought in conjunction with the 30 and 70 RSI values. A tightening of the BBands also suggests a major move/trend change is immanent.
The RSI moving average can suggest if the RSI is in a bullish or bearish trend . So if RSI>RSIMA then bullish trend , and if RSI
