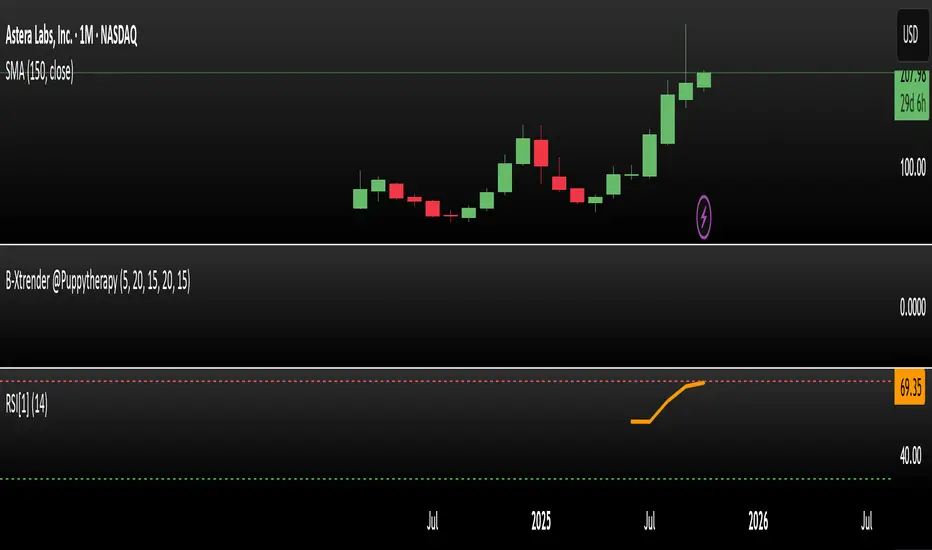
RSI Based Automatic Supply and DemandA script that draws supply and demand zones based on the RSI indicator. For example if RSI is under 30 a supply zone is drawn on the chart and extended for as long as there isn't a new crossunder 30. Same goes for above 70. The threshold which by default is set to 30, which means 30 is added to 0 and subtracted from 100 to give us the classic 30/70 threshold on RSI, can be set in the indicator settings.
By only plotting the Demand Below Supply Above indicator you get automatic SD level that is updated every time RSI reaches either 30 or 70. If you plot the Resistance Zone / Support Zone you get an indicator that extends the zone instead of overwrite the earlier zone. Due to the zone being extended the chart can get a bit messy if there isn't a clear range going on.
There is also a "confirmation bars" setting where you can tell the script how many bars under over 30 / 70 you want before a zone is drawn.
Here is an image of only using the "Demand Below / Supply Above" plot.
As you can see, this could be useful "Price Flow" indicator, where we would only short if a zone appears below another zone, or long if two zones in a row are going up, like stairs.
Cerca negli script per "rsi"

RSI Swing Signal - ChartThis indicator is the chart version intended to accompany my custom RSI oscillator:
CLICK HERE TO SEE BASE INDICATOR
CLICK HERE TO SEE BASE INDICATOR

RSI AND SMOOTHED STOCH RSI TOGETHERi dont know pine script but here i used some free ones and merged them and modified some
especially smoothed stoch rsi is Good to decide when buy coz i modified it and when fast K value is over D value it changes color
visually better this way
also rsi is shown as area o histogram but if u dont like u can change to line
for stoch rsi i unclick xtrigger (d value) for better appearance

Rsi/Cci Overbought Oversold CandlesThis indicator will allow you to see overbought and oversold areas of the rsi or the cci, you must set yourself the upper and lower band of the rsi (70-30) or cci (100, -100). By default, it's Rsi
I have already posted the same indicator but only with the Rsi, I wanted to posted a more complete that offers the 2.
On the chart, it is the overbought / oversold area of the Cci that is displayed

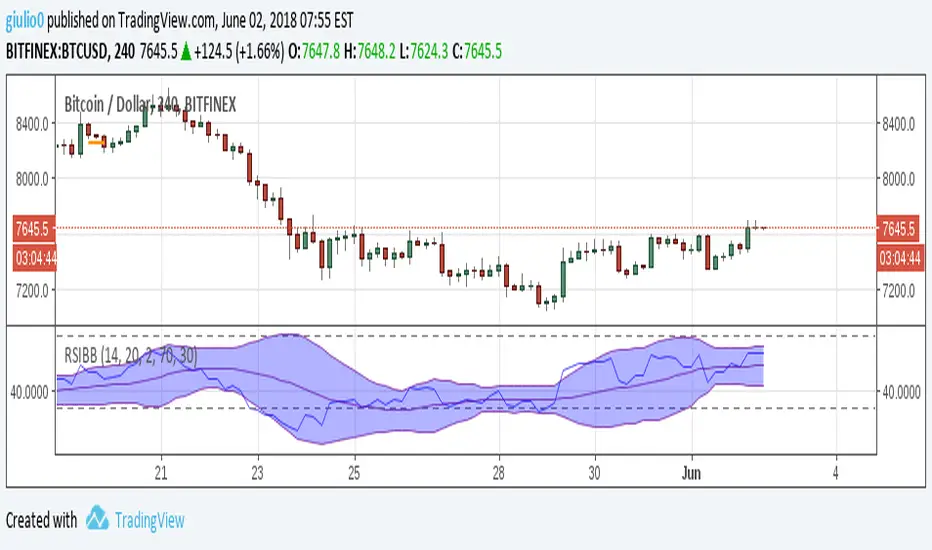
RSI+Bollinger BandsThis is a simple RSI with applied Bollinger Bands. The BB may help spotting "hidden" divergences or "fake" divergences. For instance: in an uptrend we have a high followed by a higher high, the plain RSI shows a divergence, adding BB we see that the first (higher) RSI high is inside the BB, while the second (lower) RSI high is outside the bands, this would be a fake divergence.
The use of the indicator should be straightforward, for any questions feel free to write me a message
RSI-Histo-Entry_JDThis indicator shows a histogram of the RSI in relation to an ema of the RSI.
The histogram is then smoothed to give early reversal/entry signals.
The actual RSI line with oversold/overbought indication can be displayed or omitted, as preferred.
In addiction to the RSI line or as an alternative to it, the background colour can be set to change folowing the RSI signals.
JD.

RSI normalized by Bollinger BandsEnglish.
RSI indicator with Bollinger Bands in one. Forgot oversold and overbought!
With BB and RSI you can dinamically saw when RSI is in critical values. And when you can see figure 'M' or 'W' in oscillator it means that current movement of impulse is down.
Русский.
RSI и Ленты Боллинджера в одном. Забудьте о тупых линиях перекупленности и перепроданности!
При работе в связке вы можете определять эти зоны динамически. И при формировании фигуры 'M' или 'W' на осцилляторе будет четко показано, что текущий импульс умер, надо выходить из сделки.
Example of usage (exit points) / Пример использования (точки выхода)

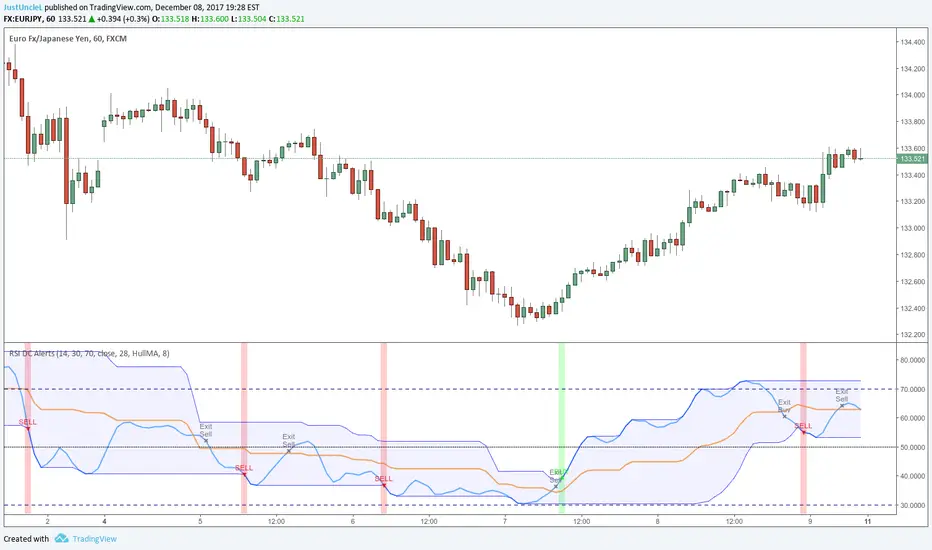
RSI Donchian R1 Alerts by JustUncleLThis study is based on an idea by presented by RicardoSantos and JayRogers of using Donchian Channel (DC) on the RSI curve. The idea being that when RSI passes through the DC centre and touches the Highest/Lowest DC then price action tends to follow in the same direction and stay there until the RSI crosses DC centre line again.
This script expands on the original idea by including alert and exit signals based on the above rules. These alerts are also filtered by the rule: they must be within the Oversold and Overbought boundaries of the RSI.
There is also the option of applying MA smoothing to the RSI curve, the HullMA (8) is recommended (default).
Each Entry and Exit signal creates an Alertcondition that can be picked up by the TradingView Alarm system.
TIP: Remember this type of Trading technique only works well in a trending market. Do not try to trade this technique in a ranging/flat market.
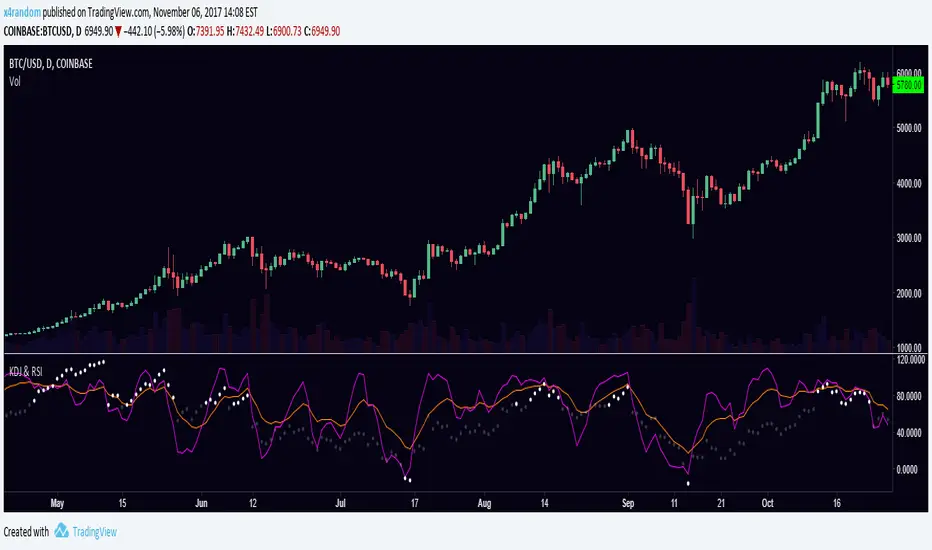
KDJ & RSIRSI and KDJ indicator combined.
KDJ: Buy when J (purple) is going up and and crossing KD (orange) from below. Sell vise versa.
RSI: Overbought when RSI is over 70, oversold when RSI is under -10.
RSI comboTraditional RSI plus the adx and moment of rsi to show when rsi is exhausted (thick green and red line). Red and green circle indicate the swing (350 swing indicator) and the top and botton colored bars come from RSS (relative spread strength). When rsi is red or green and circles show up is a good signal. Do the last check at the bar color, better if wait until become silver

RSI Dav1zoNThe RSI Grid is a multi-timeframe momentum dashboard designed to give a quick, structured view of market bias across several timeframes at once.
Instead of checking RSI on each timeframe manually, the grid shows direction, RSI value, and projected price levels in one place.

RSI MTF Table (Threshold Colors + Direction Arrows) [v6]Sometimes I want to know what other timeframes are indicating for the RSI so I borrowed from another indicator and created this script. Since I swing trade, I have the timeframes set higher, but you can adjust them to your needs in the settings.
Each pane is color coded light green below 50, and pink above 50. Then you can define your own thresholds but the defaults are Red above 70, and Dark Green below 30. The colors can be adjusted to your needs.
The top of each pane is its timeframe, then the RSI value for that timeframe. Then I check the current bar against the prior bar to see if the current value is higher (Up Arrow) or lower (Down Arrow) so that you know which way the RSI is moving. The position on your chart can be changed to your needs.
This keeps the momentum in perspective for me. I hope it helps you. Good luck in your trading.

RSI Trendline Breakout BB Exit -by RiazMalikUse this strategy based on RSI and bolinger bands
When RSI trend line breaks take position when RSI touches bolinger bands exit

RSI Divergence + RSI Indicator MegartCombined RSI Divergence Indicator and RSI.
Highlights important RSI levels 70–80–90 and 30–20–10.
All calculations are always based on standard Japanese candlesticks, even when used on other chart types.

RSI Ladder TP Strategy v1.0 Overview
This strategy is an RSI-based reversal entry system with a ladder-style take-profit mechanism.
It supports Long-only, Short-only, or Both directions and provides optional Average Entry Price, Stop Loss, and Take Profit reference lines on the chart.
Entry Rules
Long Entry: RSI crosses above the Oversold level (default: 20).
Short Entry: RSI crosses below the Overbought level (default: 80).
Optional: If enabled, the script will close the current position when an opposite signal appears before opening a new one.
Exit Rules (Ladder Take Profit)
Take profit is placed as a ladder using tpLevels and tpStepPct.
Example (default tpStepPct = 1%, tpLevels = 10):
TP1 at +1%, TP2 at +2%, … TP10 at +10% (relative to current average entry price).
Each TP level closes tpClosePct of the remaining position, meaning it scales out geometrically:
If tpClosePct = 50% → remaining position becomes 50%, then 25%, then 12.5%, etc.
Stop Loss
Optional stop loss is placed at slPct (%) away from the average entry price:
Long: avg * (1 - slPct%)
Short: avg * (1 + slPct%)
Visual Lines
Average Entry Price Line: current strategy.position_avg_price
Stop Loss Line: based on slPct
Next TP Line: shows the estimated next TP level based on current profit%
All TP Lines: optional (can clutter the chart)
==============================================================
Recommended Use
This strategy is best used on markets with strong mean-reversion behavior.
For exchanges/bots that do not support hedge mode in a single strategy, run two separate instances:
One set to Long Only
One set to Short Only

RSI Monitor (High/Low) + MTF & Time FilterDual-Source RSI: Calculates RSI on the candle High (to detect selling pressure/overbought) and Candle Low (to detect buying pressure/oversold) rather than just the Close.
Multi-Timeframe (MTF) Dashboard: An on-screen table displays the Real-Time RSI High and Low values for your current chart plus two user-defined higher timeframes (e.g., 1H, 4H).
Session-Based Alerts: A built-in time filter restricts alerts to a specific trading window (e.g., 09:30–16:00), effectively blocking signals during low-volume overnight sessions.
Independent Alert Timeframe: You can configure alerts to monitor a specific timeframe (e.g., 60-min) regardless of the timeframe you are currently viewing.
Real-Time Execution: Alerts trigger immediately when levels are crossed (no bar-close confirmation required), ensuring you catch moves as they happen.

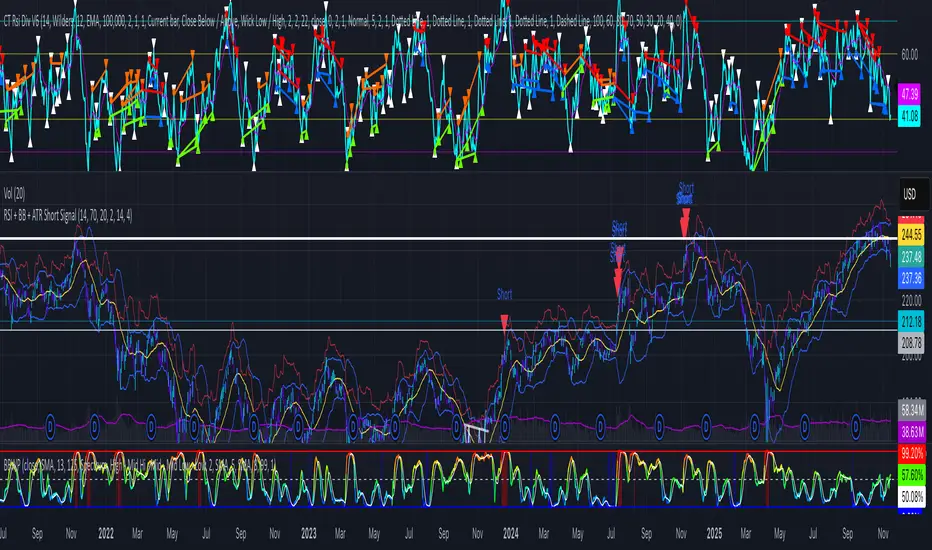
RSI + BB + ATR Short SignalThis indicator highlights potential short setups by combining three conditions:
RSI Overbought – RSI must be above the user-defined level.
Bollinger Band Break – Price must close above the upper Bollinger Band.
Extended Above the 5-Day Low – Price must sit at least X ATR above the recent 5-day low.
When all conditions line up on the same bar, the script plots a red triangle above the candle and triggers an alert so you can act immediately.
To help visualise the setup, the script also plots the full Bollinger Bands (upper, middle, lower) and a line showing the threshold of 5-day-low + ATR × multiplier. You can adjust RSI length and level, Bollinger settings, ATR length, and the ATR multiplier.
RSI Divergence on 15-Minute with 5min & 1min CorrectionUse the 5 minute chart to identify 15 minute rsi divergence, showing the 5 and 1 min rsi levels "participating in" the correction of the 15 minute rsi divergence.

RSI Divergence on 1-Hour with 15min & 5min CorrectionUsing the 15 minute timeframe, rsi divergence on the hourly chart is "tracked" by the 15 and 5 min rsi levels to watch for the hourly chart's rsi correction.

RSI MTF Table - 12 Pairs (1,5,15)
The relative strength index measures the speed and magnitude of an asset's recent price changes. Therefore, it is considered a momentum indicator in technical analysis. Essentially, the RSI is the ratio of the days an asset's value increases to decreases over a given period.
Generally speaking, if the RSI is around 50, we do not expect strong movements. RSI above 65 or below 35 are areas we expect. In this context, this chart and the general momentum in 1-5-15 minutes allow us to quickly determine the parity we will trade. It is useful for intraday trading and scalping.

RSI BandsPlots adaptive ATR bands around the 27-EMA to approximate RSI overbought and oversold zones directly on price. Provides a clean visual reference for RSI-like extremes without displaying the RSI itself.

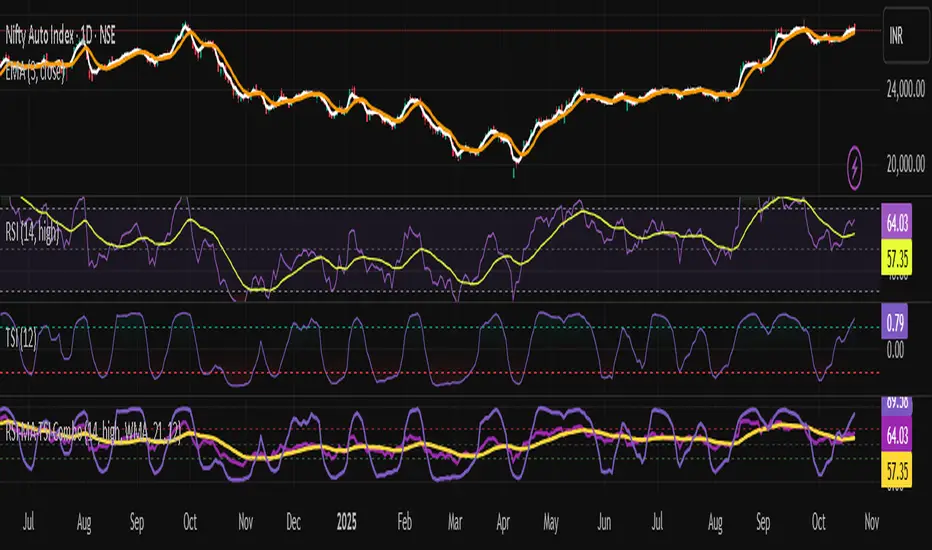
RSI + TSI✅ All 3 indicators in one pane
✅ RSI and RSI MA with standard zones (30, 50, 70)
✅ TSI scaled to 0–100 range for alignment with RSI
✅ Color-coded TSI fill for quick trend recognition (green = bullish, red = bearish)
✅ Compatible with TradingView v6
RSI Prior DayLagged RSI indicator showing the prior day's RSI(14) value for easy divergence detection. Plot it alongside current RSI to spot bullish/bearish signals. Ideal for swing traders scanning for momentum shifts.