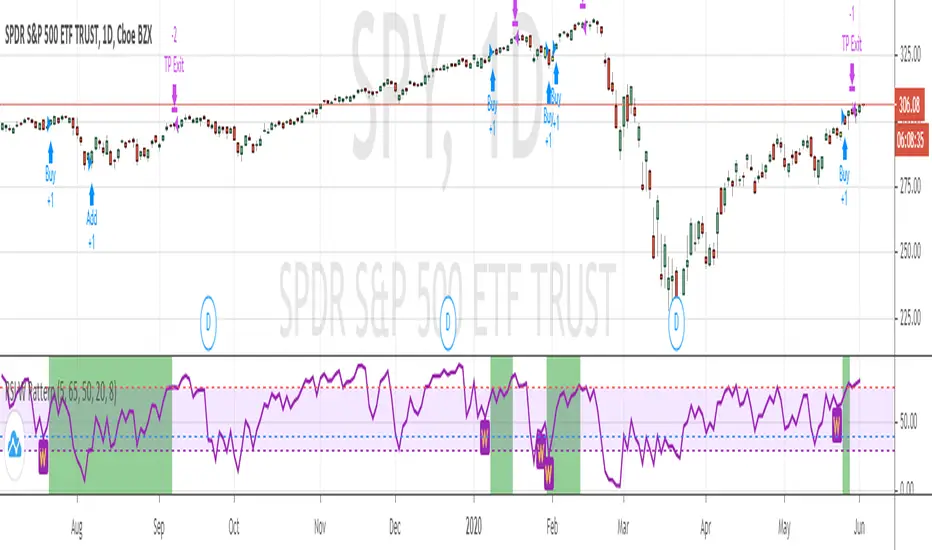
RSI W Pattern strategyThis strategy is similar to RSI V pattern strategy, but it looks for W pattern in RSI chart.
RULES
======
BUY
1. ema20 is above ema50
2. RSI5 crossing up 30 from oversold area
3. and RSI5 must be below overbought area (default value set to 65)
Add to existing Position
1. You can add on the next W pattern OR
2. if RSI5 is crossing up from below 20
Exit
1. when RSI5 reaches 75
Note: This is for short term/swing trading . which gets on when price dip in trending and quickly gets you out on RSI overbought area
Cerca negli script per "rsi"
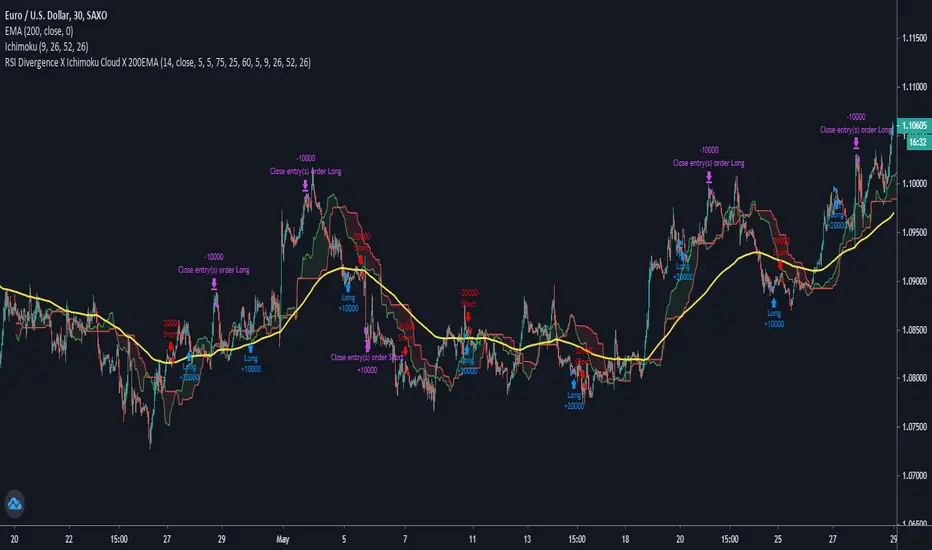
RSI Divergence X Ichimoku Cloud X 200EMAHi all,
This script is a combination of the RSI Divergence Strategy combined with Ichimoku Cloud and 200 EMA .
A long position is entered only when the RSI identifies a bullish divergence (either regular or hidden), and that the Ichimoku Cloud is above the 200 EMA . This is to ensure that there is a confirmation of a bullish trend before an entry.
Similarly, a short position is entered only when the RSI identified a bearish divergence (either regular or hidden), and that the Ichimoku Cloud is below the 200 EMA . This is to ensure that there is a confirmation of a bearish trend before an entry.
I find that this script works best on Intraday charts.
This is just a simple script I built on my third attempt of backtesting strategies on TradingView. Do give it a go and let me know if you guys have any feedback or comments about it. Happy trading!
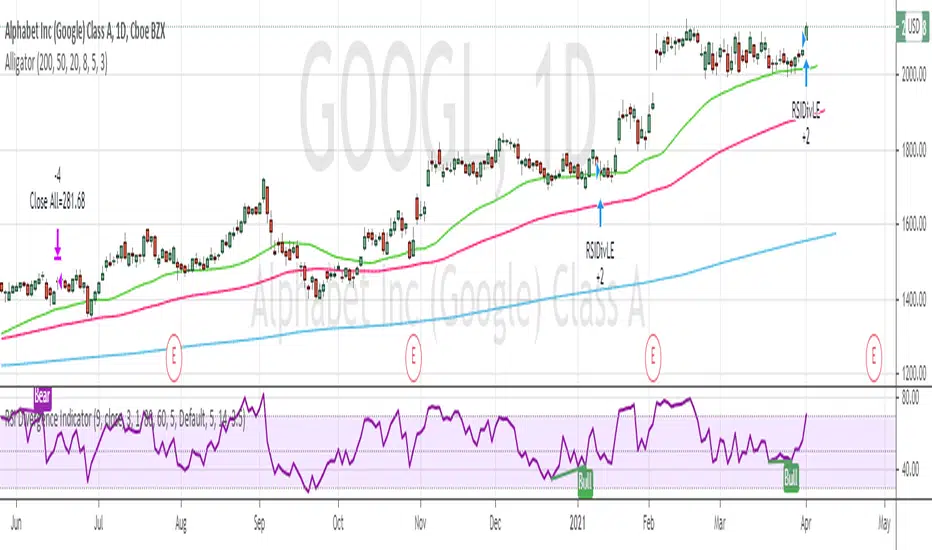
RSI Divergence Indicator strategyThis strategy is based on RSI divergence indicator.
RSI period setting 5
Go Long when Bull or Hidden Bull is shown
Exit when RSI goes above 75 OR when bear condition appears
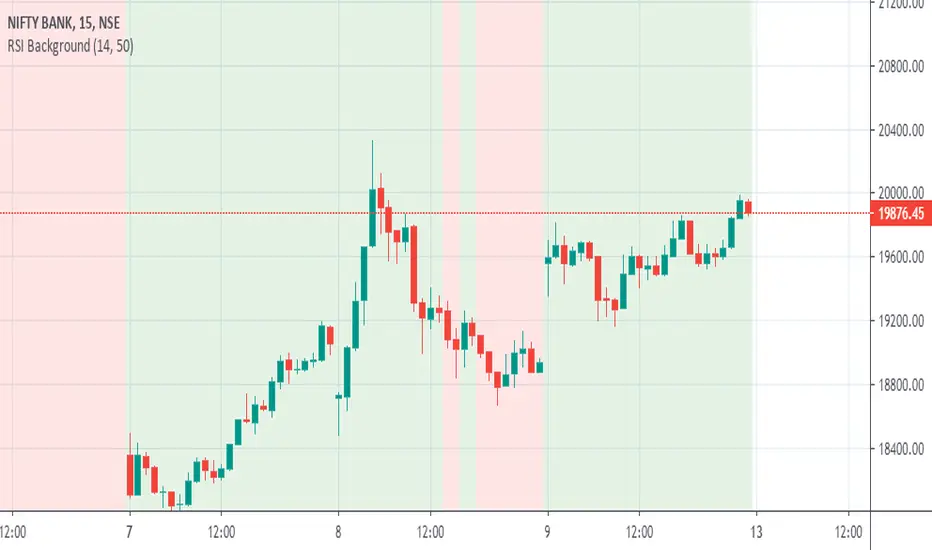
RSI 50 BackgroundThe script changes the background depending on the RSI 14 values. If RSI 14 values is above 50 the background is green and if RSI value is below 50, the background will be red.
Rsi, Ema , Ma and Bollinger Bands for 1 min BtcusdtThis is for 1 min Btcusdt pair.
I am tring to find a way to catch %1 ups and downs.
Basicly it buys when rsi low and minute candle closes under ema,ma and lower bollinger band,
it sells when candle goes over upper bb,low ma, when rsi high.
It sells when rsi high ,candle closes over upper bb,over low ma and does the opposite when buying.
I know it's crowded but still tring to learn what to do ^^
I welcome any suggestions to improve.
It works better with shorts for now.
Don't buy with this !! You might lose big !

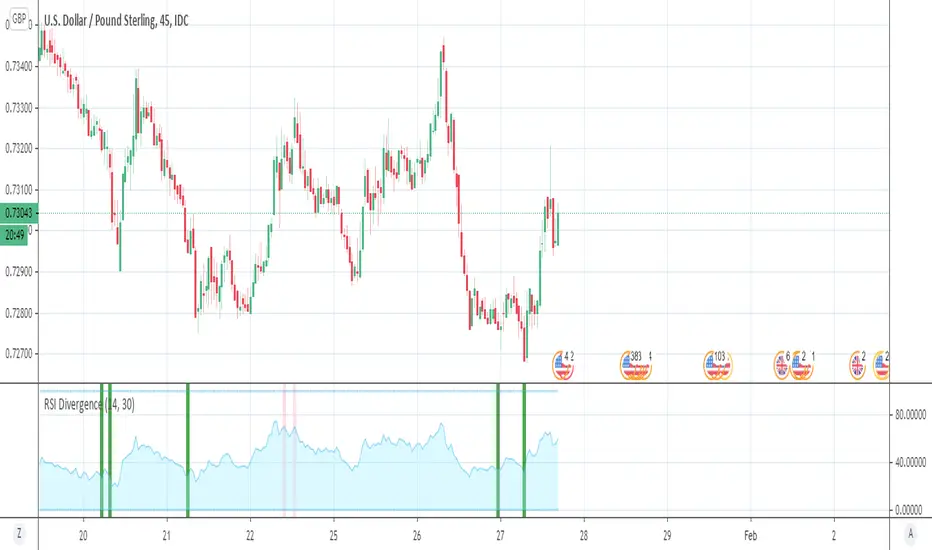
RSI Divergence (Pine v4)Summary
Script highlights the divergences in RSI worth taking notice of. By comparing current envionment to relative sample we can see more than
the standard divergences that many catch through analysis. This framework aims to remove the bias or noise many see when looking for any supporting
evidence to their given emotion on a market.
Step-by-Step Walkthrough
Calculates RSI
Sets Divergence Framework
-------> a. Defining variable values, mandatory in Pine 4)
-------> b. Identify Divergences --> "If bar with lowest / highest is current bar, use it's value"
Compare high of current bar being examined with previous bar's high --> "If curr bar high is higher than the max bar high in the lookback window range"
Finds pivot point with at least 2 right candles with lower value
Finds pivot point with at least 2 right candles with lower value
Plot
Set Alerts
This RSI Script is intended for public use and can be shared / implemented as needed
Questions? I do not monitor my TradingView inbox. See email address in signature at the bottom of this page for contact information.

RSI-VWAPBacktest script based on the previous RSI-VWAP indicator:
It's the popular RSI indicator with VWAP as a source instead of close:
- RSI_VWAP = rsi(vwap(close), RSI_VWAP_length)
What is the Volume Weighted Average Price ( VWAP )?
VWAP is calculated by adding up the dollars traded for every transaction (price multiplied by the number of shares traded) and then dividing by the total shares traded.
Trades are laddered to improve the average entry price and each entry is increased, improving the entry but increasing the risk of being liquidated.
It can be easily converted to study (alerts)
Settings for BINANCE:BTCUSDT at 30m

RSI + EMA+ MTF Stop-LossThis is a simple RSI with multiple MTF (No security) to help with direction short and long-term.
The rsi for the current chart has a noise reduction, while the rest are based on ma's.
I have supplied an extra flexible mtf rsi ma for potential adjustable/long-term stop-loss or direction identification.
Enjoy

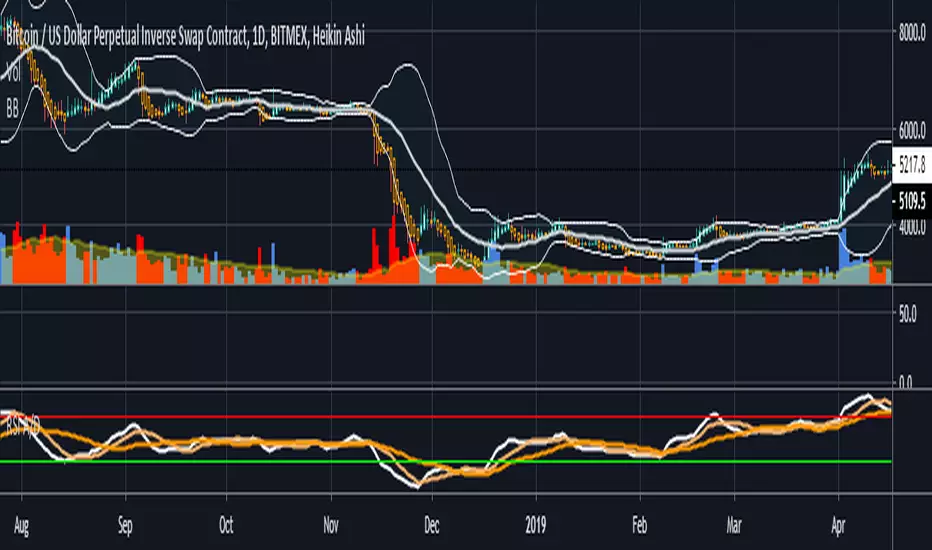
RSI Top & Bottom Warning [aamonkey]An enhancement of my RSI Bottom Indicator.
This one finds you Tops & Bottoms.
This indicator uses the RSI and prints you top & bottom warnings directly on the price chart.
The other special thing about this is that the RSI pulls the data from the weekly chart no matter on what timeframe you are on.
The preferred timeframe can, of course, be changed in the settings as well as any thresholds for tops and bottoms.
The default settings are very good for btc, but be free to try and test this indicator with different settings on different charts.

RSI Bands %BThis is again a lazy bear script that has been lost due to the removal of the "make it mine feature".
please credit
If you see any of his great scripts that are no longer accessible message me and I will see what I can do.

Rsi candlepivThis indicator has 3 part
1. bullish and bearish zone based on % channel
2. Rsi candles
3. pivot system that based on rsi candles high and lows mark in red and blue arrow
together it can give estimate about your potential trade in more easy way. so it little more sophisticated RSI system

RSI and A/D StrengthThis is an edit of Chris Moody's EMA of RSI script see the original here:
The edited version has an accumulation distribution line as well as well as two SMAs
If you want a detailed look at how I use ADX and DI along with it to enter/exit please see the following video and article
youtu.be
bitcointradingtoday.com
RSI MFI with alertsModified from the various scripts I've found on TradingView. This scripts adds alerts for oversold overbought conditions. It also has the ability to add in another RSI at a different time interval.
I've also added an MFI with bollinger bands to the chart to preceed the RSI. This can sometimes tell you the direction the RSI is moving. usually when it is out of the bollinger bands on the MFI the price/RSI tends to slow.

RSI & Stochastic RSIRSI and Stochastic RSI Same Chart
Turn on StochRSI crossover signals
Customizable values

RSI and Stoch RSI Midline Crossover ArrowsPuts arrows on chart when RSI crosses over 52 and also when Stoch RSI crosses up 52 based on Warsnop strategy.


RSI CaveGives the same info as a conventional RSI oscillator except it's shown as a scary cave that price is trying to avoid touching. An indicator for the more visual traders out there. With thanks to LazyBear for the RSI band code.
I've included an RSI in the chart above for demonstration purposes.

RSI Candles (with wicks)The script adds wicks to the RSI candle indicator.
It is based on the RSI candle indicator by cI8DH.
Note that the definition of these wicks is not unique.
The implementation uses an RSI calculated from the highs and lows for the wicks.

RSI - Div - TDIBasic RSI with BBs length 34
Ability to show divergences inspired by
Added Sharkfins - when rsi moves sharply out of BBs and below / above 75 / 25 RSI
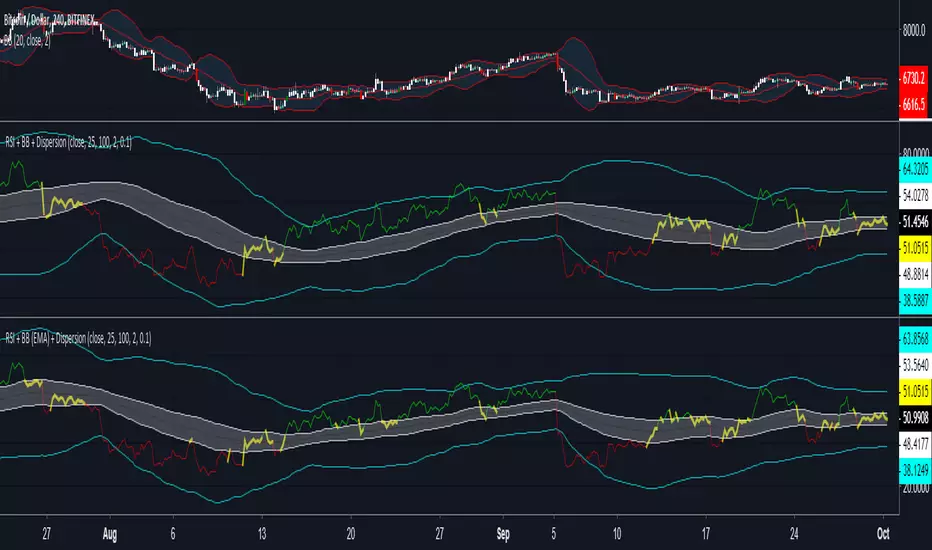
RSI + BB (EMA) + DispersionInitial data:
1) RSI
2) Bollinger Bands (Basis - EMA)
3) Dispersion (around basis)
Signal for purchase: RSI crosses the dispersion zone upwards
Signal for sale: RSI crosses the dispersion zone downwards
Buffer zone: white area, it is not recommended to make transactions.
RSI/Stoch/SRSI MTF COMBOThis combo-indicator is based on @ChrisMoody 's RSI and Stoch MTF original scripts.
It gives traders the possibility to overlay RSI, Stochastic and SRSI as well as to see how each element is behaving on a higher/lower TF.
RSI, Stoch and SRSI can be individually configured as well as turned on/off by the user.
Overbought/Oversold and Middle lines are available but only the formers can be configured by the user - Middle Line is fixed at 50.
This indicator is open source and free to use. Feel free to change it around to suit your needs.
***If you copy & paste the script, please remember to credit Chris Moody for his amazing work.***
Happy trading!

RSI or MFI %BPlots where RSI or MFI is inside its Bollinger Bands. Various strategies: good to see the trend (above/below average), overbought/oversold conditions (you could work a strategy around RSI getting out of overbought/oversold conditions as shown in the screenshot), divergences, etc...
I will also publish a Bollinger Bands width of RSI to identify areas of squeeze in volatility
Enjoy!

RSI DivergenceSimple RSI Divergence with adjustable lookback period.
Highlights bars with higher price but lower RSI (bearish) or lower price but higher RSI (bullish) than the highest/lowest points in the lookback period.