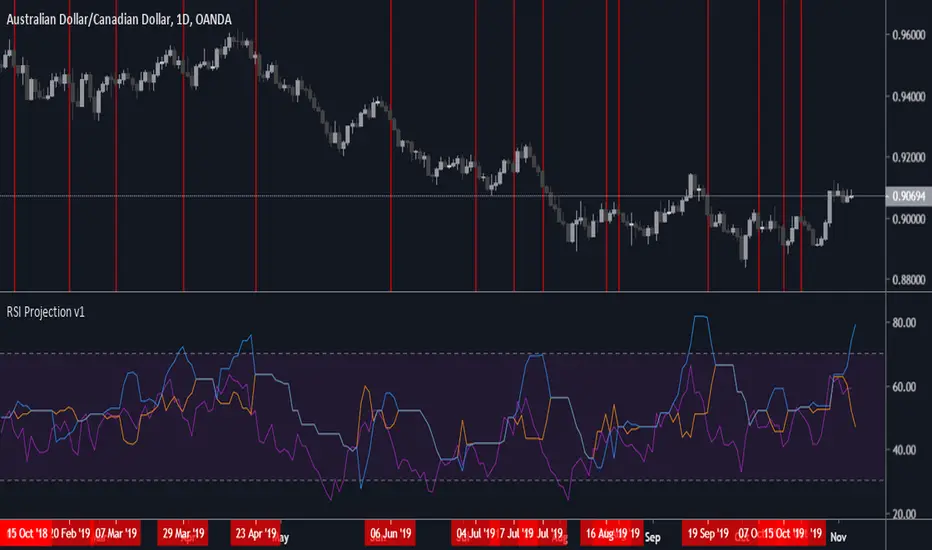
RSI Projection v1Application of concepts from Constance Brown "Technical Analysis for Trading Professionals", specifically: Chapter 7: Price Projections By Reverse Engineering Indicators , and Chapter 8: Price Objectives Derived From Positive and Negative Reversals In The RSI .
Specifically: I wanted to see if better Exit signals for the RSI could be generated from a basic application of some of the concepts in those chapters, and that is what I've found so far:
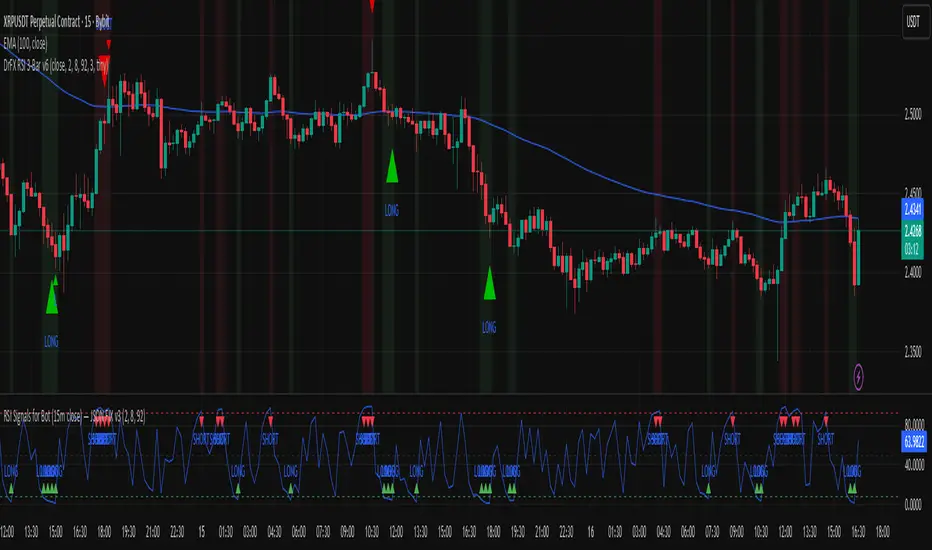
Exit when the RSI (purple) crosses below the orange line
Orange line is forecasted RSI for positive price reversals, blue line is forecasted RSI for negative price reversals
From what I can tell, this indicator does not work well during chop/consolidation and ranging periods, generating too many false signals without additional confluence from trending indicators and price analysis
This indicator should be considered highly experimental - do not use live trading without proper backtesting and parameter adjustment.
Tuning per asset and timeframe is required due to calculation type for highs/lows used for projection calculations
Cerca negli script per "rsi"
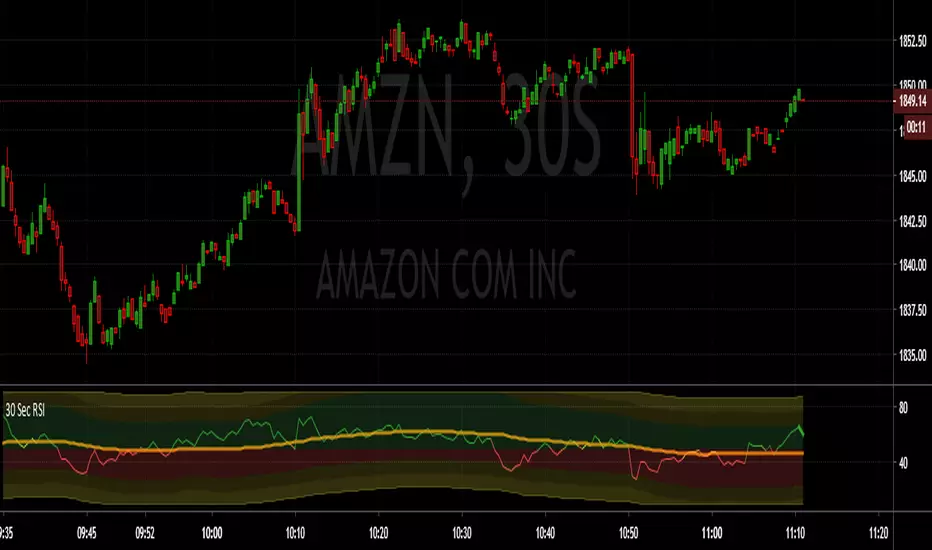
RSI and RSI SMA Signal with Variable LevelsThis script does the following:
Plots RSI to the existing resolution.
Plots the 50 SMA (sourced from the RSI)
Colors the line red when below the 50 SMA and RSI is below 50.
Colors the line green when above the 50 SMA and RSI is above 50.
Banding:
Green from 50 to 70
Dark yellow from 70-80 and 30-20
Red from 50 to 30
Brighter yellow from 80-90 and 20-10
The banding varies if there is a trend in the 50 SMA that holds below the 50 level. This way it defines the levels safe to maintain a position during and not during a trend.
You will notice that the red area increases and the OS yellow area(s) decreases if a short trend has developed.
You will notice that the green area increases and the OB yellow area(s) decreases if a long trend has developed.
The maximum levels are limited to 90 and 10.
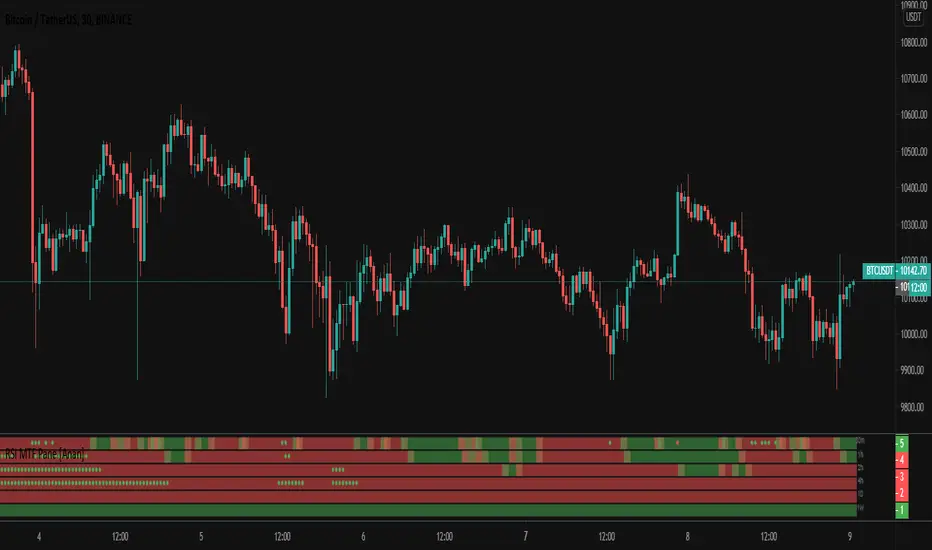
RSI MTF Pane [Anan]Hello friends,
I fall in love with those panes :D
This is RSI MTF Pane :
Green : RSI >= 50
RED : RSI < 50
Green Dot : RSI Oversold
Red Dot : RSI Overbought
That's all :D
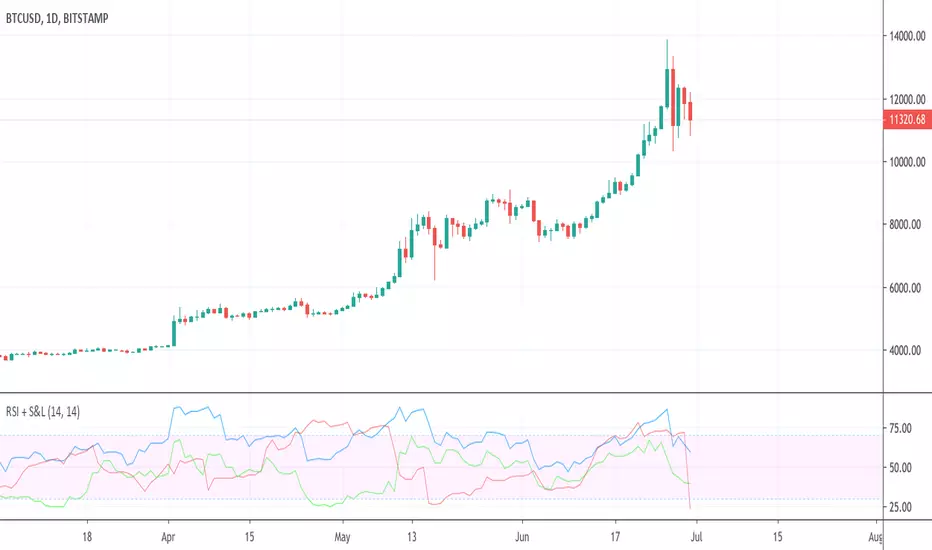
RSI + BTC Short & Long RSIsPlots the RSI for the current chart (same as the built-in RSI indicator) and adds the RSI values for the Shorts and Longs (S&L) from Bitmex. The main reason I've used the RSI value is to have it on the same scale as the price chart's RSI. The general trend of the S&L is preserved.
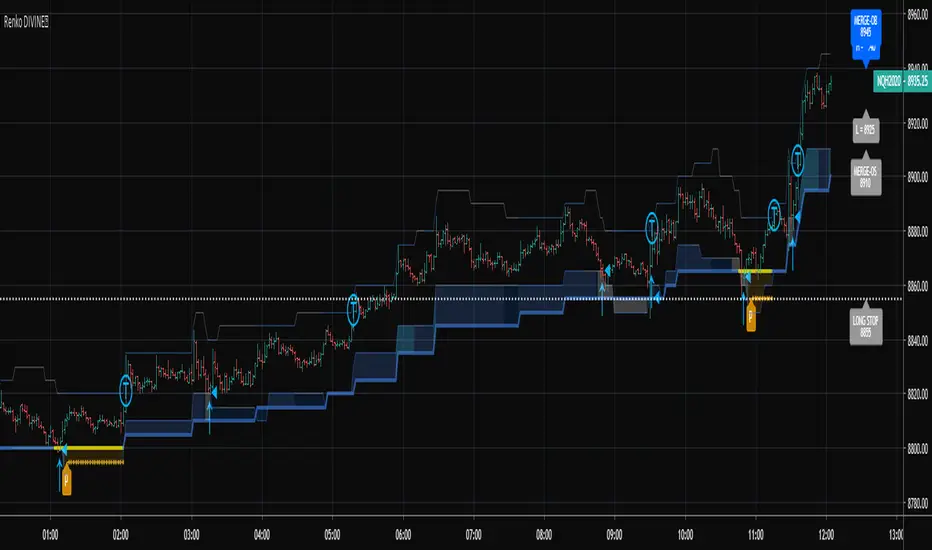
RSI-RENKO Divine StrategyLive, non-repainting strategy using RENKO and RSI mixed together to multiple types of long and short positions.
- Features -
Live entry direction with trade warnings and alerts
Live trade building buy and sell limits (for buy/sell limits)
Entry location icons as well as pyramid entries (to add to existing position)
Swing trades that keep you in the trade for the maximum possible profit
1 scalp target based on the RSI settings and entry location
Dynamic trailing stop for swings and scalps
Alert conditions for every update and condition change of the strategy (Provided by indicator study)
4 pre-built color themes, including candlestick coloring
This script is used solely for alerts to the RSI-RENKO Divine Strategy , because Trading View still after 3 years of requesting does not provide the ability to use alert conditions inside a strategy script, only an indicator script. This strategy should be used to backtest your settings. Beyond alerts and strategy inputs, the strategy and indicator are identical.
RSI with Smoothing and over-areas coloredI have noticed that lower length-values for RSI give much better signals for day and swing trading than default 14 bars back period. Also smoothing the RSI line by using moving average method reduces some of the noise/fake turn-backs.
Here you can change:
- bars back of RSI (default 4)
- smoothing the line (default 3)
- bars colorization of RSI's uptrend and downtrend (default ON)
I encourage you to play around with parameters to fit your favourite intervals best way.
If you would like to have BUY and SELL signals same as on the chart above, here you have my complementary script for that:

RSI + SMAx3Ceci est un script assez simple, un RSI comme celui qui est intégré mais avec la possibilité de tracer 3 droites de plus permettant ainsi de soulager certains chartiste qui pourrant régler la position de ces droites (horizontales) avec une parfaite précision.
S'ajoute à celà 3 moyennes mobiles arithmétique intégrées à l'indicateur RSI.
__________________________________________
This is a pretty simple script, with three lines to help relieve some chartists that make it possible to position these (horizontal) positions with perfect precision.
Add to this 3 arithmetic moving averages integrated in the RSI indicator.
__________________________________________
Este es un script bastante simple, un RSI como el que está integrado pero con la posibilidad de dibujar 3 líneas más, lo que permite liberar a algunos chartistas que pueden ajustar la posición de estas líneas (horizontal) con una precisión perfecta.
Agregue a esto 3 promedios móviles aritméticos integrados en el indicador RSI.
__________________________________________
Dies ist ein ziemlich einfaches Skript, ein RSI wie der, der integriert ist, aber mit der Möglichkeit, 3 weitere Linien zu zeichnen, wodurch einige Chartisten entlastet werden können, die die Position dieser Linien (horizontal) mit einer perfekten Genauigkeit einstellen können.
Hinzu kommen 3 in den RSI-Indikator integrierte arithmetische gleitende Durchschnitte.

RSI with Highlights and DivergencesThis script is an RSI replacement, useful especially for Day traders (15m or less) but can be used as a normal RSI by changing the settings to 14 / 70 / 30
Features:
- RSI with adjusted settings for lower time frames
- highlight when RSI and price diverge when RSI is at extremes
- highlight of the Overbought and Oversold conditions
- 50% line
- candle colors for Overbought and Oversold conditions

RSI Multi Time Frame [Jigga]This indicator simply displays RSI on 4 time frames. You can configure individual RSI lengths as well. The first two RSIs are more visible to prevent clustering. It is possible to define oversold / overbought areas and the script displays the middle line as well.
A couple of use cases:
Comparison of 7, 12, 18 and 24 RSIs on a given time frame
Comparison of 14 RSI on 30m, 1h, 2h and 3h time frame (Default settings)
Please, always use a proper stop loss and risk management.
Here you can see it in action:
BTC - BitMex
BTC - BitMex

RSI Divergence Smoothed with Signal Line and Power ZonesThis Indicator plots Regular and Hidden Divergences lines for an RSI smoothed by an EMA and for its Signal Line
The RSI can be set to change colour with direction or can be set as single colour
Colour Changing RSI helps when trading Multiple Timeframes as you can look for confluence in the direction of RSI
The divergence script is thanks to @RicardoSantos, I've just adjusted it to suite my indicator
Remember that divergences work best when traded with the trend or very late in a trend when going against the trend
I have also added a Colour Changing Signal Line & Hima Reddy's Power Zones so now you can also
Take full advantage of trading; signal line crosses, 50 crosses and Power Zone RSI support and resistance

RSI / STOCH RSI OVERLAY by BluephantomI found that I was always using the RSI and Stoch RSI in combination with each other and I started to merge them.
But I found that it was getting annoying having to merge them every time I opened them up on the screen
I also used a horizontal line at 50 to show the mid point as many traders do but again it was something I had to add every time I opened up the indicator again.
So I created this script that overlayed the Stoch RSI and RSI and added a half way line at 50.
Please note that the default lengths are at (10) instead of (14). This is just my personal preference for Bitcoin/Crypto trading. You can change these settings and "Save As Default" to whatever works for you.

RSI / Stoch / Stoch RSI (SRSI) Overlay [SigmaDraconis]One indicator combining RSI, Stochastic Oscillator and Stochastic RSI in one.
Credits for rwhiteside and his RSI / Stoch RSI Overlay indicator who served as inspiration to all three.
I believe this will be very useful to a lot of people.
If you like, use and i prove to be , you can contribute to my
TIP JAR :

RSI + Stoch/RSIThis is a combination of 2 of the most used indicators. RSI and stochastic/RSI
Ive coded them both to work together to save space on your chart and work as only ONE indicator.
I specifically only use the D line with my rsi , but you have the option to use the K and D line if you so choose.
RSI is good for momentum
Stochastic is good for short term momentum.
They work very well together and if you are a swing trader or scalper they can help immensely when looking for sniper entry areas after you've done you're initial pattern, level, fibonacci and wave analysis.
I like the way this works and have been using these two indicators for a while so I figured I would share.
Happy new year everyone, God bless!
RSI Stochastic Extreme Combo alertThis script will give you red or green columns as an indication for oversold/overbought based upon the rsi and stochastic both being at extreme levels (you set). The default oversold is at 35. If Stochastic and RSI fall below 35, you will get a green column (Both indicators at the extreme). Play with your levels to see how your stock reacts. RSI and Stochastic can both be changed along with each of the levels you would like the color change. I have set mine at RSI low: 37, RSI high: 63, Stoch low: 10, and Stoch high: 90. These levels have been working well for me on AAPL. Enjoy and don't forget to leave a comment if it helps your trading or you have other ideas about what is working for you.

RSI-ma Wave Sensor (Free ver.)RSI-ma Wave Sensor is a 3-line RSI-based oscillator (Main / Middle / Wave) that shows trend direction, momentum and higher timeframe context in a single pane.
Compared with many classic MA/RSI tools it aims to:
• react with very low lag (almost real-time feeling)
• detect trend direction early
• avoid “overbought/oversold sticking” so you can hold calmly until the trend really starts to end
This Free version is a DAY trade preset for the 15m chart:
• Main = 14, Middle = EMA 9, Wave = EMA 28
• 1h higher timeframe wave sensor included
• good for learning / testing how to read trends with RSI waves

RSI ✶ YSTCThis is a Bonus Indicator from YSTC's Volume Profile Tools.
Relative Strength Index (RSI)
A momentum based oscillator which is used to measure the speed (velocity) as well as the change (magnitude) of directional price movements.
What Different about this RSI by YSTC.
You get Support and Resistance lines for RSI which are 20, 30, 40, 50, 60, 70, 80. as shown below.
It can also show RSI Candles as shown below.
For those who want all types of MA with MA Cross can play with this indicator. Below is MA Cross of 9, 21.
And for NEW user with untrained eyes who cant yet detect Divergence this indicator Saves you the trouble of finding.
Below is Regular Bullish and Bearish Divergence. Linewidth 2.
Below is Hidden Bullish and Bearish Divergence. Linewidth 1.
You can add this script to your chart by clicking "Add to favorites" button.
Have Questions ?
Contact: +91 9637070868.
Name: Yogesh Patil (YS Trading Coach).
Time: Monday to Saturday (10:00 AM - 06:00 PM).
Visit our website - YS Trading Coach .
FREE Self Study Yourself Course: Trading with Price Action Volume .
Free Stock Market Introduction Available here .
Paid Course: Trading with Price Action Volume
Paid Volume Profile Tools available here.

RSI (Custom Background) KDMThis code is a custom version of the RSI (Relative Strength Index) indicator.
Its main purpose is to compare recent price gains and losses to determine whether the market is in an overbought or oversold condition.
30–50 zone (purple tone): represents a weak or pullback area.
50–70 zone (green tone): represents a strengthening or dominant buying area.
Additionally, when the RSI line moves above 70, a green gradient background highlights the overbought region; when it moves below 30, a red gradient background emphasizes the oversold region.
Like the classic RSI, this version is a momentum indicator showing whether the price is losing or gaining strength.
The key difference is the colored background, which allows you to visually identify the RSI zones (e.g., 30–50 weak, 50–70 strong) much faster and more clearly.

RSI FlipIndicator Description: RSI Flip (30/70 Threshold)
This indicator uses a 7-period Relative Strength Index (RSI) to detect potential market reversals based on classic momentum thresholds:
- RSI < 30 → triggers a Long Deal Signal (1) indicating potential bullish reversal.
- RSI > 70 → triggers a Short Deal Signal (2) indicating potential bearish reversal.
🔧 Features:
- Backtest-compatible output: Hidden plots emit 1 for long and 2 for short, enabling seamless integration with strategy scripts.
- Bias tracking: Internal bias state updates on each trigger, allowing for modular lifecycle logic.
- Background tinting ready: The bias variable can be used to drive visual overlays or downstream automation.
🧩 Integration Notes:
- Designed for symbol-specific use — no external feeds or dependencies.
- Ideal for modular signal stacking, lifecycle-safe deal initiation, or audit-grade strategy mapping.
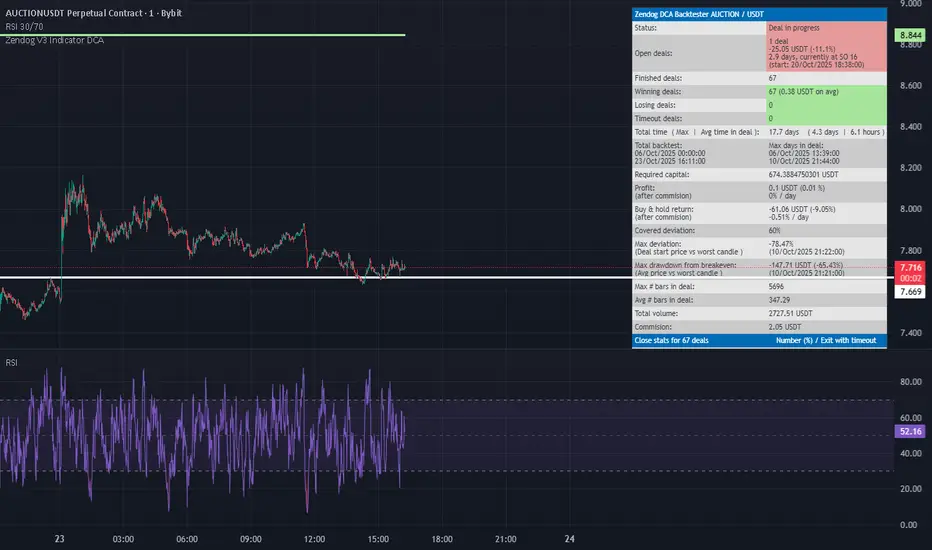
Rsi- bybitbot - JSON v3Backtesting based on the RSI indicator, based on the RSI length, RSI level, and the number of candles at the RSI level. Backtesting for monitoring in-points.
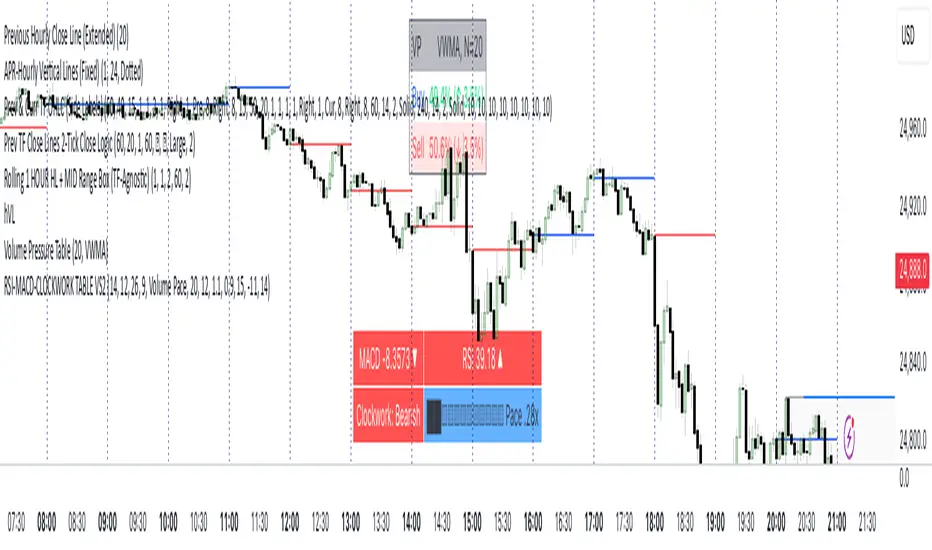
RSI MACD CLOCKWORK TABLEWhat you get, at a glance:
• MACD Cell — Shows the current MACD value and a small direction icon (▲ rising, ▼ falling, ⏺ flat). The background color adapts to regime: green above zero, red below zero, gray near the line. Lengths are configurable (fast/slow/signal).
• RSI Cell — Plots the latest RSI with an identical direction icon and background logic (green above 50, red below 50, gray around 50). RSI length is configurable.
• Clockwork Row — This is the structure check. The script computes the slope (in degrees) of EMA(5), EMA(8), and EMA(13). If all three exceed your bullish threshold, you’ll see “Clockwork: Bullish” (lime). If all three are below your bearish threshold, you’ll see “Clockwork: Bearish” (red). Otherwise, it’s “Neutral” (gray). Thresholds are fully user-tunable.
Smart right-hand cell (choose your readout):
• Duplicate — Mirrors the Clockwork label.
• Time to Close — A clean mm:ss countdown for the current timeframe (with safe defaults on unusual timeframes).
• Slope Degrees — Prints the 5/8/13 EMA slopes in degrees (e.g., +12.3°).
• Slope Pack ▲▼ — Only the direction of each slope (less noise, more speed).
• EMA Spread (5↔13) — Shows the slope differential (degrees) between short and long EMAs.
• Volume Pace — Projects end-of-bar volume from live progress, compares it to your N-bar average, and renders a tiny text progress bar (██░░…) with a neutral “thermo” palette: black = hot (> high threshold), light blue = cold (< low threshold), silver = typical. All inputs (length, bar width, thresholds) are configurable.
• ATR — Current ATR with direction vs previous bar (▲/▼/⏺).
Quality-of-life:
• Optional top padding (~20px) to keep the table visually separated from other overlays.
• Lightweight string/emoji UI for clarity without heavy graphics.
• Defensive guards around timeframe math so the TTC keeps working smoothly.
How to use:
Add to any symbol/timeframe.
Set your MACD/RSI lengths and Clockwork slope thresholds to match your system’s sensitivity.
Pick a right-cell mode that complements your workflow (TTC for day trading, Volume Pace for intrabar context, ATR for volatility).
Note: This tool is informational, not a standalone signal generator. Combine the Clockwork alignment with your entries/exits and risk management.
RSI-like VWAP — DivergencesThis script introduces a unique RSI-style oscillator built from VWAP (Volume-Weighted Average Price) instead of price alone, offering a more volume-aware perspective of market momentum.
🔹 Key Features:
Computes an RSI-like indicator using either a per-bar VWAP proxy (HLC3/OHLC4) or true intrabar VWAP (via lower timeframe aggregation).
Customizable overbought, oversold, midline, and deadband levels for better signal filtering.
Divergence detection (regular + hidden) between price and the VWAP-RSI oscillator, with clear lines and labels in the indicator pane.
Auto-scaled pivot sensitivity across different chart timeframes to maintain consistency.
Built-in alert conditions for bullish/bearish divergences, making it watchlist-friendly.
🔹 Use Cases:
This tool helps traders spot momentum shifts and early reversal signals by blending the logic of RSI with the weighting power of VWAP. It’s especially useful for detecting divergences where price action may be misleading without volume context.

RSI (1 y 5m) + divergences y rsiNDX 1mWith this indicator we incorporate
RSI of the selected asset in 1 minute.
RSI of the selected asset in 5 minutes.
RSI of the NASDAQ 100 in 1 minute.
Includes divergences that are drawn at the extremes of the RSI of the symbol in 1 minute.
Objective of the indicator:To use it in scalping (intraday) with assets from the Nasdaq 100 ETF, to compare the behavior of the asset against its base index.

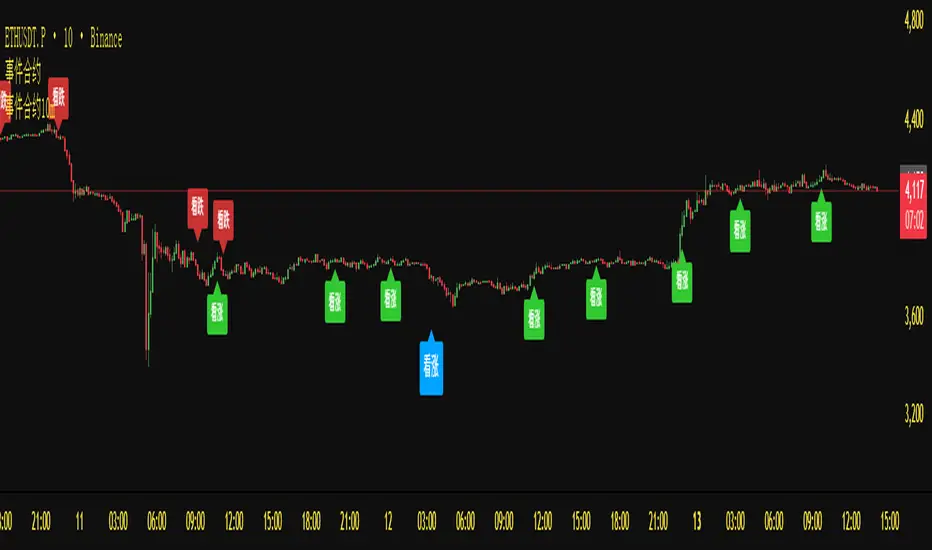
RSI+VOL——Binary(One bar)Overview
This indicator integrates Stochastic RSI, MACD trend alignment, ADX trend strength, and multi-dimensional volume analysis to provide intelligent signal guidance and market activity monitoring. It is suitable for short-term, swing, and event-driven trading, offering clear visualization of trend direction, market strength, and volume anomalies.
Core Features
1️⃣ Stochastic RSI Signals
Automatically identifies overbought and oversold conditions to generate buy and sell reference signals.
Signals are filtered with candle closing direction to reduce counter-trend entries.
2️⃣ MACD Trend Alignment
Signals trigger only when MACD trend direction aligns with Stochastic RSI, improving accuracy.
Real-time trend alignment reduces noise from ranging markets.
3️⃣ ADX Trend Strength Filter
Signals trigger only when ADX indicates a significant trend, filtering out low-strength movements.
Helps capture primary market directions.
4️⃣ Multi-Dimensional Volume Analysis
Differentiates bullish and bearish volume to identify breakout signals.
Relative volume (RVOL) ensures signals occur during periods of active trading.
Background highlights abnormal spikes and extreme volume, clearly reflecting market activity.
5️⃣ Signal Visualization and Alerts
Buy and sell labels with corresponding RSI values are displayed on the chart.
Built-in alert conditions support TradingView notifications and strategy integration.
Indicator Value
Multi-dimensional alignment: combines trend, momentum, and market activity for comprehensive assessment.
High-precision signal reference: filters noise and provides clear entry indications.
Market activity monitoring: highlights extreme volume to reflect market participation.
Broad applicability: suitable for short-term, swing, and event-driven trading across various markets.