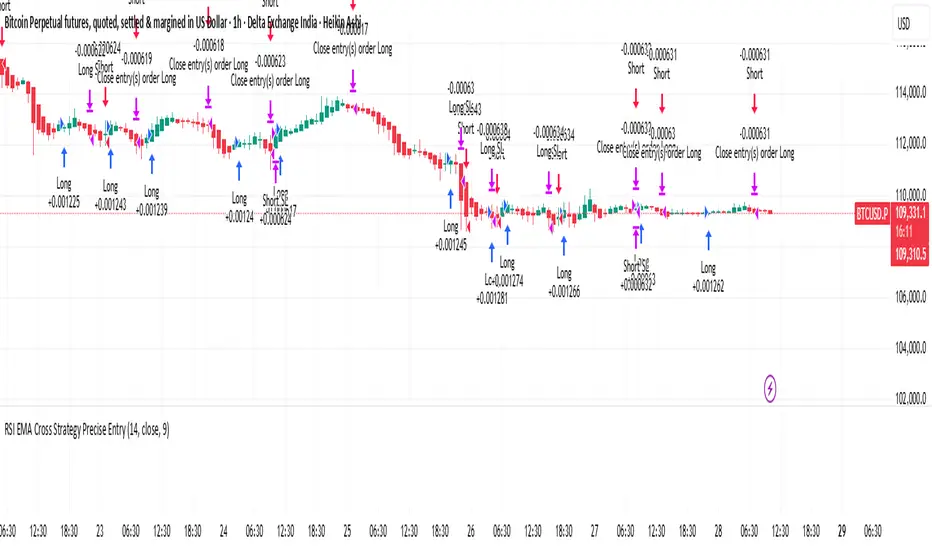
RSI Cross Strategy Precise EntryThis is based on RSI movement. it generates buy and sell signals precisely
Cerca negli script per "rsi"
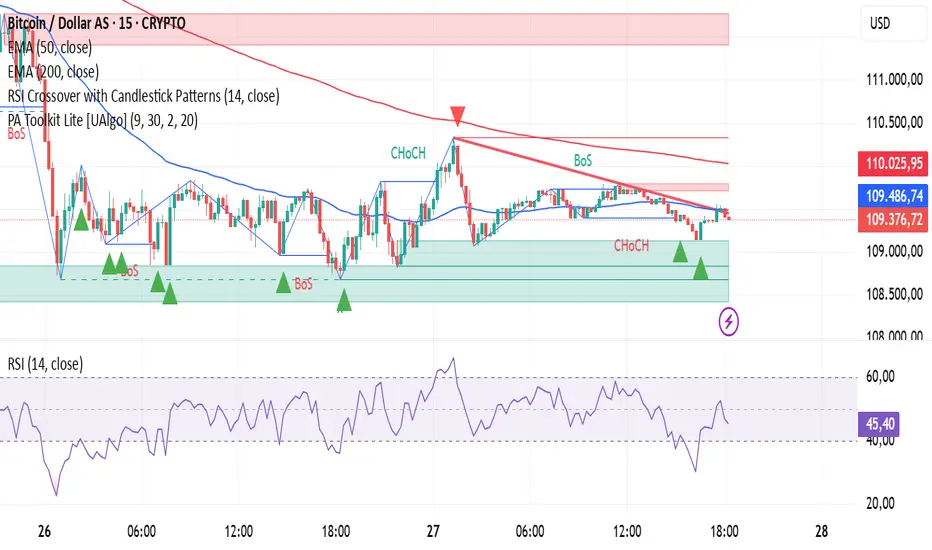
RSI Crossover with Candlestick Patternsusing the RSI indicator levels 40 and 60, where the signal cuts above level 40 with a candlestick hammer or bull engulfing and cuts below level 60 with a candlestick inverter hammer or bearish engulfing.
RSI Custom Crossermarks custom RSI cross upwards. Just to help identify wherever there is crossover. It can be used for analysis of psi. Not a strategy

RSI DivergenceThe code originally belongs to Matthew J. Slabosz, the founder of Zen Trading (The Art of Trading). ✍️📈
👉 My contribution and improvement was adding a divergence line directly on the RSI chart.
Why? Because most people can’t confirm correctness just by reading the code. 🧑💻❌
They need to see it with their own eyes 👀✔️ — this prevents misinterpretation and makes divergences crystal clear.
✨ By adding these visual confirmations, the efficiency and usability of the code has been significantly enhanced. 🚀📊

RSI with KAMA and Custom Buy/Sell SignalsUses Kaufman MA on the RSI to generate signals when crossing user thresholds

RSI-MACD-trade"Strategic trading strategy using RSI and MASCD
Highest returns when applied to weekly charts"
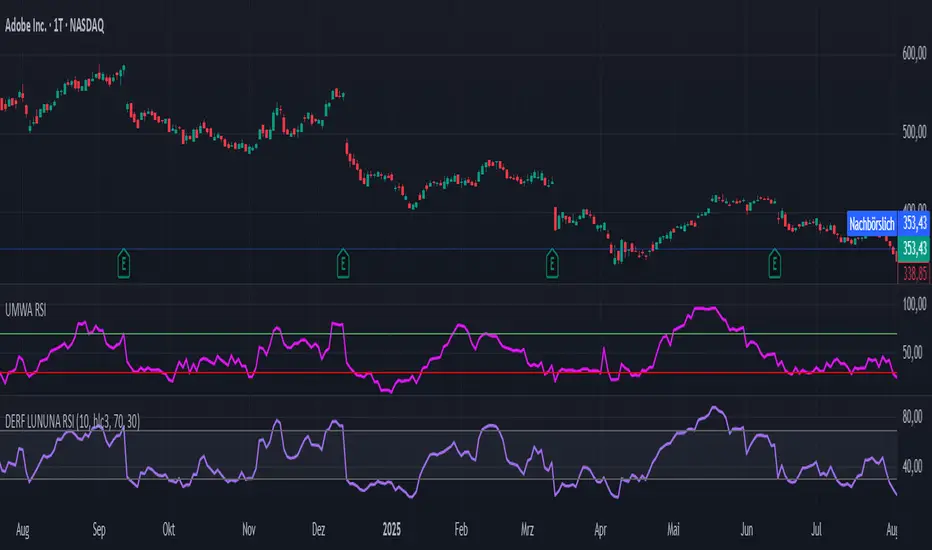
DERF LUNUNA RSIRSI for my needs. I adjusted it for my own trading habits. If you are interested feel free to use it.
RSI Diode PanelA small and clean RSI panel that simultaneously shows the 15m, 30m, 1h, 2h, 4h, and 1d timeframes, which can help you with basic trend orientation.

RSI (14) with Auto Zone Colors — Overbought/Oversold HighlighterThis indicator plots the Relative Strength Index (RSI 14) with dynamic color changes for instant visual clarity:
✅ Green line in overbought zone (≥70)
✅ Red line in oversold zone (≤30)
✅ White line in neutral range (30–70)
Includes reference lines at 70, 50, and 30 for quick decision-making. Perfect for spotting momentum extremes, divergences, and potential reversal points without squinting at numbers. Works on any timeframe.


✅ BACKTEST: UT Bot + RSIRSI levels widened (60/40) — more signals.
Removed ATR volatility filter (to let trades fire).
Added inputs for TP and SL using ATR — fully dynamic.
Cleaned up conditions to ensure alignment with market structure.


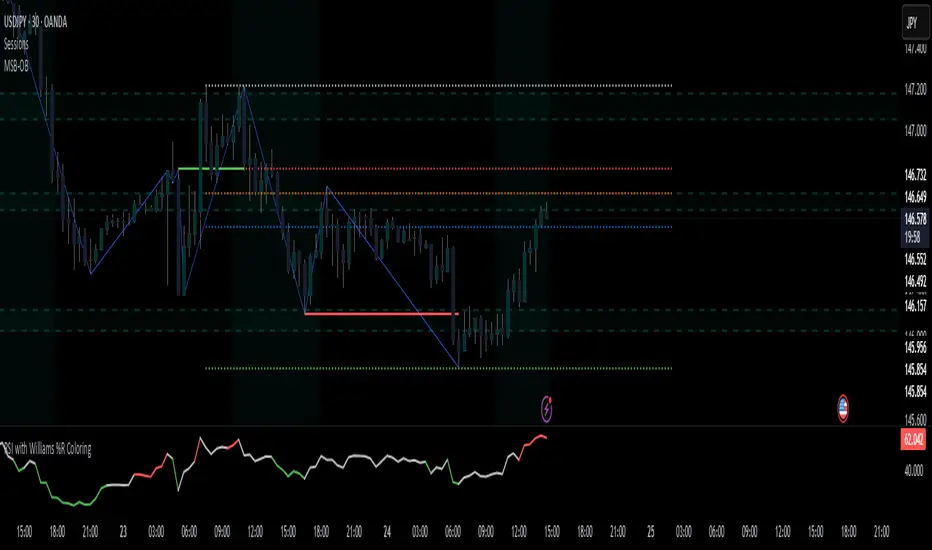
RSI with Williams %R Coloringsimple fusion of RSI to seek divergence and williams % R coloring to see overbought/oversold price.
not my own work, just merely took two standard indicators and infused them.
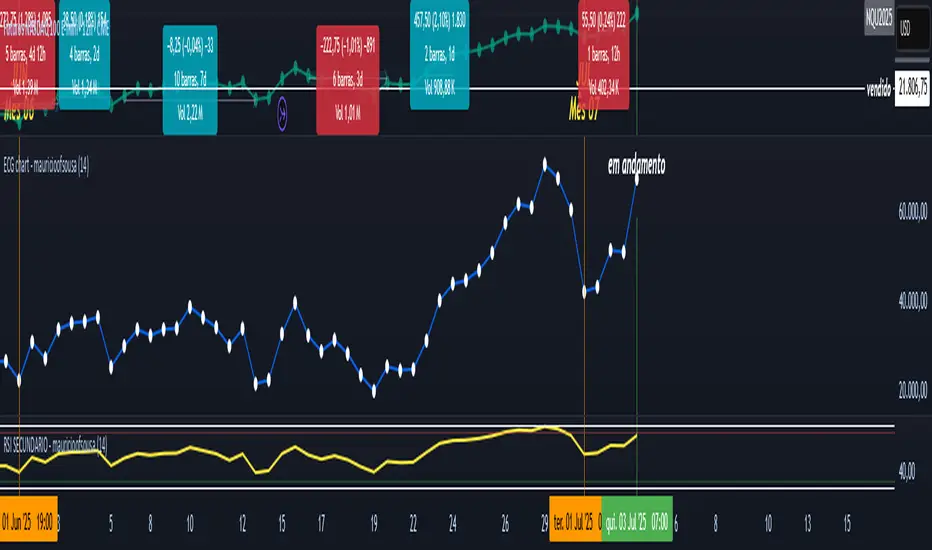
RSI - PRIMARIO -mauricioofsousa
MGO Primary – Matriz Gráficos ON
The Blockchain of Trading applied to price behavior
The MGO Primary is the foundation of Matriz Gráficos ON — an advanced graphical methodology that transforms market movement into a logical, predictable, and objective sequence, inspired by blockchain architecture and periodic oscillatory phenomena.
This indicator replaces emotional candlestick reading with a mathematical interpretation of price blocks, cycles, and frequency. Its mission is to eliminate noise, anticipate reversals, and clearly show where capital is entering or exiting the market.
What MGO Primary detects:
Oscillatory phenomena that reveal the true behavior of orders in the book:
RPA – Breakout of Bullish Pivot
RPB – Breakout of Bearish Pivot
RBA – Sharp Bullish Breakout
RBB – Sharp Bearish Breakout
Rhythmic patterns that repeat in medium timeframes (especially on 12H and 4H)
Wave and block frequency, highlighting critical entry and exit zones
Validation through Primary and Secondary RSI, measuring the real strength behind movements
Who is this indicator for:
Traders seeking statistical clarity and visual logic
Operators who want to escape the subjectivity of candlesticks
Anyone who values technical precision with operational discipline
Recommended use:
Ideal timeframes: 12H (high precision) and 4H (moderate intensity)
Recommended assets: indices (e.g., NASDAQ), liquid stocks, and futures
Combine with: structured risk management and macro context analysis
Real-world performance:
The MGO12H achieved a 92% accuracy rate in 2025 on the NASDAQ, outperforming the average performance of major global quantitative strategies, with a net score of over 6,200 points for the year.
RSI + MACD + Liquidity FinderLiquidity Finder: The liquidity zones are heuristic and based on volume and swing points. You may need to tweak the volumeThreshold and lookback to match the asset's volatility and timeframe.
Timeframe: This script works on any timeframe, but signals may vary in reliability (e.g., higher timeframes like 4H or 1D may reduce noise).
Customization: You can modify signal conditions (e.g., require only RSI or MACD) or add filters like trend direction using moving averages.
Backtesting: Use TradingView's strategy tester to evaluate performance by converting the indicator to a strategy (replace plotshape with strategy.entry/strategy.close).

RSI DeviationAn oscillator which de-trends the Relative Strength Index. Rather, it takes a moving average of RSI and plots it's standard deviation from the MA, similar to a Bollinger %B oscillator. This seams to highlight short term peaks and troughs, Indicating oversold and overbought conditions respectively. It is intended to be used with a Dollar Cost Averaging strategy, but may also be useful for Swing Trading, or Scalping on lower timeframes.
When the line on the oscillator line crosses back into the channel, it signals a trade opportunity.
~ Crossing into the band from the bottom, indicates the end of an oversold condition, signaling a potential reversal. This would be a BUY signal.
~ Crossing into the band from the top, indicates the end of an overbought condition, signaling a potential reversal. This would be a SELL signal.
For ease of use, I've made the oscillator highlight the main chart when Overbought/Oversold conditions are occurring, and place fractals upon reversion to the Band. These repaint as they are calculated at close. The earliest trade would occur upon open of the following day.
I have set the default St. Deviation to be 2, but in my testing I have found 1.5 to be quite reliable. By decreasing the St. Deviation you will increase trade frequency, to a point, at the expense of efficiency.
Cheers
DJSnoWMan06

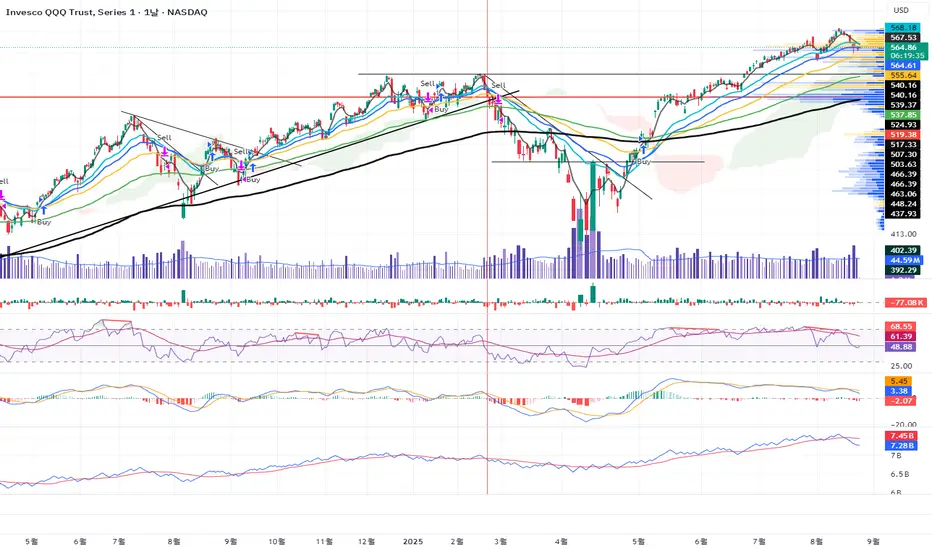
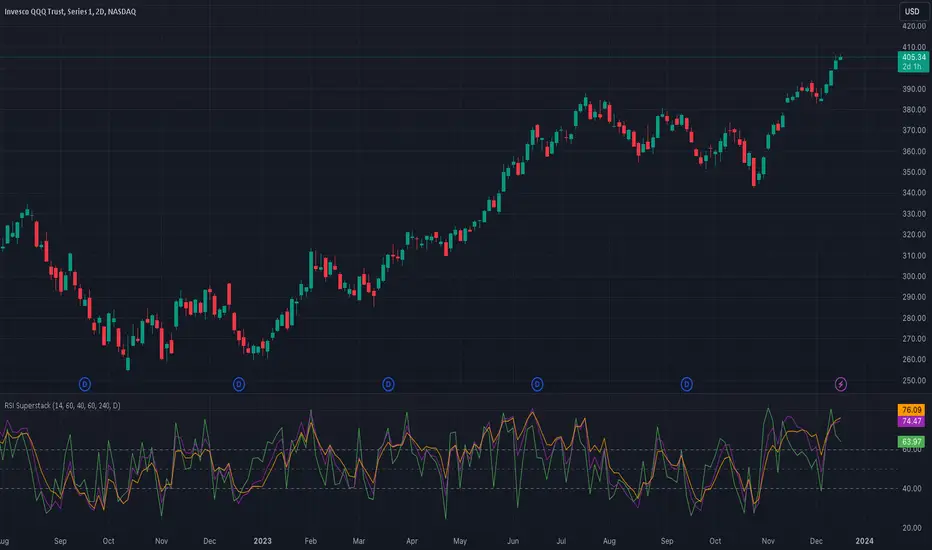
RSI SuperstackThis script integrates three Relative Strength Index (RSI) indicators across multiple time frames, providing a comprehensive overview of oversold and overbought conditions. This holistic approach enhances the precision of entry and exit points on shorter time frames.
As a momentum indicator, the Relative Strength Index assesses a security's strength during upward and downward price movements within the specified time period.
In a broader context, an upward slope in all indicators (green, purple, and orange) signifies an increasing market momentum, suggesting a potential continuation of the upward trend.
More specifically, a collective upward slope reaching or surpassing the 40 level in all indicators serves as a buy signal. Conversely, a uniform downward slope descending to or below the 60 level in all indicators constitutes a sell signal.
The default time frames for analysis include:
- 1 Hour (1H)
- 4 Hours (4H)
- Daily (D)
It is imperative to note that this indicator should not serve as the sole determinant for initiating long or short positions. Instead, it is recommended to consider it as part of a broader analysis, incorporating factors such as trend analysis and significant support levels.
Disclaimer: The utilization of this indicator should complement a comprehensive analysis and not be solely relied upon for decision-making regarding long or short positions.
RSI + FIB HH LL StopLoss Finder/Contrarian TradesThis indicator is a multi-timeframe indicator that works in any timeframe.
It takes a price reading of the highest or lowest bar in the past based on Fibonacci numbers and plots it.
In addition, the RSI smoothed by a 5-day moving average can be used to detect signs that previous highs or lows will be reached in advance.
This gives insight into determining stop-loss values or entering the market in a contrarian manner.
This is an example of BTCUSDT 4Hour Chart
Here is BTCUSDT 1Hour Chart
For scalpers BTCUSDT 15min Chart Example
Fibonacci Number is 1, 1, 2, 3, 5, 8, 13, 21, 34, 55, 89, 144, 233, 377, 610, 987, 1597, ...
FIbonacci Ratio is 0.236, 0.382, 0.5, 0.618, 1, 1.618, 2.618, 4.236, ...

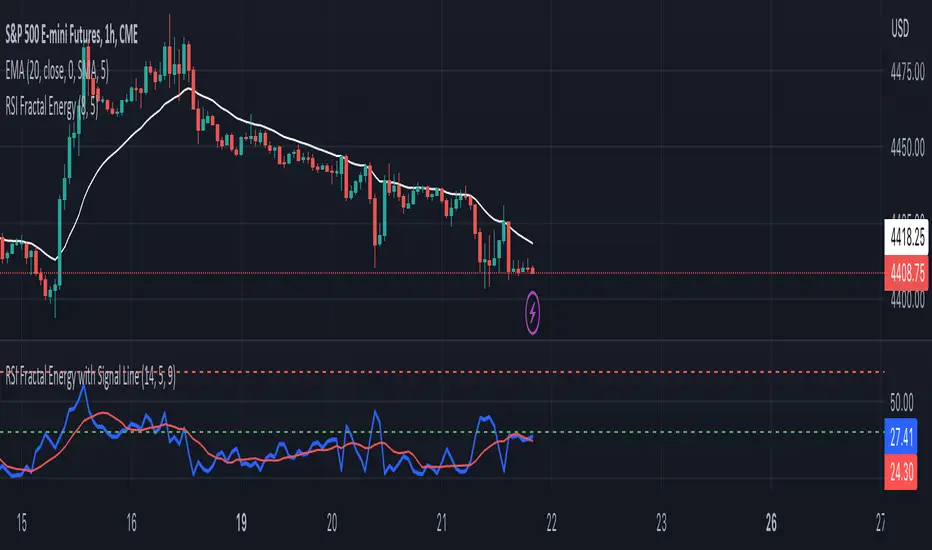
RSI Fractal Energy with Signal LineHere is my second script.
Introducing the RSI Fractal Energy Indicator.
This incorporates the Relative-Strength Index and Fractal Energy as the name implies.
This will help the trader identify:
1. Trend Strength: The higher the value of the indicator can indicate the strength of the trend and vice versa.
2. Reversal points: If the indicator is showing weakness and the market is making higher highs and lower lows this can indicate a reversal is possible.
3. Overbought and Oversold conditions: This indicator is currently set to 30(Oversold) and 70(Overbought), but this can be changed in the source code.
I also added a signal line to provide bullish/bearish crossovers.
I use this indicator on the 1 hr chart, but it can be used on any time frame.
Please let me know if you have any questions, comments, or concerns. Always open to learning more.
I will also provide updates as I continue to use my indicators.
Happy trading!
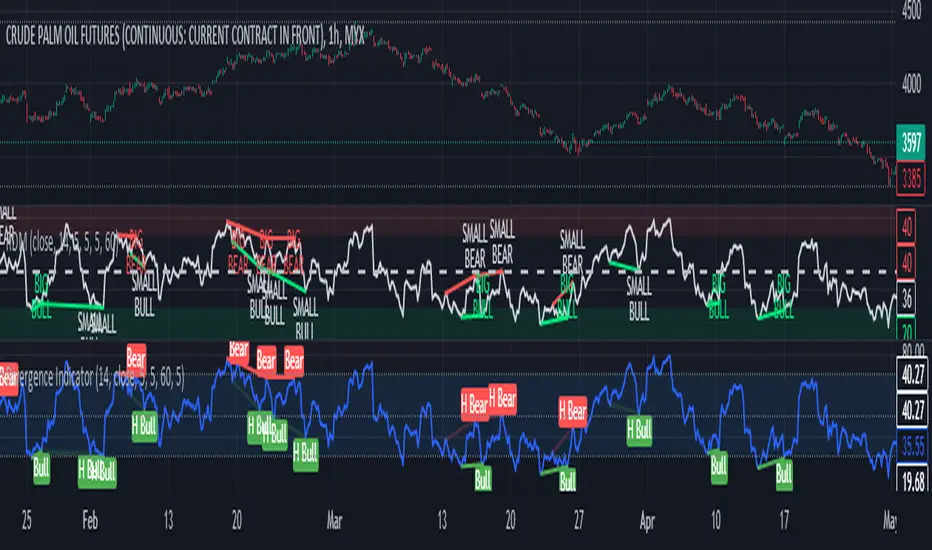
RSI Divergence Method█ OVERVIEW
This is a divergence indicator based on Relative Strength Index (RSI).
My attempt to make this indicator updated based on latest pine script features such as type, object and method.
█ FEATURES
1. Color of plot and label is based on contrast color of chart background. Able to customize color from style menu.
2. Big divergence (Regular Divergence) is based on lime / red color.
3. Small divergence (Hidden Divergence) is based on contrast color of chart background.
█ EXAMPLES / USAGES