RSI Hybrid + EMA Cloud + Swings(15m/2H)RSI Hybrid + EMA Cloud (15m Trend + 2H Momentum)
A dual-timeframe trading system combining fast 15-minute trend structure with higher-timeframe 2-Hour momentum, volume and structural levels.
🧩 What This Indicator Does
This tool blends:
🔹 15m Trend (EMA Cloud) – 2 Points
EMA 7 vs 21 → Short trend
EMA 30 vs 74 → Long trend
Cloud shading highlights bullish/bearish alignment
Faster, intraday trend sensitivity
🔹 2H Momentum (RSI Hybrid) – 3 Points
RSI > 50
RSI > SMA(4)
RSI > SMA(12)
Gives short / medium / long momentum confirmation from the higher timeframe.
🔹 2H Volume Pressure – 1 Point
Volume vs 20-SMA
Mild / Moderate / Strong Bull/Bear
Confirms true participation behind price moves
⭐ Score System (0–6 Total)
Component Points
15m EMA Trend 2
2H RSI Hybrid 3
2H Volume Power 1
Total 6
Interpretation:
5–6 → High-confluence direction
3–4 → Partial confluence
1–2 → Weak bias
0 → No reliable direction
Designed for discretionary and semi-systematic intraday traders.
📊 15m Structural Levels
Includes:
✔ Last confirmed 15m Swing High / Swing Low
Based on close-price pivots, not highs/lows.
✔ Live Running High since last Swing LOW
Tracks how far price has extended upward.
✔ Live Running Low since last Swing HIGH
Tracks downward extension after a swing high.
✔ ATR(15m)
Volatility reference for SL/TP or risk modeling.
These levels help in timing entries, managing stops, and identifying breakout/breakdown zones.
🖥 On-Chart Info Table
Summarizes:
15m EMA short & long trend
2H RSI short/medium/long momentum
RSI vs 50
2H volume power
Bull & Bear score (with breakdown)
Last 15m swing highs/lows
ATR(15m)
Color-coded for clarity
💡 Why Use This Indicator
High-speed 15m trend detection
Higher-TF 2H momentum & volume confirmation
Multi-layered bias presented in a simple score
Built-in structure for more intelligent entries/exits
Works on indices, stocks, FX, crypto
Ideal for intraday traders who want speed + reliability
Cerca negli script per "rsi"

RSI-GringoRSI-Gringo — Stochastic RSI with Advanced Smoothing Averages
Overview:
RSI-Gringo is an advanced technical indicator that combines the concept of the Stochastic RSI with multiple smoothing options using various moving averages. It is designed for traders seeking greater precision in momentum analysis, while offering the flexibility to select the type of moving average that best suits their trading style.
Disclaimer: This script is not investment advice. Its use is entirely at your own risk. My responsibility is to provide a fully functional indicator, but it is not my role to guide how to trade, adjust, or use this tool in any specific strategy.
The JMA (Jurik Moving Average) version used in this script is a custom implementation based on publicly shared code by TradingView users, and it is not the original licensed version from Jurik Research.
What This Indicator Does
RSI-Gringo applies the Stochastic Oscillator logic to the RSI itself (rather than price), helping to identify overbought and oversold conditions within the RSI. This often leads to more responsive and accurate momentum signals.
This indicator displays:
%K: the main Stochastic RSI line
%D: smoothed signal line of %K
Upper/Lower horizontal reference lines at 80 and 20
Features and Settings
Available smoothing methods (selectable from dropdown):
SMA — Simple Moving Average
SMMA — Smoothed Moving Average (equivalent to RMA)
EMA — Exponential Moving Average
WMA — Weighted Moving Average
HMA — Hull Moving Average (manually implemented)
JMA — Jurik Moving Average (custom approximation)
KAMA — Kaufman Adaptive Moving Average
T3 — Triple Smoothed Moving Average with adjustable hot factor
How to Adjust Advanced Averages
T3 – Triple Smoothed MA
Parameter: T3 Hot Factor
Valid range: 0.1 to 2.0
Tuning:
Lower values (e.g., 0.1) make it faster but noisier
Higher values (e.g., 2.0) make it smoother but slower
Balanced range: 0.7 to 1.0 (recommended)
JMA – Jurik Moving Average (Custom)
Parameters:
Phase: adjusts responsiveness and smoothness (-100 to 100)
Power: controls smoothing intensity (default: 1)
Tuning:
Phase = 0: neutral behavior
Phase > 0: more reactive
Phase < 0: smoother, more delayed
Power = 1: recommended default for most uses
Note: The JMA used here is not the proprietary version by Jurik Research, but an educational approximation available in the public domain on TradingView.
How to Use
Crossover Signals
Buy signal: %K crosses above %D from below the 20 line
Sell signal: %K crosses below %D from above the 80 line
Momentum Strength
%K and %D above 80: strong bullish momentum
%K and %D below 20: strong bearish momentum
With Trend Filters
Combine this indicator with trend-following tools (like moving averages on price)
Fast smoothing types (like EMA or HMA) are better for scalping and day trading
Slower types (like T3 or KAMA) are better for swing and long-term trading
Final Tips
Tweak RSI and smoothing periods depending on the time frame you're trading.
Try different combinations of moving averages to find what works best for your strategy.
This indicator is intended as a supporting tool for technical analysis — not a standalone decision-making system.

Daksh RSI POINT to ShootHere are the key points and features of the Pine Script provided:
### 1. **Indicator Settings**:
- The indicator is named **"POINT and Shoot"** and is set for non-overlay (`overlay=false`) on the chart.
- `max_bars_back=4000` is defined, indicating the maximum number of bars that the script can reference.
### 2. **Input Parameters**:
- `Src` (Source): The price source, default is `close`.
- `rsilen` (RSI Length): The length for calculating RSI, default is 20.
- `linestylei`: Style for the trend lines (`Solid` or `Dashed`).
- `linewidth`: Width of the plotted lines, between 1 and 4.
- `showbroken`: Option to show broken trend lines.
- `extendlines`: Option to extend trend lines.
- `showpivot`: Show pivot points (highs and lows).
- `showema`: Show a weighted moving average (WMA) line.
- `len`: Length for calculating WMA, default is 9.
### 3. **RSI Calculation**:
- Calculates a custom RSI value using relative moving averages (`ta.rma`), and optionally uses On-Balance Volume (`ta.obv`) if `indi` is set differently.
- Plots RSI values as a green or red line depending on its position relative to the WMA.
### 4. **Pivot Points**:
- Utilizes the `ta.pivothigh` and `ta.pivotlow` functions to detect pivot highs and lows over the defined period.
- Stores up to 10 recent pivot points for highs and lows.
### 5. **Trend Line Drawing**:
- Lines are drawn based on pivot highs and lows.
- Calculates potential trend lines using linear interpolation and validates them by checking if subsequent bars break or respect the trend.
- If the trend is broken, and `showbroken` is enabled, it draws dotted lines to represent these broken trends.
### 6. **Line Management**:
- Initializes multiple lines (`l1` to `l20` and `t1` to `t20`) and uses these lines for drawing uptrend and downtrend lines.
- The maximum number of lines is set to 20 for uptrends and 20 for downtrends, due to a limit on the total number of lines that can be displayed on the chart.
### 7. **Line Style and Color**:
- Defines different colors for uptrend lines (`ulcolor = color.red`) and downtrend lines (`dlcolor = color.blue`).
- Line styles are determined by user input (`linestyle`) and use either solid or dashed patterns.
- Broken lines use a dotted style to indicate invalidated trends.
### 8. **Pivot Point Plotting**:
- Plots labels "H" and "L" for pivot highs and lows, respectively, to visually indicate turning points on the chart.
### 9. **Utility Functions**:
- Uses helper functions to get the values and positions of the last 10 pivot points, such as `getloval`, `getlopos`, `gethival`, and `gethipos`.
- The script uses custom logic for line placement based on whether the pivots are lower lows or higher highs, with lines adjusted dynamically based on price movement.
### 10. **Plotting and Visuals**:
- The main RSI line is plotted using a color gradient based on its position relative to the WMA.
- Horizontal lines (`hline1` and `hline2`) are used for visual reference at RSI levels of 60 and 40.
- Filled regions between these horizontal lines provide visual cues for potential overbought or oversold zones.
These are the main highlights of the script, which focuses on trend detection, visualization of pivot points, and dynamic line plotting based on price action.

RSI Dashboard Monitor [Skiploss]RSI Dashboard Monitor is indicator for scanner Relative Strength Index ( RSI ) for 4 symbols and 10 Timeframe, detached from the main chart.
You can choose to display all 4 symbols or just 1 symbol, also can choose resolution (TF). Still, these 10 timeframes should be enough to use. Default is set to 14 but you can modify it from settings.
How it work??
RSI >= 75 : Fill color maximum overbought
RSI >= 65 : Fill color medium overbought
RSI >= 55 : Fill color minimum overbought
RSI >= 45 : Fill color minimum overbought
RSI >= 35 : Fill color medium overbought
RSI >= 25 : Fill color maximum overbought
** Values level and color style can modify it from settings

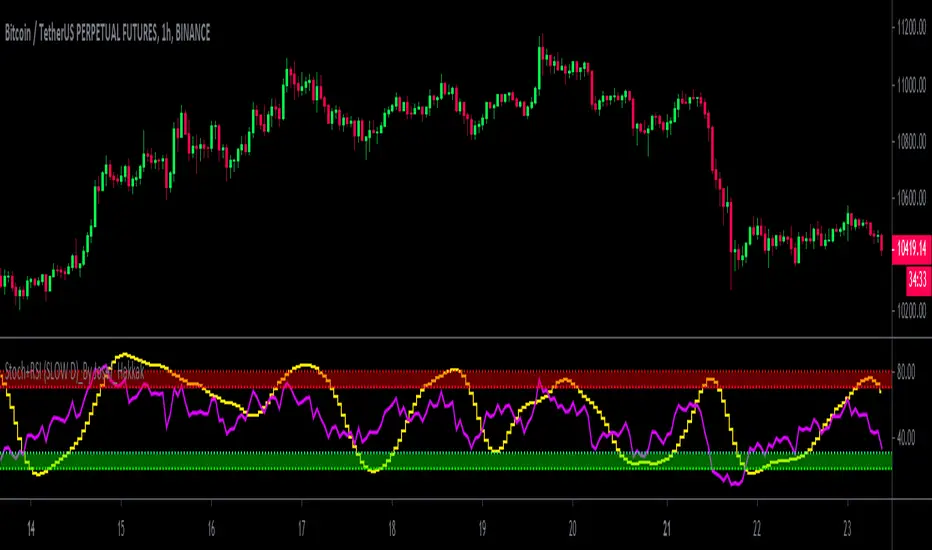
Stoch+RSI (SLOW D)_By Josef_HakkakStoch+RSI (SLOW D)_By Josef_Hakkak
Stochastic and RSI by SLOW D%
-> How to use:
B UY = When the yellow line (D of Slow Stoch ) goes out of the green range, it is better that the purple line ( RSI ) is be low
SELL = When the yellow line (D of Slow Stoch ) goes out of the red range, it is better to have the purple line ( RSI ) is be high
This script was previously written by RRanjanFX and has now been edited by me and changes have been made to optimize for shorter timeframes.
Edited and updated and optimized from:
RRanjanFX
Many thanks and loyal to RRanjanFX
RSI Cross OverRSI Cross Over is a clean, minimal RSI pane built on the same RSI engine as the RSI Directional Overlay.
How it works:
The indicator plots:
White RSI line
Orange signal line
Overbought / Oversold / Midline levels
Directional shading that matches the overlay:
Green Shading: ARSI > Signal
Light Green = ARSI below/near 50
Dark Green = ARSI above 50
Red Shading: ARSI < Signal
Light Red = ARSI above/near 50
Dark Red = ARSI below 50
This creates a clean, intuitive view of momentum strength and direction.
Why it’s useful:
Perfectly matches the Directional Overlay’s color logic
Shows momentum strength and transitions clearly
Removes all unnecessary features (no divergence, no pivots)
Ideal for confirming directional bias before entries
Helps avoid false signals by watching shading + midline behavior
Best setup:
Use together with RSI Directional Overlay
Light shading = early transition
Dark shading = strong directional conviction
Midline (50) acts as the “momentum gate”
Great for timing entries, exits, and avoiding chop
This indicator is built for traders who want a clean, disciplined RSI pane that aligns perfectly with price‑pane momentum signals.

RSI + Psy + ADX P2RSI + Psy + ADX
This indicator combines multi-length RSI analysis with the Psychological Line (PSY) and ADX trend strength to highlight reversal zones, emotional extremes, and trend conditions in a single unified panel.
🔹 Features
1️⃣ Triple RSI with Dynamic Colors
Displays Short / Mid / Long RSI values (9 / 26 / 52 by default)
Line color changes based on RSI levels:
🔴 Overbought (above 68)
🟢 Oversold (below 32)
⚪ Neutral market conditions
Fixed zone levels at 70 / 50 / 30 for simple visual analysis
2️⃣ Psychological Line (PSY) Extreme Signal
Measures the percentage of bearish candles in the selected period
Only highlights emotional extremes (overbought & oversold conditions)
Red/Green histogram makes market sentiment easy to read
3️⃣ ADX Trend Strength Detector
Confirms trend momentum using ADX
Color-coded levels:
🔵 Weak trend
🟡 Moderate trend
🔴 Strong trend (possible trend continuation)
Helps avoid counter-trend trades during strong momentum
4️⃣ RSI Background Highlight (Mid-term RSI Only)
Background turns RED in overbought area
Background turns GREEN in oversold area
Provides fast and clean recognition of reversal zones
🎯 Best Uses
Identifying low-risk reversal entry zones
Avoiding entries against strong trends
Confirming momentum and sentiment alignment
Useful for scalping, day-trading, and swing-trading strategies
💡 Tip
For higher precision, combine this indicator with:
🔹 Support/Resistance Levels
🔹 Candlestick Reversal Patterns
🔹 Volume Spikes or Breakout Tools

RSI + MACD Long-Only StrategyRSI + MACD Long-Only Strategy
Overview: Momentum-based, long-only strategy combining RSI and MACD. Entries favor upside momentum; exits trigger on momentum fades or risk targets. Signals are state-gated so you get one exit per entry (no multiple exits without a prior entry).
Entry conditions:
RSI crosses above the midline (default 50) while MACD is bullish (MACD > Signal, optionally MACD > 0), OR
MACD crosses above its Signal while RSI is at/above the midline.
Optional filters:
EMA trend filter: only enter if price > EMA(n).
Oversold context: only enter within N bars after RSI dipped below the oversold threshold.
Exit conditions:
RSI crosses below the midline, OR
MACD crosses below its Signal with MACD histogram ≤ 0.
Optional risk exit: Take Profit / Stop Loss based on percentage from average entry price.
Risk management:
Inputs: Use TP/SL (on/off), TP% (default 3.0), SL% (default 1.5).
Implements protective strategy.exit (limit/stop) while in position.
Signal-based exit uses strategy.close to flatten.
Position management:
Long-only, no pyramiding (single position at a time).
Internal state ensures entries occur only when flat and exits only when in a position.
Inputs you can tune:
RSI: length, overbought, oversold, midline.
MACD: fast length, slow length, signal length; toggle “Require MACD > 0”.
Signals: oversold lookback window; EMA trend on/off and EMA length.
Risk: TP% and SL%.
Visuals: show entry/exit markers, bar coloring; optional debug background on raw triggers.
Visuals and alerts:
Plots EMA (optional), draws entry/exit markers, optional bar coloring, and a faint background on raw long triggers to aid tuning.
Alert conditions provided for entries and exits.
Notes:
Designed for bar-close evaluation; performance varies by symbol/timeframe—tune inputs accordingly.
Long-only; intended for trend-following momentum with basic risk control.
Not financial advice.

RSI, CCI, ADX Panel (Custom TF for Each)RSI, CCI, and ADX Combined – Multi-Timeframe, Fully Customizable Panel Indicator for TradingView
Overview
This Pine Script indicator integrates the Relative Strength Index (RSI), Commodity Channel Index (CCI), and Average Directional Index (ADX) into a single, clean panel for effortless technical analysis. Each indicator operates independently, with customizable length, smoothing, and time frame for maximum flexibility. Traders can now monitor momentum, trend strength, and overbought/oversold conditions across different time frames—all in one place.
Key Features
Independent Controls: Set length, smoothing (ADX), and time frame individually for each indicator via the settings panel.
Multi-Timeframe Support: Each oscillator (RSI, CCI, ADX) can be calculated on its own time frame, enabling nuanced inter-timeframe analysis.
Customizable Visualization: Adjust line color and thickness for each indicator to match your chart style.
Clean, Non-Overlay Display: All three indicators are plotted in a dedicated panel beneath the price chart, reducing clutter.
Reference Levels: Includes standard reference lines for oversold/overbought (RSI, CCI) and trend threshold (ADX) for quick visual cues.
Usage Ideas
Swing Trading: Compare short- and long-term momentum using different time frames for RSI, CCI, and ADX.
Trend Confirmation: Use ADX to filter RSI and CCI signals—only trade overbought/oversold conditions during strong trends.
Divergence Hunting: Spot divergences between time frames for early reversal signals.
Scalping: Set RSI and CCI to lower time frames for entry, while monitoring higher timeframe ADX for trend context.
How to Install
Paste the script into the Pine Editor on TradingView.
Add to chart. Adjust settings as desired.
Save as a template for quick reuse on any chart—all your custom settings will be preserved.
Customization
Edit lengths and time frames in the indicator’s settings dialog.
Toggle reference lines on/off as needed.
Fine-tune line appearance (color, thickness) for clarity.
Note:
This indicator does not provide automated buy/sell signals. It is a customizable analytical tool for manual or semi-automated trading. Use in combination with other technical or fundamental analysis for best results.
Combine Momentum, Trend, and Volatility—Seamlessly and Visually—With One Indicator.

RSI Divergence Pro+ VolumeRSI Divergence Pro+ Volume
What It Does:
RSI Divergence Pro+ Volume is a non-repainting indicator that helps traders spot potential bullish and bearish reversal zones using a classic technical analysis concept—RSI divergence—combined with advanced volume confirmation. The script highlights moments when price and RSI disagree, filtering for signals only when there is a significant volume spike, which helps reduce false positives in quiet or illiquid markets.
How It Works:
Bullish Divergence: Triggered when price makes a lower low but RSI forms a higher low, suggesting possible exhaustion in selling pressure.
Bearish Divergence: Triggered when price makes a higher high but RSI forms a lower high, signaling potential buying exhaustion.
Volume Confirmation: Signals only appear when trading volume exceeds a dynamic threshold (based on a user-defined moving average and multiplier), making alerts more reliable.
Visual Features: Customizable labels and optional gradient highlights mark the exact bars where divergence with volume confirmation occurs, making signals easy to see.
Alert System: Built-in alerts for both bullish and bearish divergences so traders can receive instant notifications.
How to Use:
Apply the script to any timeframe or liquid asset (15m–4H recommended for best results).
Watch for green “BULL↑” labels below bars (bullish divergence) and red “BEAR↓” labels above bars (bearish divergence).
Blue/violet background highlights confirm volume-verified signals.
Combine with your own risk management and confirmation tools for trade entries/exits.
Adjust lookback and volume settings to match your asset and style.
Originality & Usefulness:
This indicator stands out by combining traditional RSI divergence with advanced volume filtering, giving more credible and actionable reversal alerts. All logic is non-repainting and calculated on closed bars only. Settings are fully grouped and customizable, with professional visuals for clarity.
Limitations & Disclaimers:
Not every divergence results in a major reversal—use with other analysis.
More effective in trending or volatile markets; may produce more false signals in choppy/range conditions.
Signals are generated on bar close and do not repaint.
No indicator is a substitute for proper trading discipline and risk management.
BUY/SELL RSI FLIUX v1.0The "BUY/SELL RSI FLUX v1.0" indicator is designed to provide buy and sell signals based on the RSI (Relative Strength Index) and price action in relation to support and resistance levels. It overlays directly on the price chart and includes the following components:
- Support and Resistance Levels: Determined over a specified number of bars (lengthSR), these levels represent potential barriers where price action may stall or reverse.
- ATR (Average True Range): Used to measure market volatility. While it's calculated in the script, it's not visualized on the chart as per the latest modification.
- RSI: The RSI is calculated over a defined period (lengthRSI) and is used to identify overbought or oversold conditions. Buy signals are generated when the RSI is below the oversold threshold (rsiOversold) and the price is above the support level. Conversely, sell signals occur when the RSI is above the overbought threshold (rsiOverbought), the price is below the resistance level, and additionally, the price is below a long-term moving average, which acts as a trend filter.
- Long-Term Moving Average: This moving average is plotted to help identify the prevailing market trend. Sell signals are filtered based on the price's position in relation to this moving average.
- Buy/Sell Signals: Visual representations in the form of shapes are plotted below (for buy) or above (for sell) the price bars to indicate potential entry points.
By combining these elements, the indicator aims to provide high-probability trading signals that align with both the market's momentum and trend.

DW-RSI EMA with EMA of RSIThis is an RSI Oscillator with an EMA of the RSI for a signal line. The RSI line is Green when above the signal line and Red when below the signal line.
This does not use the traditional 30% / 70% over sold / over bought analysis. Therefore the levels are not shown.
The analysis is this:
When the RSI is above the signal line then price has a bullish bias.
When the RSI is below the signal line then price has a bearish bias.
I wrote use this for Forex Spot Currencies where I feel overbought and oversold may be less valid than it may be in other markets such as stocks.
As with all indicators, do not use as your sole reason to enter the market, but use with other indicators or price action signals to get a confluence of signals to confirm your entry.
I use it with an 8, 21 and 50 EMA to confirm entry and exit. I give it more weight for exits than I do for entries.

RSI with Visual Buy/Sell Setup | Corrective/Impulsive IndicatorRSI with Visual Buy/Sell Setup | 40-60 Support/Resistance | Corrective/Impulsive Indicator v2.15
|| RSI - The Complete Guide PDF ||
Modified Zones with Colors for easy recognition of Price Action.
Resistance @ downtrend = 60
Support @ uptrend = 40
Over 70 = Strong Bullish Impulse
Under 30 = Strong Bearish Impulse
Uptrend : 40-80
Downtrend: 60-20
--------------------
Higher Highs in price, Lower Highs in RSI = Bearish Divergence
Lower Lows in price, Higher Lows in RSI = Bullish Divergence
--------------------
Trendlines from Higher/Lower Peaks, breakout + retest for buy/sell setups.
###################
There are multiple ways for using RSI, not only divergences, but it confirms the trend, possible bounce for continuation and signals for possible trend reversal.
There's more advanced use of RSI inside the book RSI: The Complete Guide
Go with the force, and follow the trend.
"The Force is more your friend than the trend"

RSI Momentum & Trend Suite - O59 Elite QuantRSI Momentum & Trend Suite – O59 Elite Quant
Professional Market Structure & Momentum Analysis Tool
RSI Momentum & Trend Suite – O59 Elite Quant is a comprehensive technical analysis indicator designed to help traders better understand market momentum, trend structure, price reactions, and key support & resistance zones directly on the chart.
This indicator combines RSI-based momentum analysis, dynamic bar coloring, price action signals, and automatic trend & support/resistance detection into a single, clean visual framework.
🔹 Momentum & Bar Coloring Logic
The indicator includes a custom RSI momentum engine that evaluates short-term price changes and momentum strength.
Candles are automatically colored when momentum reaches critical zones:
Above 70 → Strong bullish momentum
Below 30 → Strong bearish momentum
This candle coloring helps traders instantly recognize momentum extremes without switching to a separate RSI pane.
🔺 Buy & Sell Triangle Signals
The script generates triangle-based buy and sell signals based on a combination of:
RSI oversold / overbought conditions
Short-term price action behavior
Candle structure and confirmation logic
These signals are intended to highlight potential reaction zones, not to predict the market.
They work best when used together with trend direction and support/resistance levels.
📈 Automatic Trend Detection
The indicator automatically identifies ascending and descending trend structures using pivot-based swing analysis.
Trendlines are drawn dynamically based on higher lows and lower highs
Broken trendlines are automatically removed to keep the chart clean
Both bullish and bearish trends are visually distinguished
This allows traders to quickly assess whether the market is trending or losing structure.
🟦 Dynamic Support & Resistance Levels
Key support and resistance levels are detected using recent pivot points:
Levels extend forward in real time
Broken levels are removed automatically
Helps identify potential reaction, rejection, and liquidity zones
These levels are designed to adapt continuously as market structure evolves.
🧾 Information Table & Visual Themes
A customizable information table is displayed on the chart, showing:
Indicator name
Current symbol
Active timeframe
Author branding
Users can choose between multiple visual themes, allowing better readability and personal preference while maintaining a professional appearance.
⚠️ Important Notes & Risk Disclaimer
This indicator is designed as a technical analysis support tool only.
It does not provide financial advice
Signals and visual elements should not be used alone
Always confirm signals with your own strategy, risk management, and market context
⚠️ Special caution is advised during:
Low-volume sessions
Weekend price action
High-impact news events
Thin liquidity hours
Market conditions during these periods may produce false signals or reduced reliability.
📌 Final Disclaimer
This indicator is for educational and analytical purposes only.
It is not investment advice.
All trading decisions remain the sole responsibility of the use

VCAI Stochastic RSI+VCAI Stoch RSI+ is a cleaned-up Stochastic RSI built with V-Core colours for faster, clearer momentum reads and more reliable OB/OS signals.
What it shows:
Purple %K line → bearish momentum strengthening
Yellow %D line → bullish momentum building and smoothing
Soft purple/yellow background bands → OB/OS exhaustion zones, not just raw 80/20 triggers
Midline at 50 → balance point where momentum shifts between bull- and bear-side control
Optional HTF mode → run Stoch RSI from any timeframe while viewing it on your current chart
How to read it:
Both lines rising out of OS → early bullish shift; pullbacks that hold direction favour continuation
Both lines falling from OB → early bearish shift; bounces into the purple OB zone can become fade setups
Lines stacked and moving together → strong, cleaner momentum
Lines crossing repeatedly → low-conviction, choppy conditions
OB/OS shading highlights exhaustion so you focus on moves with context, not every 80/20 tick
Why it’s different:
Classic Stoch RSI is hyper-sensitive and mostly noise.
VCAI Stoch RSI+ applies V-Core’s colour-driven regime logic, controlled OB/OS shading, and optional HTF smoothing so you see momentum structure instead of clutter — making it easier to judge when momentum is genuinely shifting and when it’s just another wiggle.

RSI 20/80 Arrows + AlertsRSI 20/80 Arrows + Alerts
This indicator is a modified Relative Strength Index (RSI) tool designed to help traders spot potential overbought and oversold conditions using customizable threshold levels (default 80 for overbought, 20 for oversold).
Features:
Custom RSI Levels – Default to 80/20 instead of the standard 70/30, but fully adjustable by the user.
Visual Signals –
Blue Arrow Up appears below the bar when RSI crosses up from below the oversold level (potential buy zone).
Red Arrow Down appears above the bar when RSI crosses down from above the overbought level (potential sell zone).
Alerts Built In – Receive notifications when either signal occurs, with the option to confirm signals only on bar close for reduced noise.
Guide Levels – Optionally display overbought/oversold reference lines on the chart for quick visual reference.
Overlay Mode – Signals are plotted directly on the price chart, so you don’t need to switch between chart windows.
Use Case:
Ideal for traders who want quick, visual confirmation of potential turning points based on RSI, especially in strategies where more extreme levels (like 20/80) help filter out weaker signals. Works well across all markets and timeframes.

RSI Zones - Directional Entry Strict RSI Zones – Directional Entry Tool (Modified RSI)
This is a simple modification of the standard RSI indicator. I’ve added two custom horizontal lines at the 60–65 and 35–40 zones to help spot momentum shifts and potential reversal points.
60–65 zone: When RSI returns here from above 65, it often signals weakening bullish momentum — useful for spotting short opportunities.
35–40 zone: When RSI returns here from below 35, it can indicate momentum loss on the downside — good for potential long setups.
This version helps traders filter out weak signals and avoid chasing extreme moves.
It works best when combined with price action, structure, or divergence.
Only 2 lines were added to the default RSI for better zone awareness. Everything else remains unchanged.

RSI Convergence DivergenceRSI based oscillator inspired by the MACD.
Indicator that consists of two RSI calibrated at different lengths to take advantage of their convergence, divergence, overall direction, overall strength and several other metrics to extract signals from the price action.
This indicator includes:
- Fast RSI
- Slow RSI
- Signal line to identify convergence/divergence
- Simple moving average applied to the average of the two RSI
- DEMA applied to the average of the two RSI
- An average moving average of the SMA and DEMA
Some of the applications of this indicator:
- Simple convergence/divergence signaled by the moving average going above or below zero.
- Crossover between SMA and DEMA
- Combination of convergence/divergence and one of the 3 MAs reaching overbought or oversold threshold
- Average moving average going above or below 50
The combinations of different conditions are countless and limited only by the imagination of the user.
The visualization inputs, besides allowing to choose the candle coloring, give the user the ability to keep the chart clean and only see the signals he is interested into.

Negroni MA & RSI Strategy, plus trade entry and SL/TP optionsI will start with the context, and some things to think about when using a strategy tool to back-test ideas.
CONTEXT
FIRST: This is derived from other people's work, but I honestly hadn't found a mixed indicator MA strategy tool that does what this now does. If it is out there, apologies!!
This tool can help back-test various MA trends (SMA, EMA, HMA, VWMA); as well as factoring in RSI levels (or not); and can factor in a fixed HTF MA (or not). You can apply a 'retest entry' or a 'breakout entry', and you can also apply various risk mgt for SL/TP orders: 1) No SL/TP; or 2) a fixed %, or 3) dynamic ATR multipliers.
Find below, some details explaining what this tool is attempting to do.
Thank you, tack, salute!
THINGS TO REVIEW (it is not just about 'profitability'!!)
Whilst discretion is always highly encouraged as a trader, and a 100% indicator-driven strategy is VERY unlikely to yield sustainable results going forward, at the very least back-testing your strategies can help provide some guidance, not just on win rate Vs profit factor, but other things including:
a) Trade frequency: if a strategy has an 75% win rate and profit factor of 4, with all your parameters and confluence checks, but only triggers 3 trades every 5 years, is that realistically implementable to your trading situation if you have a $10,000 account?
b) Trade entry type: is it consistently better to wait for a retest of an 'MA zone', or is it better to market buy/sell on breakout of the 'MA zone'?
c) Risk management (SL/TP): is it consistently better to have a fixed static % for SL/TP ("I always place my stops 2% away, whether it is EURUSD or BTCUSDT"), or would you be better placed to try using an ATR multiplier of the respective assets?
d) Moving average type: is your old faithful 100 EMA really serving you well, or is the classic SMA more reliable, or how about the HMA, or the VWMA? Is the 100/200 cross holding up, or do you need something more sensitive? Is there any significant difference between a 10 EMA/20 EMA trend zone compared to a 13 EMA /25 EMA zone?
e) Confluence: Do added confluence checks (RSI, higher timeframe MA) actually improve profitability? But even if they do, is at the cost of cutting too many trades?
INPUTS AND PARAMETERS
Choice 1) Entry Strategy: Retest or Breakout - You can select both!
[ ]:
a) RETEST entry strat: price crosses UNDER FastMA INTO the 'MA trend zone'.
b) BREAKOUT entry strat: price crosses OVER FastMA OUT the 'MA trend zone'.
Choice 2) Risk Management (SL and TP) - You can select more than 1 strategy!
a) No SL/TP: Long trades are closed when the LOW crosses back UNDER the fastMA again, and shorts are closed when the HIGH crosses back OVER the fastMA again.
b) Static % SL/TP: Your SL/TP will be a fixed % away from avg. position price... WARNING: You should change this for various asset classes; FX vol is not the same as crypto altcoin vol!
c) Dynamic ATR SL/TP: Your SL/TP is a multiple of your selected ATR range (default is 50, see 'info' when you select ATR range). ATR accounts for the change in vol of different asset classes somewhat, HOWEVER... you should probably still not have the same multiplier trading S&P500 as you would trading crypto altcoins!
Then select your preferred parameters: EMA, SMA, HMA, VWMA, etc. You can mix and match, and most options have a info/tooltip guide.
RSI note: If you don't care for RSI levels, then set buy signal at 1... i.e always buys! Similarly set sell signal at 99.
ATR note: standard ATR length is usually 14, however... your SL/TP will move POST entry, and can tighten or widen your initial SL/TP... for better AND usually for worse! Go find a trade (strat 3) on the chart, look at the SL/TP lines, now change the number to 5, you'll see.
Fixed HTF MA note: If you don't care for HTF MA confluence, just change the timeframe/options to match the 'Slow MA' options you've chosen.

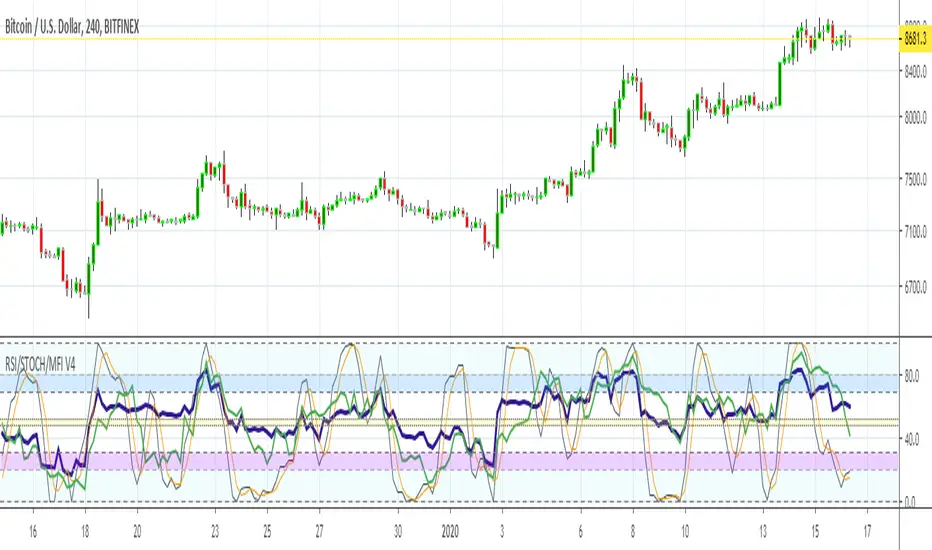
MFI RSI w STOCH OVERLAY V3Combines: Relative Strength (purple) and RSI Stoch (Orange/gray), Money Flow (green) all in one indicator window.
On screen indicator text identifier will read in this order: "RSI/STOCH/MFI V3"
// Changes from original version \\
It was important to bring forth the RSI indicator as the most visually important line and its relationship to the background.
A: Major visual changes from my first published one..as default now
1: Increased RSI line to size 3
2: Increased MFI line to size 2
3: Separated all Bar Line Fields in the background for custom editing, total of 5 now. Much easier to distinguish when the RSI enters these fields.
B: Other major changes as default now
1: Sped up the indicators from 14 to 11, for quicker response. (user can adjust back to 14 or another number)
2: Increased user friendly inputs to adjust colors, lines, data, etc.
3: (darken / lighten and change background colors, increase/decrease line strengths and colors, adjust field data inputs)
Enjoy and Good Luck Trading.
RSI Bands, RSI %B and RSI BandwidthRSI bands provide an intuitive way of visualizing how the price movement causes RSI to move with in its range (0-100). Upper/Lower bands signify overbought and oversold levels respectively (Default: 70/30, you can customize them via options page). These bands closely match what Constance Brown explains in her book "Technical Analysis for the Trading Professional".
I have also coded up 2 scripts to visualize %B and Bandwidth, just as in BollingerBands. As you can see %B is equivalent to the actual RSI. Along with RSI_Bandwidth and %B, the bands convey a lot of information.
Another tip is to render Bollinger Bands along with RSIBands...endless possibilities :)
I have included all 3 scripts in the same chart, as they are all related. Since TradingView doesn't allow sharing more than one script in the same chart, you can only "Add script" RSI Bands.
If you want to use RSI %B and Bandwidth, follow this guide to "Make mine" this chart and get access to the source:
drive.google.com
For the complete list of my indicators, check this post:

RSI Momentum SignalRSI Momentum Signal is a technical analysis indicator designed to highlight potential momentum-based reversal points using the Relative Strength Index (RSI).
This script combines short-term RSI momentum behavior with basic candle structure to visualize possible bullish and bearish reaction zones directly on the chart.
How It Works
A fast RSI-based momentum calculation is used to color price bars when short-term momentum reaches extreme levels.
Buy and Sell signals are generated when momentum conditions align with RSI overbought or oversold levels and basic candle direction.
All signals are plotted visually on the chart to support discretionary analysis.
Intended Use
This indicator is not a standalone trading system.
It is designed to be used as a supportive analytical tool together with other technical analysis methods such as trend structure, price action, and support/resistance levels.
Disclaimer
This script does not provide financial advice and does not guarantee any trading results.
All trading decisions remain the sole responsibility of the user.
Use this indicator for educational and analytical purposes only.

RSI(Min-Max)RSI (Min-Max) is an enhanced version of Welles Wilder's Relative Strength Index, designed to offer greater analytical precision and dynamic insight into the behavior of the RSI within each candlestick.In addition to displaying the traditional RSI value, this script calculates the possible extreme values — the minimum and maximum RSI — based on the low and high prices of the current candle. This allows you to estimate how the RSI would react if the price moved to the extremes of the bar, providing a predictive and refined reading of momentum.
