RSI scalpingLook for trending market on higher timeframe with ADX and SMA
Scalping with rsi shorter time frame
Cerca negli script per "scalp"
TSP Donchian EMADonchian with EMA
This show EMA of Donchain Channel (Highs and Lows)
It is nice to identify Support and Resistance, in range period
Should work well for scalp
This is a complement to Bollinger Bands
Big Snapper Alerts R2.0 by JustUncleLThis is a diversified Binary Option or Scalping Alert indicator originally designed for lower Time Frame Trend or Swing trading. Although you will find it a useful tool for higher time frames as well.
The Alerts are generated by the changing direction of the ColouredMA (HullMA by default), you then have the choice of selecting the Directional filtering on these signals or a Bollinger swing reversal filter.
The filters include:
Type 1 - The three MAs (EMAs 21,55,89 by default) in various combinations or by themselves. When only one directional MA selected then direction filter is given by ColouredMA above(up)/below(down) selected MA. If more than one MA selected the direction is given by MAs being in correct order for trend direction.
Type 2 - The SuperTrend direction is used to filter ColouredMA signals.
Type 3 - Bollinger Band Outside In is used to filter ColouredMA for swing reversals.
Type 4 - No directional filtering, all signals from the ColouredMA are shown.
Notes:
Each Type can be combined with another type to form more complex filtration.
Alerts can also be disabled completely if you just want one indicator with one colouredMA and/or 3xMAs and/or Bollinger Bands and/or SuperTrend painted on the chart.
Warning:
Be aware that combining Bollinger OutsideIn swing filter and a directional filter can be counter productive as they are opposites. So careful consideration is needed when combining Bollinger OutsideIn with any of the directional filters.
Hints:
For Binary Options try ColouredMA = HullMA(13) or HullMA(8) with Type 2 or 3 Filter.
When using Trend filters SuperTrend and/or 3xMA Trend, you will find if price reverses and breaks back through the Big Fat Signal line, then this can be a good reversal trade.
Some explanation about the what Hull Moving average and ideas of how the generated in Big Snapper can be used:
tradingsim.com
forextradingstrategies4u.com
Inspiration from @vdubus
Big Snapper's Bollinger OutsideIn Swing filter in Action:

Bollinger Awesome Alert R1 by JustUncleLThis indicator is an implementation of the Bollinger Band and Awesome Oscillator Scalping system.
This technique is for those who want the most simple method that is very effective. It is BEST traded during the busiest trading hours, 3am to 12am EST NY time. This method doesn't work in sideways markets, only in volatile trending markets.
Time Frames: 1, 5, 10, 15 ,30 min.
Currency pairs: majors.
Other Chart indicators:
Add Awesome Oscillator.
Optionally Add Squeeze Indicator.
Here's the strategy:
Going LONG:
Enter a long position when the black 3 EMA has crossed up through the Bollinger red middle band MA. At the same time, the Awesome should be approaching or crossing it's zeroline, going up. This is indicated by "Buy" alert.
Going SHORT:
Enter a short position when the black 3 EMA has crossed down through the Bollinger red middle band MA. At the same time, the Awesome should be approaching or crossing it's zero line, going down. This is indicated by the "Sell" Alert.
Take profit:
10-20 pips depending on pair or When Awesome Oscillator turns a different colour.
HINTS: Best trades tend to occur when price reversing bounce off outer band and outside the Optional Bollinger Squeeze indication.

RSI DivergenceThe code originally belongs to Matthew J. Slabosz, the founder of Zen Trading (The Art of Trading). ✍️📈
👉 My contribution and improvement was adding a divergence line directly on the RSI chart.
Why? Because most people can’t confirm correctness just by reading the code. 🧑💻❌
They need to see it with their own eyes 👀✔️ — this prevents misinterpretation and makes divergences crystal clear.
✨ By adding these visual confirmations, the efficiency and usability of the code has been significantly enhanced. 🚀📊

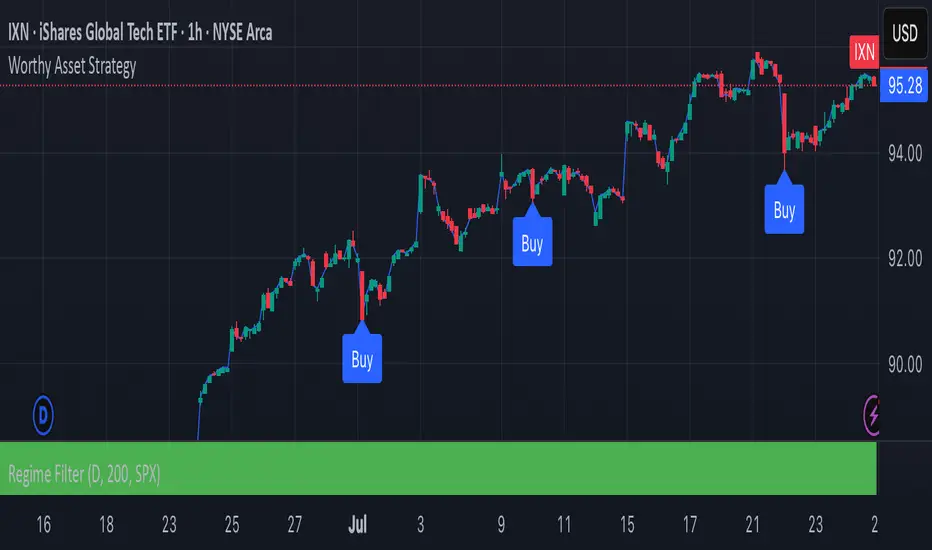
Worthy Asset StrategyThis strategy is designed with a two-part philosophy: a regime filter and a value-based accumulation approach.
🟩 Regime Filter:
If the S&P 500 (SPX) is trading above its 200-period EMA, a green background is shown below the chart, signaling a favorable market regime.
If the SPX is below the 200 EMA, the background turns red, indicating a less favorable environment.
📉 Buy Signals:
Buy signals are generated by red candles that drop a certain percentage from their open — essentially treating these pullbacks as discount opportunities.
The idea is to accumulate more of a selected asset when it becomes temporarily cheaper.
💎 Philosophy & Execution:
I only apply this strategy to assets I’ve personally researched and believe to be fundamentally valuable.
If a Buy signal occurs and the SPX is trading above its 200 EMA (i.e., the background is green), I enter the position.
Once in the trade, I follow this logic:
If the position reaches +1.5% profit, I sell it.
If it doesn’t reach profit and goes into a loss, I simply hold.
I don’t sell at a loss because I believe in the long-term value of the asset.
If the price drops further, I accumulate more — aiming to lower my average cost and eventually exit at a profit once the asset recovers.
This approach is based on the mindset of treating drawdowns as discounts, not danger.
"The more it drops, the more I accumulate — because I see value, not risk."
This is still a work in progress, and I’m actively refining it over time.
⚠️ Note: The sell logic is not yet visible on the chart and will be added in a future update.
Volume USDTName:
USDT Volume Bars (Directional Colors)
Description:
This indicator visualizes trading volume in USDT by multiplying the candle's volume by the average of its open and close prices. The result reflects a more realistic estimation of the traded value per candle.
🟩 Green bars: Bullish or neutral candles (close ≥ open)
🟥 Red bars: Bearish candles (close < open)
Useful for spotting high-value inflows and outflows based on actual price-weighted volume.


Swing Structure + Session Sweeps“Scalper-Friendly Trend & Sweep Detector”
Swing Structure + Session Sweeps with TEMA Cloud
This powerful all-in-one tool is designed for intraday traders, swing traders, and scalpers who want to spot high-probability reversals, trend continuations, and liquidity sweeps with confluence.
🔹 Core Features
Multi-layered TEMA Cloud (9, 20, 34, 50) for clear trend structure
Dynamic Bull/Bear labels when the trend flips
Centerline for TEMA 20 to visualize core trend direction
Session-based liquidity sweep detection (Asia, London, NY)
Volume and absorption dots to catch hidden pressure
Swing high/low detection (external and internal)
Visual VWAP, daily highs/lows, and customizable session zones
Optional alerts for volume spikes, absorption, and reversal sweeps
📈 Use it to:
Confirm directional bias
Anticipate pullbacks and breakouts
Identify volume-backed reversals
Align trades with session strength and swing confluence
⚙️ Built for scalpers, intraday opportunists, and precision chartists alike.

Trend+Volume Confluence IndicatorScalper and swing trading signals: use the 15–30 minute charts for scalps and the 4–8 hour charts for swings. Add the Money Flow Index (MFI) for extra confluence. In an uptrend, if the MFI is at or above the halfway mark and rising, take the long. In a downtrend, if the MFI is at or below the halfway mark and falling, take the short.

Scalper Pro - MA's and Bias - ChartThought I would share this for anybody interested. There is a table in the upper right and you can toggle the moving averages and table on and off as well. Happy Trading!


Scalp PRO Visual momentum through the candlestick pattern. Gradients to show acceleration and deceleration to assist with entry and exits. Different color settings and optimizations. Enjoy!

MOMENTUM FLIPPERScalp tops and bottom of big volatility moves.
Detects when momentum is shifting.
Look for clusters of dim arrows followed by a solid arrow or two.
Best on 2-3 minute chart.
Do not use when choppy.

Scalp Pin + Engulf (Ramesh)How to apply as indicator
In TradingView, open Pine Editor.
Select New → Blank indicator (or clear the editor).
Paste the entire script above.
Click Save, then Add to chart.
You should see:
Green triangles under bars = bullish pin bar at support with trend
Red triangles above bars = bearish pin at resistance with trend
“ENG” labels = engulfing confirmation after pin
From here we can re-add the “fast single-bar reversal” piece once this base version is confirmed working on your chart.


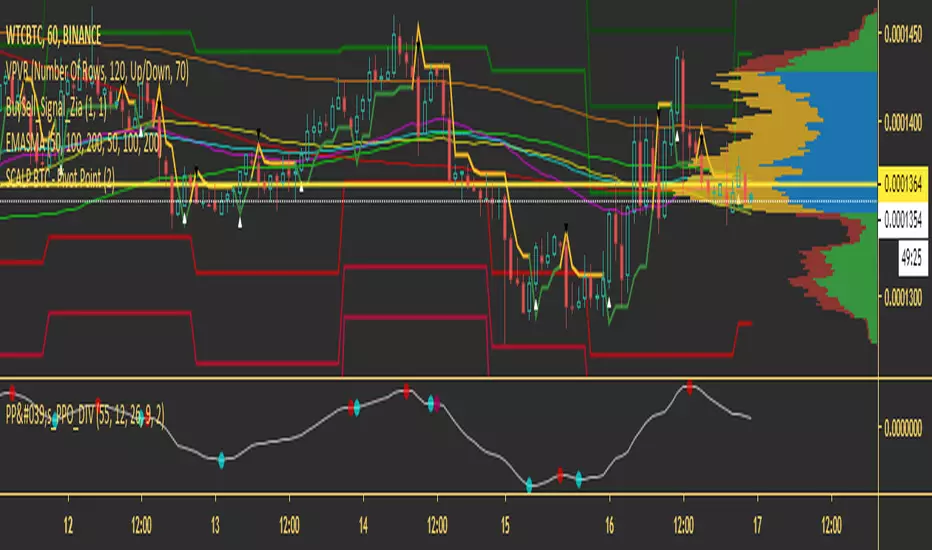
SCALP BTC - PPO DivergenceO indicador Oscilador de Preços (PPO) é uma ferramenta de análise técnica, usada para medir o momento que é muito semelhante ao MACD. O MACD emprega duas Médias Móveis de vários comprimentos (que são indicadores de atraso) para identificar a direção e a duração da tendência. Então, o MACD leva a diferença de valores entre essas duas Médias Móveis (Linha MACD) e uma EMA dessas Médias Móveis (Linha de Sinal) e plota a diferença entre as duas linhas como um histograma que oscila acima e abaixo de uma linha central zero.
O PPO é exatamente o mesmo, no entanto, ele pega os mesmos valores que o MACD e os calcula como uma porcentagem. O propósito disso é que ele torna as comparações de valor muito mais simples e diretas em períodos mais longos de tempo.