Triple EMA Scalper low lag stratHi all,
This strategy is based on the Amazing scalper for majors with risk management by SoftKill21
The change is in lines 11-20 where the sma's are replaced with Triple ema's to
lower the lag.
The original author is SoftKill21. His explanation is repeated below:
Best suited for 1M time frame and majors currency pairs.
Note that I tried it at 3M time frame.
Its made of :
Ema ( exponential moving average ) , long period 25
Ema ( exponential moving average ) Predictive, long period 50,
Ema ( exponential moving average ) Predictive, long period 100
Risk management , risking % of equity per trade using stop loss and take profits levels.
Long Entry:
When the Ema 25 cross up through the 50 Ema and 100 EMA . and we are in london or new york session( very important the session, imagine if we have only american or european currencies, its best to test it)
Short Entry:
When the Ema 25 cross down through the 50 Ema and 100 EMA , and we are in london or new york session( very important the session, imagine if we have only american or european currencies, its best to test it)
Exit:
TargetPrice: 5-10 pips
Stop loss: 9-12 pips
Cerca negli script per "scalp"

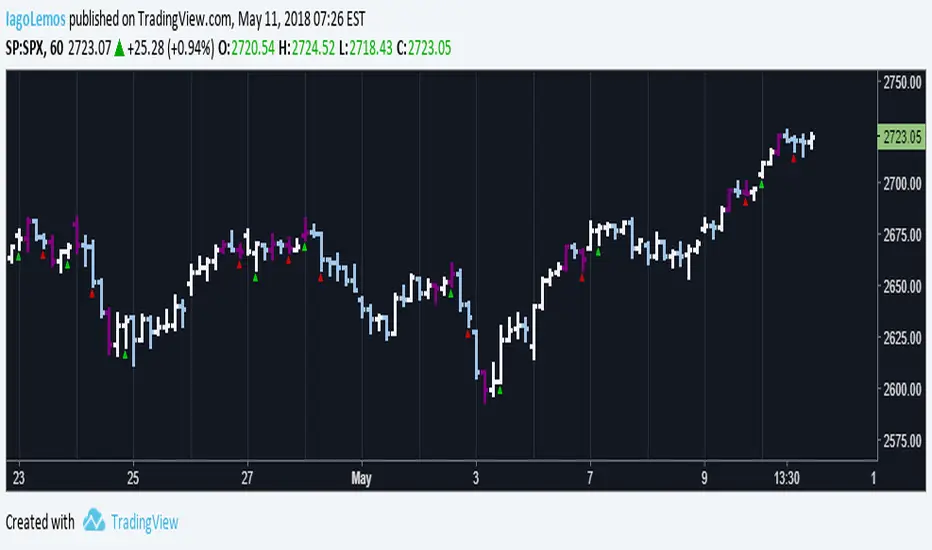
John Carter's Buy/Sell Scalper V2After a couple adjustments, double signals are now being ignore.
Here's how this script works:
Based entirely on a John Carter scalping setup, a candle will be painted purple if the next two closes are in a opposite direction of the past trend.
Green triangles indicates that the reversal is bullish, red triangles indicates that the reversal is bearish. Both are entry/exit points if you want to follow this set up.
Personally, I find this setup to work best in trending days, but it does a great job on choppy days if you use it as a confirmation.
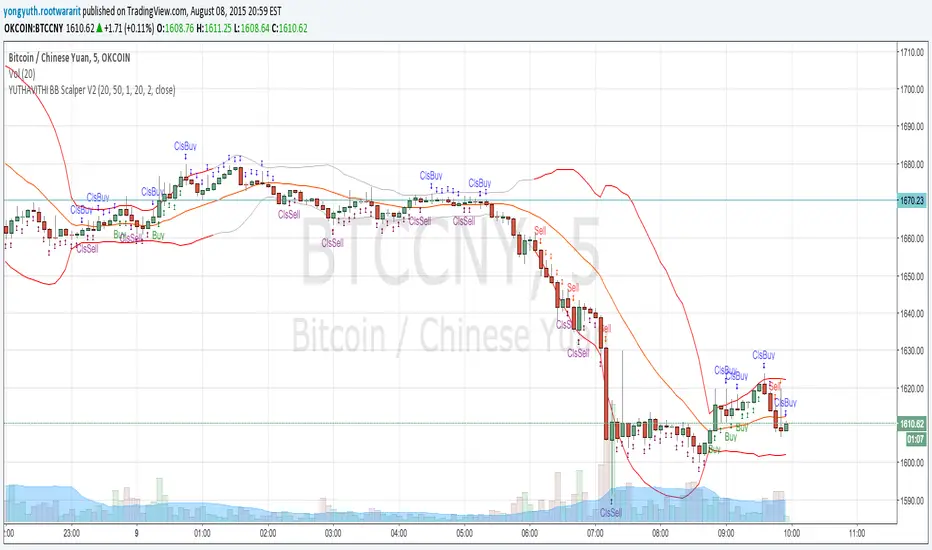
yuthavithi bb scalper V2This is a trend based BB scalper. I notice when the trend is fading and the price is going to leave the upper/lower band, the opposite band will stop expanding and turn back. This can serve as a good point for profit taking.
Like my previous force scalper, this scalper also use ATR to filter sideway period. It will provide buy/sell signal only when the price is trending.
sideway period is indicated by the silver upper/lower band, it does not trade during this period. but provide close signal instead.
Scalp Breakout Predictor Pro - by Herman Sangivera (Papua)Scalp Breakout Predictor Pro by Herman Sangivera ( Papuan Trader )
Overview
The Scalp Breakout Predictor Pro is a high-performance technical indicator designed for scalpers and day traders who thrive on market volatility. This tool specializes in identifying "Squeeze" phases—periods where the market is consolidating sideways—and predicts the likely direction of the upcoming breakout using underlying momentum accumulation.
How It Works
The indicator combines three core mathematical concepts to ensure "Safe but Fast" entries:
Squeeze Detection (BB vs. KC): It monitors the relationship between Bollinger Bands and Keltner Channels. When Bollinger Bands contract inside the Keltner Channels, the market is in a "Squeeze" (represented by the gray background). This indicates that energy is being coiled for a massive move.
Momentum Accumulation (Pre-Signal): While the price is still moving sideways, the script analyzes linear regression momentum.
PRE-BULL: Momentum is building upwards despite price being flat.
PRE-BEAR: Momentum is fading downwards despite price being flat.
Breakout Confirmation: An entry signal is only triggered when the Squeeze "fires" (the price breaks out of the bands), ensuring you don't get stuck in a dead market for too long.
Key Features
Real-time Prediction Labels: Get early warnings (PRE-BULL / PRE-BEAR) to prepare for the trade before it happens.
Dynamic TP/SL Lines: Automatically calculates Take Profit and Stop Loss levels based on the Average True Range (ATR), adapting to the current market's "breath."
On-Screen Dashboard: A sleek table in the top-right corner displays the current market phase (Squeeze vs. Volatile), the predicted next move, and the current ATR value.
Pine Script V6 Optimized: Built using the latest version of TradingView’s coding language for maximum speed and compatibility.
Trading Rules
Preparation: When you see a Gray Background, the market is sideways. Watch the Dashboard for the "Potential" direction.
Anticipation: If a PRE-BULL or PRE-BEAR label appears, get ready to enter.
Execution: Enter the trade when the ENTRY BUY (Lime Triangle) or ENTRY SELL (Red Triangle) signal appears.
Exit: Follow the Green Line for Take Profit and the Red Line for Stop Loss.
Technical Settings
HMA Length: Adjusts the sensitivity of the trend filter (Hull Moving Average).
TP/SL Multipliers: Allows you to customize your Risk:Reward ratio based on ATR volatility.
Squeeze Length: Determines the lookback period for consolidation detection.
Disclaimer: Scalping involves high risk. Always test this indicator on a demo account before using it with live capital.

9/15 EMA Scalper 9/15 EMA Scalper — by uzairbaloch
This script is a price-action based scalping system built around the 9 EMA and 15 EMA trend structure.
It identifies short-term reversal points where the market pulls back into the EMAs and confirms direction with a strong candle signal.
The strategy looks for:
• A clear EMA trend (9 above 15 for buys, 9 below 15 for sells)
• Pullback into EMA9/EMA15 with candle bodies touching the fast EMA
• Strong confirmation candle (engulfing / strong momentum / controlled wick)
• Optional slope filter to avoid flat, choppy sessions
• Automatic trade labels showing Entry, SL and TP (based on R:R)
The script is designed for scalping on gold, indices, and high-volatility FX pairs.
It resets trade logic immediately after SL or TP is hit, so it can catch the next valid signal without delay.
This tool is meant as an indicator — not a full strategy — and can be used to visually mark high-probability EMA pullback setups with precise levels.
Author: uzairbaloch

Adaptive Fractal Grid Scalping StrategyThis Pine Script v6 component implements an "Adaptive Fractal Grid Scalping Strategy" with an added volatility threshold feature.
Here's how it works:
Fractal Break Detection: Uses ta.pivothigh and ta.pivotlow to identify local highs and lows.
Volatility Clustering: Measures volatility using the Average True Range (ATR).
Adaptive Grid Levels: Dynamically adjusts grid levels based on ATR and user-defined multipliers.
Directional Bias Filter: Uses a Simple Moving Average (SMA) to determine trend direction.
Volatility Threshold: Introduces a new input to specify a minimum ATR value required to activate the strategy.
Trade Execution Logic: Places limit orders at grid levels based on trend direction and fractal levels, but only when ATR exceeds the volatility threshold.
Profit-Taking and Stop-Loss: Implements profit-taking at grid levels and a trailing stop-loss based on ATR.
How to Use
Inputs: Customize the ATR length, SMA length, grid multipliers, trailing stop multiplier, and volatility threshold through the input settings.
Visuals: The script plots fractal points and grid levels on the chart for easy visualization.
Trade Signals: The strategy automatically places buy/sell orders based on the detected fractals, trend direction, and volatility threshold.
Profit and Risk Management: The script includes logic for taking profits and setting stop-loss levels to manage trades effectively.
This strategy is designed to capitalize on micro-movements during high volatility and avoid overtrading during low-volatility trends. Adjust the input parameters to suit your trading style and market conditions.

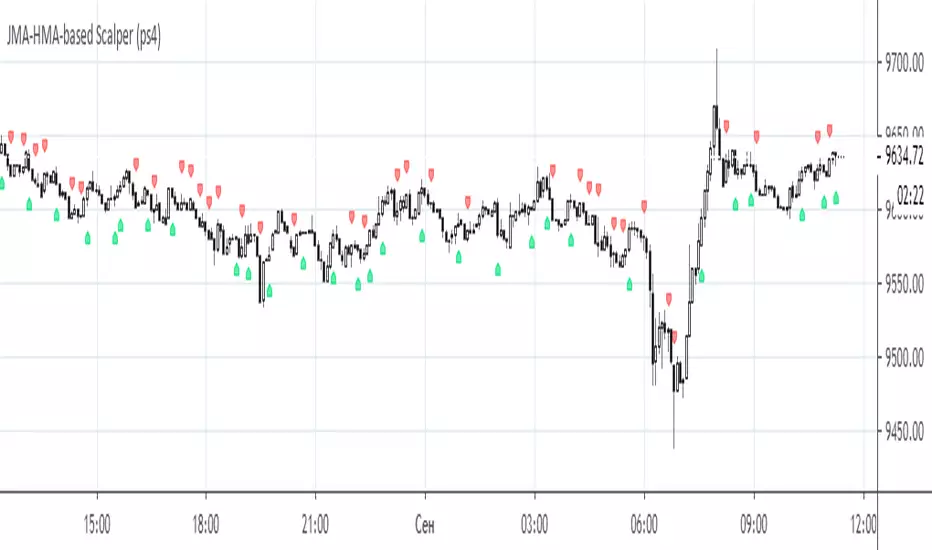
JMA-HMA-based Scalper (ps4)This is an old compilation of mine suitable for scalping. To filter out the generated signals use Difference value between on the Settings menu.
RSI & BB Oversold Scalper with MACD Confirmation [DotGain]RSI & BB Oversold Scalper with MACD Confirmation
The RSI & BB Oversold Scalper is a mean reversion / dip-buying indicator designed for traders who want to combine oversold conditions with momentum confirmation .
It uses a multi-step logic: first detect an oversold setup, then wait for a MACD confirmation within a defined time window before issuing a buy signal.
---
Core Concept
1. Detect an oversold setup using Bollinger Bands %b, RSI and an optional DSS filter
2. Keep the setup active for a limited number of candles
3. Trigger the entry using a MACD bullish crossover
4. Reset after entry to avoid multiple signals from the same setup
---
Buy Signal Logic
A buy signal is generated when the following conditions are met:
1. Oversold Setup (filters can be enabled/disabled individually)
• Bollinger Bands %b Oversold (Lookback-based)
The price has traded below the lower Bollinger Band at least once within the last `lookbackBB` candles.
• RSI Oversold (Lookback-based)
The RSI has dropped below 30 at least once within the last `lookbackRSI` candles.
• DSS (Double Smoothed Stochastic) Reversal Filter
A bullish crossover of the DSS line above its signal line while the DSS value is below 20 , indicating a potential momentum reversal from oversold conditions.
Note:
BB %b and RSI are lookback filters , while the DSS condition is a single-bar crossover event .
---
2. MACD Confirmation (Entry Timing)
After the setup becomes active, the indicator waits for a bullish MACD crossover (`MACD line crosses above Signal line`) within a user-defined time window (`validWindow` candles).
If the MACD confirmation occurs within this window, a buy signal is printed.
If the window expires without confirmation, the setup is discarded automatically.
---
Reset Logic
• After a buy signal, the setup is reset immediately
• Only one signal is allowed per setup
• No late entries after the time window expires
---
Inputs & Customization
• Enable or disable BB, RSI and DSS filters individually
• Adjust lookback periods to control how recent oversold conditions must be
• Tune the MACD confirmation window to balance early vs. conservative entries
Smaller windows = faster, more aggressive entries
Larger windows = fewer but more confirmed signals
Recommended Markets & Timeframes
• Cryptocurrencies, Forex, Indices, liquid stocks
• Best suited for 1m – 15m scalping
• Also usable on 15m – 1h for slower mean-reversion trades
Visuals
• Buy signals are displayed as labels below the price candles
Important Notes
• This indicator is a signal and timing tool , not a complete trading system
• Always combine with higher-timeframe trend, support/resistance or volume analysis
• Backtesting and paper trading are strongly recommended
Disclaimer:
This "RSI & BB Oversold Scalper with MACD Confirmation" (Oversold Scalper) indicator is provided for informational and educational purposes only. It does not, and should not be construed as, financial, investment, or trading advice.
The signal generated by this tool (Green) is the result of a specific set of algorithmic conditions. They are not a direct recommendation to buy or sell any asset. The indicator's purpose is to highlight possible weakness in the markets, not to provide infallible trade signals.
All trading and investing in financial markets involves a substantial risk of loss. You can lose all of your invested capital.
Past performance is not indicative of future results. Even an indicator designed to filter out "chop" may produce false, lagging, or losing signals. Markets can remain unpredictable longer than you can remain solvent.
The creator DotGain assumes no liability for any financial losses or damages you may incur, directly or indirectly, as a result of using this indicator or the information it provides.
You are solely responsible for your own trading and investment decisions. Always conduct your own research (DYOR), validate signals with other methods, and consider your personal risk tolerance before entering any trade.

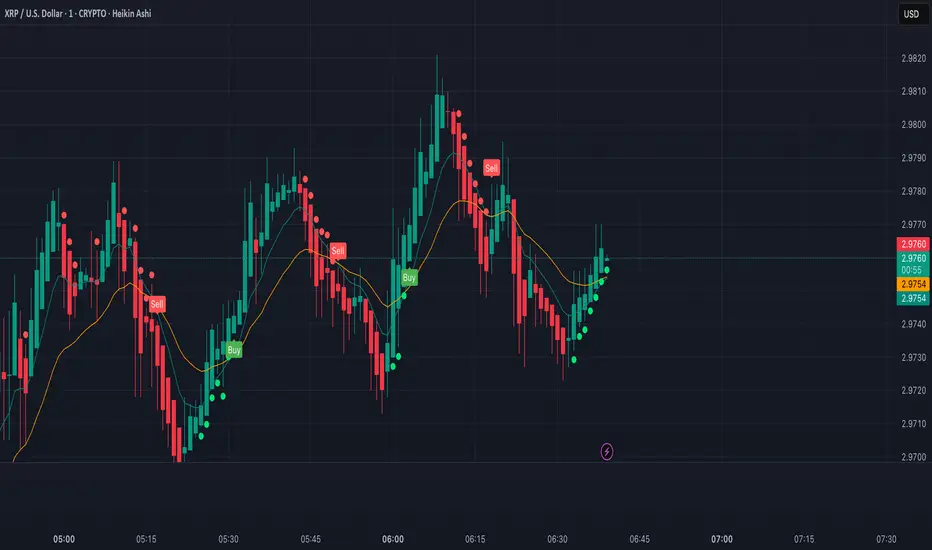
XRP Scalping with EMA Crossover Anticipation This script is designed to detect scalping opportunities on XRP by anticipating EMA crossovers, reinforced with technical confirmation filters.
Methodology
- The core signal is based on the crossover between a fast EMA (9) and a slow EMA (21).
- RSI (14) conditions are applied to avoid weak setups: RSI must be above 40 for buy signals and below 70 for sell signals.
- Before any crossover is validated, the script requires at least two consecutive “pre-crossover” signals. These indicate favorable momentum and convergence conditions before the crossover occurs.
- Final signals are only displayed if this minimum number of preconditions is met.
Application
This system is optimized for scalping on the 1-minute to 5-minute timeframes but can be adapted for longer-term setups by adjusting parameters. The anticipation logic helps reduce lagging entries and improves signal selectivity during volatile conditions.
Both pre-crossover and confirmed crossover conditions include alert options. The code is fully editable and customizable.
Session Breakout Scalper Trading BotHi Traders !
Introduction:
I have recently been exploring the world of automated algorithmic trading (as I prefer more objective trading strategies over subjective technical analysis (TA)) and would like to share one of my automation compatible (PineConnecter compatible) scripts “Session Breakout Scalper”.
The strategy is really simple and is based on time conditional breakouts although has more ”relatively” advanced optional features such as the regime indicators (Regime Filters) that attempt to filter out noise by adding more confluence states and the ATR multiple SL that takes into account volatility to mitigate the down side risk of the trade.
What is Algorthmic Trading:
Firstly what is algorithmic trading? Algorithmic trading also known as algo-trading, is a method of using computer programs (in this case pine script) to execute trades based on predetermined rules and instructions (this trading strategy). It's like having a robot trader who follows a strict set of commands to buy and sell assets automatically, without any human intervention.
Important Note:
For Algorithmic trading the strategy will require you having an essential TV subscription at the minimum (so that you can set alerts) plus a PineConnecter subscription (scroll down to the .”How does the strategy send signals” headings to read more)
The Strategy Explained:
Is the Time input true ? (this can be changed by toggling times under the “TRADE MEDIAN TIMES” group for user inputs).
Given the above is true the strategy waits x bars after the session and then calculates the highest high (HH) to lowest low (LL) range. For this box to form, the user defined amount of bars must print after the session. The box is symmetrical meaning the HH and LL are calculated over a lookback that is equal to the sum of user defined bars before and after the session (+ 1).
The Strategy then simultaneously defines the HH as the buy level (green line) and the LL as the sell level (red line). note the strategy will set stop orders at these levels respectively.
Enter a buy if price action crosses above the HH, and then cancel the sell order type (The opposite is true for a stop order).
If the momentum based regime filters are true the strategy will check for the regime / regimes to be true, if the regime if false the strategy will exit the current trade, as the regime filter has predicted a slowing / reversal of momentum.
The image below shows the strategy executing these trading rules ( Regime filters, "Trades on chart", "Signal & Label" and "Quantity" have been omitted. "Strategy label plots" has been switched to true)
Other Strategy Rules:
If a new session (time session which is user defined) is true (blue vertical line) and the strategy is currently still in a trade it will exit that trade immediately.
It is possible to also set a range of percentage gain per day that the strategy will try to acquire, if at any point the strategy’s profit is within the percentage range then the position / trade will be exited immediately (This can be changed in the “PERCENT DAY GAIN” group for user inputs)
Stops and Targets:
The strategy has either static (fixed) or variable SL options. TP however is only static. The “STRAT TP & TP” group of user inputs is responsible for the SL and TP values (quoted in pips). Note once the ATR stop is set to true the SL values in the above group no longer have any affect on the SL as expected.
What are the Regime Filters:
The Larry Williams Large Trade Index (LWLTI): The Larry Williams Large Trade Index (LWTI) is a momentum-based technical indicator developed by iconic trader Larry Williams. It identifies potential entries and exits for trades by gauging market sentiment, particularly the buying and selling pressure from large market players. Here's a breakdown of the LWTI:
LWLTI components and their interpretation:
Oscillator: It oscillates between 0 and 100, with 50 acting as the neutral line.
Sentiment Meter: Values above 75 suggest a bearish market dominated by large selling, while readings below 25 indicate a bullish market with strong buying from large players.
Trend Confirmation: Crossing above 75 during an uptrend and below 25 during a downtrend confirms the trend's continuation.
The Andean Oscillator (AO) : The Andean Oscillator is a trend and momentum based indicator designed to measure the degree of variations within individual uptrends and downtrends in the prices.
Regime Filter States:
In trading, a regime filter is a tool used to identify the current state or "regime" of the market.
These Regime filters are integrated within the trading strategy to attempt to lower risk (equity volatility and/or draw down). The regime filters have different states for each market order type (buy and sell). When the regime filters are set to true, if these regime states fail to be true the trade is exited immediately.
For Buy Trades:
LWLTI positive momentum state: Quotient of the lagged trailing difference and the ATR > 50
AO positive momentum state: Bull line > Bear line (signal line is omitted)
For Sell Trades:
LWLTI negative momentum stat: Quotient of the lagged trailing difference and the ATR < 50
AO negative momentum state: Bull line < Bear line (signal line is omitted)
How does the Strategy Send Signals:
The strategy triggers a TV alert (you will neet to set a alert first), TV then sends a HTTP request to the automation software (PineConnecter) which receives the request and then communicates to an MT4/5 EA to automate the trading strategy.
For the strategy to send signals you must have the following
At least a TV essential subscription
This Script added to your chart
A PineConnecter account, which is paid and not free. This will provide you with the expert advisor that executes trades based on these strategies signals.
For more detailed information on the automation process I would recommend you read the PineConnecter documentation and FAQ page.
Dashboard:
This Dashboard (top right by defualt) lists some simple trading statistics and also shows when a trade is live.
Important Notice:
- USE THIS STRATEGY AT YOUR OWN RISK AND ALWAYS DO YOUR OWN RESEARCH & MANUAL BACKTESTING !
- THE STRATEGY WILL NOT EXHIBIT THE BACKTEST PERFORMANCE SEEN BELOW IN ALL MARKETS !

Forex Scalping 1min Bollinger Bands, RSI and ADX Trading SystemThis is a Forex Scalping Trading Sytem based on the Bollinger Bands.
Its suited for major pairs, with lowest possible comission (below 1 pip) and with timeframes ranging between 1-15 min.
Indicators:
Bollinger bands
ADX
RSI
Rules for entry:
Long Entry: price to move below the upper Bollinger Bands RSI raise above the 30 line and ADX<32 at the same time.
Short Entry: price to move above the upper Bollinger Bands, RSI raise below the 70 line and ADX<32 at the same time.
Rules for exit
Profit Exit: 3 options: 1, exit position when the price touches the middle band, 2) when the price touches the opposite band, X pips target profit.
Loss Exit: X pips loss

SAR Volume ScalperSAR Volume Scalper is a minimalist intraday scalping indicator designed for 1–2 minute charts, optimized for high-liquidity markets such as NASDAQ (NQ) and Gold (GC).
The indicator combines Parabolic SAR price crossings with a neutral volume participation filter (Volume ≥ EMA(Volume)), ensuring that signals appear only when the market is active, without relying on rare or aggressive volume spikes.
🔑 Core Logic
Parabolic SAR identifies precise micro-trend shifts
Trend EMA filters directional bias and reduces counter-trend trades
Neutral volume filter confirms market participation while preserving signal frequency
ATR-based targets adapt automatically to current volatility
🎯 Designed For
High-frequency scalping on 1–2 minute timeframes
Manual trade execution during active market sessions
Traders who prefer price and flow confirmation over heavy indicator stacking
⚠️ Disclaimer
This indicator is a decision-support tool and should not be used as standalone trading advice.
It is not intended for fully automated trading.

Renko ScalperWhat it is-
A lightweight Renko Scalper that combines Renko brick direction with an internal EMA trend filter and MACD confirmation to signal high-probability short-term entries. EMAs are used internally (hidden from the chart) so the visual remains uncluttered.
Signals-
Buy arrow: Renko direction turns bullish AND EMA trend up AND MACD histogram positive.
Sell arrow: Renko direction turns bearish AND EMA trend down AND MACD histogram negative.
Consecutive same-direction signals are suppressed (only one arrow per direction until opposite signal).
Visuals-
Buy / Sell arrows (large) above/below bars.
Chart background tints green/red after the respective signal for easy glance recognition.
Inputs:-
Renko Box Size (points)
EMA Fast / EMA Slow
MACD fast/slow/signal lengths
How to use-
Add to chart
Use smaller Renko box sizes for scalping, larger for swing-like entries.
Confirm signal with price action and volume—this indicator is a signal generator, not a full automated system.
Use alerts (built in) to receive Buy / Sell arrow notifications.
Alerts-
Buy Arrow — buySignal
Sell Arrow — sellSignal
Buy Background / Sell Background — background-color state alerts
Recommended settings-
Timeframes: 1m–15m for scalping, 5m for balanced intraday.
Symbols: liquid futures/currency pairs/major crypto.
Disclaimer
This script is educational and not financial advice. Backtest and forward test on a demo account before live use. Past performance is not indicative of future results. Use proper risk management.

Scalper's Fractal Cloud with RSI + VWAP + MACD (Fixed)Scalper’s Fractal Confluence Dashboard
1. Purpose of the Indicator
This TradingView indicator script provides a high-confluence setup for scalping and day trading. It blends momentum indicators (RSI, MACD), trend bias tools (EMA Cloud, VWAP), and structure (fractal swings, gap zones) to help confirm precise entries and exits.
2. Components of the Indicator
- EMA Cloud (50 & 200 EMA): Trend bias – green means bullish, red means bearish. Avoid longs under red cloud.
- VWAP: Institutional volume anchor. Ideal entries are pullbacks to VWAP in direction of trend.
- Gap Zones: Shows open-air zones (white space) where price can move fast. Used to anticipate momentum moves.
- ZigZag Swings: Marks structural pivots (highs/lows) – useful for stop placement and range anticipation.
- MACD Histogram: Shows bullish or bearish momentum via background color.
- RSI: Overbought (>70) or oversold (<30) warnings. Good for exits or countertrend reversion plays.
- EMA Spread Label: Quick view of momentum strength. Wide spread = strong trend.
3. Scalping Entry Checklist
Before entering a trade, confirm these conditions:
• • Bias: EMA cloud color supports trade direction
• • Price is above/below VWAP (confirming institutional flow)
• • MACD histogram matches direction (green for long, red for short)
• • RSI not at extreme (unless you’re fading trend)
• • If entering gap zone, expect fast move
• • Recent swing high/low nearby for target or stop
4. Risk & Sizing Guidelines
Risk 1–2% of account per trade. Place stop below recent swing low (for longs) or high (for shorts). Use fractional sizing near VWAP or white space zones for scalping reversals.
5. Daily Trade Journal Template
- Date:
- Ticker:
- Setup Type (VWAP pullback, Gap Break, EMA reversion):
- Entry Time:
- Bias (Green/Red Cloud):
- RSI Level / MACD Reading:
- Stop Loss:
- Target:
- Result (P/L):
- What I Did Well:
- What Needs Work:

Full Forex scalper StrategyTHis is a FOREX scalping system that can be optimized with almost all majors and crosses pairs.
Its made of multiple elements such as :
MACD
Stochastic RSI
Fast VW moving average
Slow VW moving average
Time management( forex sessions as inputs)
Rules for entry
Long
Last 2 MACD values were ascending, fast moving average is below moving average and stochastic RSI is below 30 level. At the same time we are either into London or NY session.
Short
Last 2 MACD values were descending, fast moving average is above moving average and stochastic RSI is above 70 level. At the same time we are either into London or NY
Rules for exit
WE have 2 exit possibilities: we can exit either at the end of NY/London Session or based on a TP/SL risk management calculating % in movement.
If you have any questions let me know !

Forex scalper 2xEMA + SRSI + MACDThis is a forex scalping strategy designed for the most liquid pairs, like major forex pairs.
Its made of
1 EMA 50
1 EMA 100
Stochastic RSI
MACD
Rules
For long :close of the candle is above moving average 50, moving average 50> moving average 100, macd histogram is positive and cross over of stochastic rsi with the oversold level.
For short :close of the candle is below moving average 50, moving average 50 < moving average 100, macd histogram is negative and cross under of stochastic rsi with the overbought level.
Exit
For exit we have take profit and stop loss using fixed pip points.
For this example on EURUSD we use 20 pips for both tp and sl
IF you have any questions let me know !

Breakout Scalper (Session)This is a twist on my on my Breakout Scalper strategy that limits trading to a user-configurable session
Find the original "Continuous" version of the scalper here:
The breakout scalper is based on "slow" and "fast" donchian periods. In this version, the "slow" donchian is in fact the Day's high/low. This important difference means that we will always be entering our trades at the day's high or low, so you are exposed to the price making new highs/lows but not to oscillations within the day's range.
Furthermore, the scalper is modified to only enter trades after the start of the user-configured session. Any open trades are closed at the end of the user-configured session. The default session is set to 10:00 AM to 3:30 PM because that's when I like to trade.


Predicta Futures – Scalping Predictor with Confidence FilterPredicta Futures is an advanced short-term forecasting indicator that combines historical pattern similarity analysis with weighted technical signals to predict price movements 1–10 minutes ahead.
**Core Functionality**
The script scans up to 5,000 historical bars to identify structurally similar price patterns. It aggregates forward outcomes from matched patterns and integrates real-time signals from RSI, MACD, Bollinger Bands, volume momentum, and volatility. A composite confidence score filters signals, displaying only those meeting the user-defined threshold (default ≥68%).
**Key Outputs**
- Buy/sell triangles with text labels
- Dashed projection line to predicted price
- Dotted target and ATR-based stop lines
- Info panel showing forecast direction, confidence %, expected move %, pattern count, order book status, and data access details
**Customization & Performance**
- Execution modes: Fast, Balanced, Accurate
- Adaptive sampling with recency bias option
- Filters for volatility and market hours
- Adjustable weights, lookback period, and prediction horizon
**Use Cases**
Scalping, intraday trading, futures, cryptocurrencies, equities.
*Order book metrics are simulated (platform limitation). Technical analysis tool; not financial advice.*

Dwaggy Scalping Trio (VWAP + EMA + RSI)First attempt at pine script this is a scalping indicator that combines VWAP, EMA, and RSI to signal entry/exit for scalping lower time frames

Moon Scalper v3 + VSAMoon Scalper v3 is a high-precision scalping indicator optimized for the 15-minute chart. It delivers clean buy/sell signals with TP1 (1:1 risk-reward) exits using layered confirmations:
• **Volatility Bands** — SMA + multiplier detect expansion zones
• **EMA Filter (200)** — ensures trades align with trend
• **RSI Range Filter** — avoids extreme overbought/oversold traps (buy: 52–62, sell: 38–48)
• **Volume Spike Filter** — filters for institutional activity (vol > 1.4×SMA)
• **VSA Confirmation** — requires wide-spread, high-volume bars with reclaim (volume × 1.4, spread × 1.5, reclaim 50%)
**Usage Notes:**
Best used on 15m timeframe for liquid pairs (e.g., BTCUSDT, ETHUSDT). Signals appear as “BUY” / “SELL” labels on chart. Defaults yield high TP1 hit rate; use only during active sessions (e.g., London/NY) for best accuracy.
**Disclaimer:**
This indicator is for educational purposes only. Past performance is not a guarantee of future results. Always backtest before live trading and manage risk responsibly.
