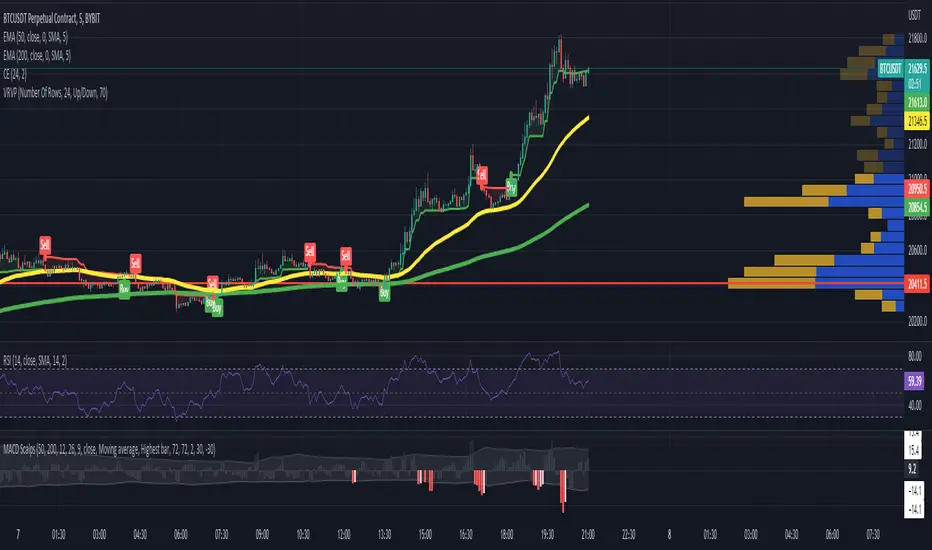
MACD ScalpsMACD Scalping
50 EMA crosses below 200 EMA = Only shorts
50 EMA crosses above 200 EMA = Only longs
For longs: -> Enter on red MACD bar
For shorts: -> Enter on green MACD bar
Bars not big enough or that do not follow the EMA rule are greyed out.
Cerca negli script per "scalping"
Kam+ ScalpingThis study project is a Scalping trading Tool that incorporates the majority of the indicators needed to analyse and scalp Trends for 1min, 5min or 15min charts. Incorporated within this tool are the following indicators:
1. Major industry (Banks) recognised important SMAs
3SMA
2. Kijun Sen+ for entry
3. Atr Stop Loss For Stop Loss Entry/Exit.
Hint:- Use With Rsi Time Frame 15 min Custom, And Volume Flow Indicator For Trade Conformation

Liquidity mapLocate institutional daily, weekly, and monthly liquidity intervention zones in an innovative format that allows you to fractalize the degree of trend reversal opportunity across multiple lengths!
Far from the traditional formats to tell you "where's the high/low", we display with this map the grab levels relating to the amplitudes of the measured period.
You can check "show old levels" to backtest these potential fractal reversal areas.
Use the levels that interest you according to your working UT (scalping, intraweek, swing, etc.), or take all the elements into consideration for your trading management :
Confluence the information to optimize your entry and shelter your stop loss under strong levels rejections !
Default parameters are: display high/low weekly & monthly, display liquidities levels in daily.

SP IndicatorSP Indicator - One of the best indicators for scalping trading on any timeframes. The best readings are given on 5, 15 and 30 minute frames.
For readings, several indicators are combined into one, which allows you to get a more accurate forecast, which is more than 90%.
Instruction.
The indicator is easy to use. Just install it and follow the arrows to go long or short. Stop loss set small, about 1-2%. In most cases, this is sufficient.
Good luck in bidding!
Wick/ Long / Short Monitor- Wanted to check if price movement on a particular candle for day trading is less than my target movement.
- A user can place this on chart and on the candles where the price movement is not as predicted from the open price, a red * will be placed above or below the bar
- it is best used in fixed profit scalping strategy

Simple Moving Averages (10 & 20 & 50 & 200) for ScalpingSimple Moving Averages for Scalping (10 / 20 / 50 / 200 SMAs)

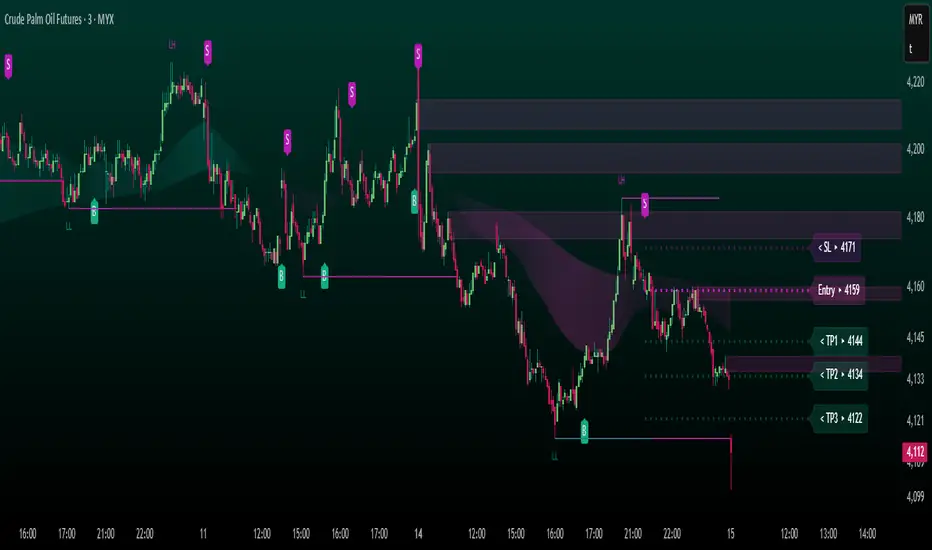
FUTURES ScalpV2 PROTECHFUTURES ScalpV2 PROTECH system
This indicator is built specifically for fast trading i.e. scalping/intraday in the commodity market or futures market. It uses an indicator instrument consisting of ATR TRAILING STOP (ATR), EXPONENTIAL MOVING AVERAGE, PIVOT POINT, and FIBONACCI.
Rebuild of Instrument & Parameter
This indicator is also an upgraded instrument that is sourced from the previous indicator, the COMPLETELY FCPO INDICATOR.
This R&D of course to make trading activities more effective, dynamic and to increase the confidence of traders in current trading activities. The indicator has been upgraded in terms of parameters as well as additional instruments. Among them are;
1. ATR Trailing Stop
2. Exponential Moving Average – fastMA/slowMA Length
3. Label@Entry Price/Stoploss/Takeprofit line
>The best timeframe is 3 minutes
>The take profit and stop loss rates are based on percentages. However
traders can change the percentage rate according to their respective
trading plans.
>existing percentage rates have been set(build-in) specifically for the FCPO
market. So you have to reset for other markets.
>The candle/bars have been colored to make it easier for traders to see price
trends whether in bullish or bearish conditions.
The original instrument has been retained but changed in terms of display & facelift features.
The original indicator (COMPLETELY FCPO INDICATOR) still remains in use and can used together. Hopefully with the combination of these indicators will make traders more successful in trading activities, especially in the futures market.
DISCLAIMER;
ALL NOTES AND INDICATING TOOLS ARE FOR EDUCATIONAL ONLY AND AS A FACILITATOR AND PREPARATION IN TRADING ACTIVITIES. ADMIN IS NOT RESPONSIBLE FOR ANY RISKS IN YOUR TRADING ACTIVITIES. TAKE AT YOUR OWN RISK.
FunTrader/Aieyee @2022
BreathEasy TrendLine Scalping - Pro Dear Traders,
Trendlines are the one particular word ever trader would definitely know what it is. But the way it gets applied on to the chart is the one thing which needs to debated on. Traders definitely love to trade Trendline breaks like the way I do.
When it comes to Trendlines , we generally categorize them based on the Major Trendline and Minor Trendline, however concept of Breakout or Breakdown of trendline wouldn’t change whether it’s a Major or Minor Trendline. Trendline is by nature powerful and prices do respect the same. In order to add more power, I have combined the Trendlines with Fibonacci to time the entries correctly.
What you can expect from this Indicator?
This indicator is mainly designed to work on the lower time frames (Intraday Indicator), between 1 minute TF to 5-minute TF or max 10 minute.
It is necessary that you use this indicator on a highly liquid instruments such that calculations are smooth. since, price gaps may affect the accuracy of the results.
Script detects & plots Trendlines, based on the Pivot Points found on the chart and helps you take trading decisions wisely.
What is the scope or idea behind developing this indicator?
1. Its majorly build to identify the Trendline breaks (Break Out and Break Down)
2. Identify, Trend line False Break.
3. Identify the possible consolidation zone and intimate about the Consolidation Break
4. Peak Buying | Selling Possibility when Prices does cross levels based on the fib ratios.
Couple of Additional info | Points to Understand | Point of Comfort zone
1. Provides Alerts when the event happens such as (Important Trendline has Broken, Consolidation zone is broken etc.) and places a dummy entry indication that Indicator took a trade with the SL and Target if any.
Note: All the entries plotted by this indicator are just DUMMY for your educational purpose only. you may seek support from your financial advisor before placing similar trades in real market.
2. Indicator Can constantly notify you on ever time SL is updated, if necessary to keep you aware of. I have adopted volatility-based SL such that, if prices move too quick and too far SL also will move quick and gives enough room for the price to play its role. If the prices tend to go flat SL acts flat. It can also help you lock in some profits when your PNL reaches certain level either by price or by percentage. (All options are customizable)
3. It also takes HTF information wherever necessary if the indicator needs some additional confirmations like Trendline zone in higher timeframe or fib level in HTF zone. You can certainly advice indicator to direct which HTF to use.
4. If the Script need Volume confirmation there are possible options provided for you to direct the indicator to refer the volume source. Like if you are trading BNF you may direct the volume source to its related futures
5. Options are provided to customize to Qty and Lot and based on the suggested option it plots dummy entries with suggested Qty to trade with.
6. You may set the Max loss level for each of the trade which you would like to risk so that Indicator detects the setups which are in close proximity to that level. It so happens it detects setup with max loss level of 7K and due to price fluctuations dummy entry may lose bit more than what was capped.
There are many additional options | information’s | suitable Notifications via Alerts provided. To give you enough information for your trading decisions along with Dummy Trades info.
IMPORTANT POINT TO CONSIDER:
REPAINTING : I use the word “real time data” in my indicator tooltip in conjunction and help you understand what indicator does. By this you can understand the impacts of the same.
I strongly recommend you read the tooltips in order to understand the indicator better.
Enjoy!
DISCLAIMER : No sharing, copying, reselling, modifying, or any other forms of use are authorized for our documents, script / strategy, and the information published with them. This informational planning script / strategy is strictly for individual use and educational purposes only. This is not financial or investment advice. Investments are always made at your own risk and are based on your personal judgement. I am not responsible for any losses you may incur. Please invest wisely.
Happy to receive suggestions and feedback in order to improve the performance of the indicator better.
Imbalance Identifier With Target BoxTarget Area to help me with my target area for visual reference
Imbalance Identifier - Helps me to see where the trade may come back to
EMA on 1 Minute Time frame for helping to identify Direction to take trades in
I primarily use this as a tool to help me identify very short term direction for scalping small target area (Adjustable)
Preset for the main 28 Forex Pairs, US30,US100,US500 Dax40 and Gold on the 1 Minute timeframe

NazhoThis is a simple scalping strategy that works for all time frames... I have only tested it on FOREX
It works by checking if the price is currently in an uptrend and if it crosses the 20 EMA .
If it crosses the 20 EMA and its in and uptrend it will post a BUY SIGNAL.
If it crosses the 20 EMA and its in and down it will post a SELL SIGNAL.
The red line is the highest close of the previous 8 bars --- This is resistance
The green line is the lowest close of the previous 8 bars -- This is support
+SuperTrend

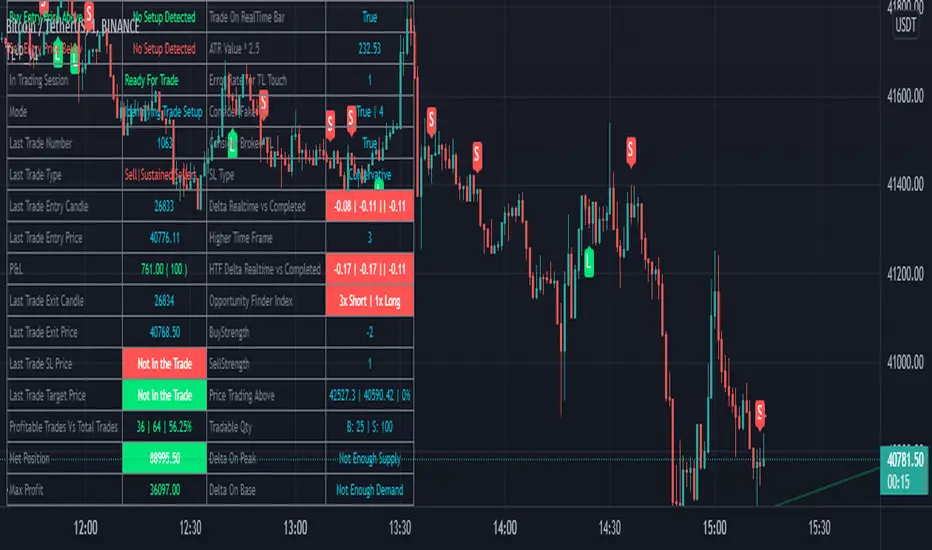
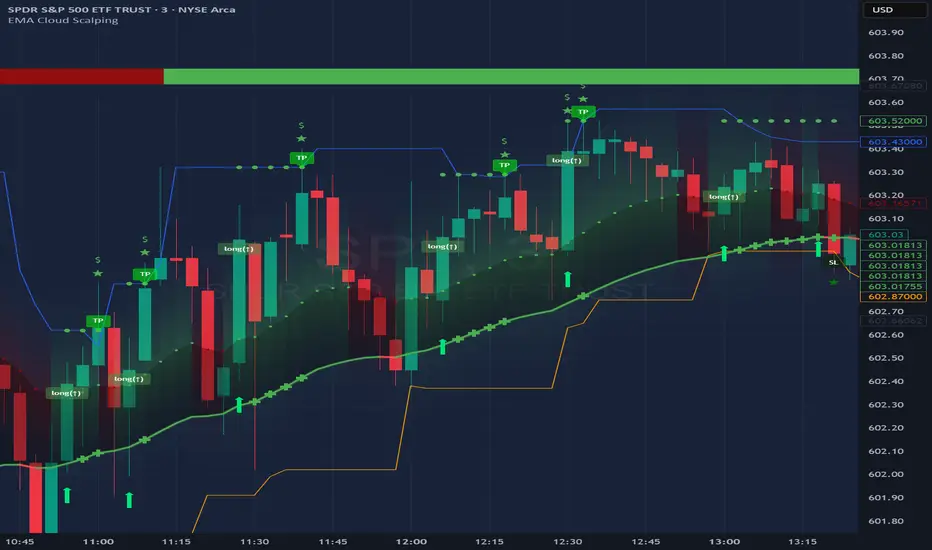
Day Trade Scalping - Optimal Trade Entrance IndicatorThis script can be used to day trade SPY ( S&P ), Forex Currencies, Stocks, Bitcoin and pretty much anything out there. It was extensively tested trading live on 15minute timeframe with great results, it can be used with other timeframes as well.
Indicators:
- Regular Signals (red/green) – trade signal arrows, includes alerts
- Risky Signals (orange/olive) – trade signal arrows, includes alerts
- Optimal Trade Entrance Area - target at where to enter the trade with minimal risk and maximum profit
As the signals explained, there are regular and risky signals, which are calculated per different algorithms. Based on the test run, risky signals will appear less and be more risky, but usually spot longer bigger runs!
The original idea of the script is to provide the trader with an Optimal Trade Entrance Area to reduce the risk and maximize the profit. After you receive a signal/alert, wait for the price to re-trace to the Optimal Trade Entrance Area line, which will be shown on the chart. If the price does not reverse - it's best to not open a position. (Remember that the best trade is – no trade!).
If you don’t know how to divide up your position - here is an example on how I take profits between the price targets:
- Open position with buying a multiple of x3 contracts
- Sell 1/3 of the position at first price target and move my SL to entry
- Sell 1/3 of the remaining position at a second price target
- Sell the rest of the position at the third price target or scale out slowly if the trend is still strong
Also, keep an eye on the breakouts, especially if they go along the script signals as with breakouts, there is a good potential for a bigger move.
Reversal zone finderThis script would find potential reversal price zones according to RSI over bought or sell condition and big reversal candle.
It works better in range markets and lower time frames like 5M and especially in Support/Resistance zones.
Suit for scalping in forex or crypto markets.
* Use it as a trade assistant not a trade signal!

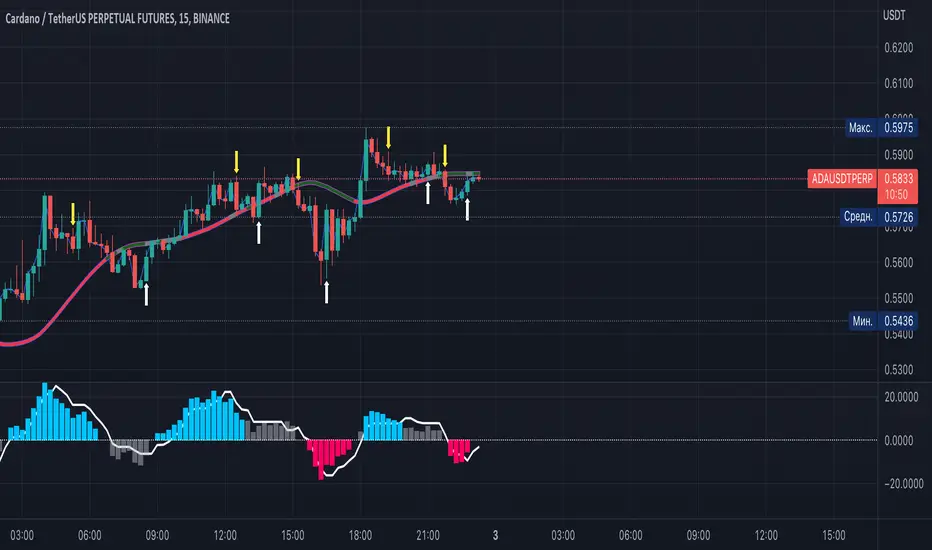
Rolling VWAP - Vhunt Scalper botBINANCE:ADAUSDTPERP
Modified VWAP to use scalping in lower timeframe.
Use 1minute TF for best results but can also use up to 30min.
This indicator is made for crypto but may also work for other assets.
The bands serve as support and resistance and used for opening quick profit position if conditions below are met:
Indicators:
Blue - modified rolling vwap
Orange - Band1
Green - Band2
Opening position Conditions:
Long:
Band2 < Band1
Price < Band2
Short:
Band2 > Band1
Price > Band2

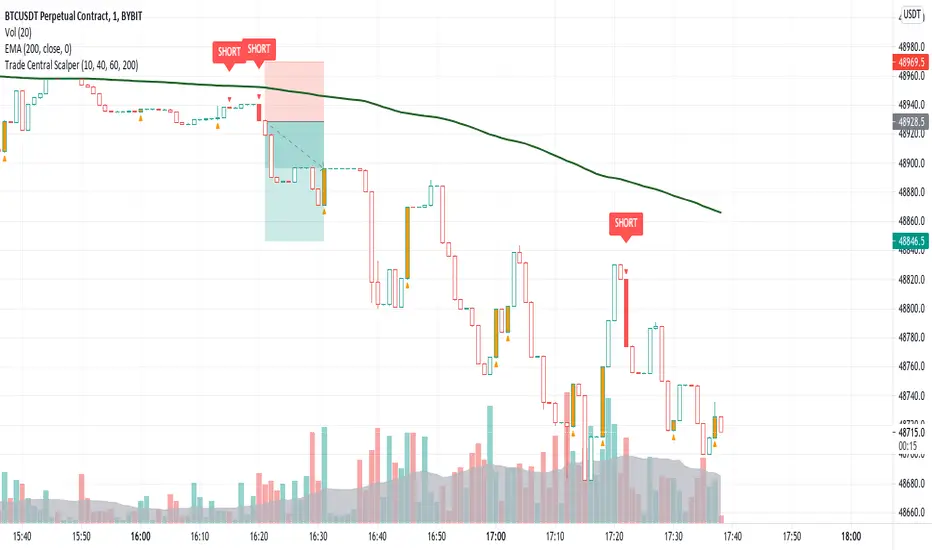
Trade Central ScalperTrade Central Scalper is a scalping signal indicator based on trend and strength of the move using EMA and RSI. It determines the short term trend using EMA and strength of move using RSI. Price above set EMA allows only long trades and price below set EMA allows only short trades. Increasing RSI values from lower levels as defined in settings combined with trend as per EMA triggers the signal.
Indicator shows bars in 4 colors - Green, Red, Orange and White. Signal candles, i.e. long and short, are green and red respectively. Orange candles with opposite signal (triangle up/down) are potential reversal points where exiting from current position is recommended. Rest of the candles are white and no action is needed when candles are white.
Trading using the script is simple - you enter a long trade on a green bar and enter a short trade on red bar. Detailed rules for trade execution are mentioned below.
Trading Rules
Recommended Timeframe: 1 minute
Go LONG after a green bar when signal candle high is broken. For example, on BTC chart if signal candle (green) high is 50000 then enter at least 3-5 points above it, i.e. 50003. If the signal candle high isn't broken then wait for that to happen, but signal/trade gets invalidated if the signal candle low is broken before signal candle high is broken .
Go SHORT after a red bar when signal candle low is broken. For example, on BTC chart if signal candle (red) low is 50000 then enter at least 3-5 points below it, i.e. 49997. If the signal candle low isn't broken then wait for that to happen, but signal/trade gets invalidated if the signal candle high is broken before signal candle low is broken .
Set the SL below previous swing low for long entry. SL above previous swing high for short entry. If the SL is too big then avoid the trade and ensure risk reward is favorable, i.e. minimum 1:2 is recommended.
Once you're in a trade and you encounter an orange bar with opposite triangle sign then exit the current position else let the trade hit either defined target or SL.
Default settings work best on 1 minute timeframe and has been tested on BTC and ETH, though it works well on forex as well. You can try our different EMA and RSI values for other timeframes. Backtesting for 1 week (all signals between 16th August 2021 and 22nd August 2021 on 1 minute timeframe) on BTC, indicator gave 68% win ratio. There were around 205 trades in the week. Will share details over a YouTube video.
Will strongly recommend paper trading in desired market/asset before executing live trades.
Scalp ProScalp Pro is a scalping tool that uses the MACD mechanism. MACD lines are smoothed using fibonacci numbers and pi numbers. In this way, the noise on the signal is reduced. A " BUY " signal is generated when the lines cross upwards. If the lines cross down, a " SELL " signal is generated. The logic is very simple and the Indicator is very useful.
I wish you many profitable trades.

CRYPTOPRODear traders,
Welcome to CRYPTOPRO indicator. Only for crypto markets! This is an invite only script, please PM me to request permission for testing and access.
This indicator is developed as a scalping, intraday or swingtrade strategy.
Been working on indicators for years now, now back to trading again and made the best possible indicator for different timeframes.
The indicator uses market data, multiple timeframe ma/rsi charts and price action for determining a long or short strategy.
The indicator does not repaint!
I have made the indicator as easy as possible to use with added background colors.
How to use:
- Long strategy: when background turns to green after bar closing.
- Short strategy: when background turns to red after bar closing.
Alerts:
- Alerts are included in the indicator and are very simple to use.
- Alert "buy" for long strategy (green background)
- Alert "sell" for short strategy (red background)
- The alerts can also be used for automated trading/bot trading.
Time Frames :
- Can be used for all different timeframes.
Chart candles:
- Indicator is to be used with standard prince candles.
Note:
- Trading and financial markets are always risky and unpredictable.
- All trades made based on this indicator and his results are always your own responsibility.
- As an author i will not be held responsible for any of your trading profit or loss. Always be cautious when trading.
Charts can be applied to all TV supported crypto charts.
If you find the indicator usefull share your support and feedback in the comments.
Any questions PM me for more info.Thank you!
DISCLAIMER:
No sharing, copying, reselling, or any other forms of use are authorized for our scripts / strategy, and the information published with them.
This script / strategy is strictly for individual use.
This is not financial or investment advice. Investments are always made at your own risk and are based on your personal judgement.
NYTRADE is not responsible for any losses you may incur. Please trade wisely.

LSMA Wave RiderThe LSMA Wave Rider uses Least Squares Moving Average to make a fast oscillator ideal for scalping lower timeframe charts. Upper and lower bands contract during pullback and expand as it "booms". The perfect entry is the first crossover after bands expand. This is a great tool for entering trades.
The above image shows two examples of perfect entries:
1. The upper and lower bands contract getting tighter as it pulls back.
2. The upper and lower bands then begin to expand as it gets ready to fly.
3. The oscillator crosses over showing entry point.
* Please note that this strategy may not work during major downtrends. *
Oscillator 2 is used to detect diversions. Reduce the number to pick up shorter diversions and increase to 200 to pickup larger diversions.


Order Blocks V2 [MensaTrader]Lines are Strong Support and resistance , Used to help find buy/sell or take profit zones.
When the lines turn green, these prices are suggest good limit entry prices for longs and shorts.
Default settings are left for scalping on short timeframes
Please note that this is experimental and far from perfect. feel free to play about with the variables in the settings.
feel free to comment any suggestions I hope to update this in the near future
The script is written in version 4

CCI45/SMA50 indy for 30 min SP500SPCFD:SPX
The script determines entry points using 45 period CCI and 50 period SMA.
Long condition: When CCI crosses up 150 treshold while price above 50 period SMA
Short condition: When CCI crosses down -150 treshold while price below 50 period SMA
Trades are executed above/below 1 point of high/low for long/short positions. Stops are just 1 point below/above of SMA. After 4 points of profit stops should be tightened. If you do not plan to hold the position for a long time, it can produce quick profit within 5-6 bars namely 2.5-3 hour. Otherwise you can manage the trade using SMA as trailing stop. This can be treated as a strategy of scalping which turns out a trend trading eventually if conditions good.
Have a nice trading

MAC Trader V2.0 [VK]This script is based on a very simple and affective strategy. Usable for scalp, Trend, Swing, positional Trading. Works on all types of markets(Crypto, Stocks, Commodity, Forex, etc) and symbols.
About The Indicator :
The three lines(Grey upper, Red Mid, Grey Lower) moving with the price direction is Moving average channel (MAC) Which is used to determine the Market Direction. Buy/Sell signals are plotted on RSI Oversold/overbought Which is used For Entries. Small Red Line plotted below the Buy/Sell Signals is Stop loss and The Dotted lines in Green, Grey and Red are the take profit lines.
How to use :
Buy When Buy Signal, Sell When Sell Signal (Entry only After Candle Close). Use The red line below/above signals for Stop Loss. Green Red dotted lines to take profit targets, move your stops above/below as targets hits.
Functions :
Moving Average Channel (MAC) For Direction
RSI for entries
ATR for stops
Support/Resistance Lines to Take Profits
Color candles When Price Above/Below MAC
Additional Feature :
Chop Signals for Scalping/continuation/Mid Entries - This feature can be turned on in the indicator settings Which will plot B/S signals for entries.
TIP : Use MAC input 34,48 for low volatile markets (Indices, Gold , etc)
TMA + OSMA Scalping SystemSystem is based on TMA Bands + OSMA + EMA Zone. Signal is generated when:
- price recently touched lower or upper band
- price is crossing EMA Zone
- OSMA is aligned in direction of trade to be taken
Natural Target would be opposite band set by TMA.

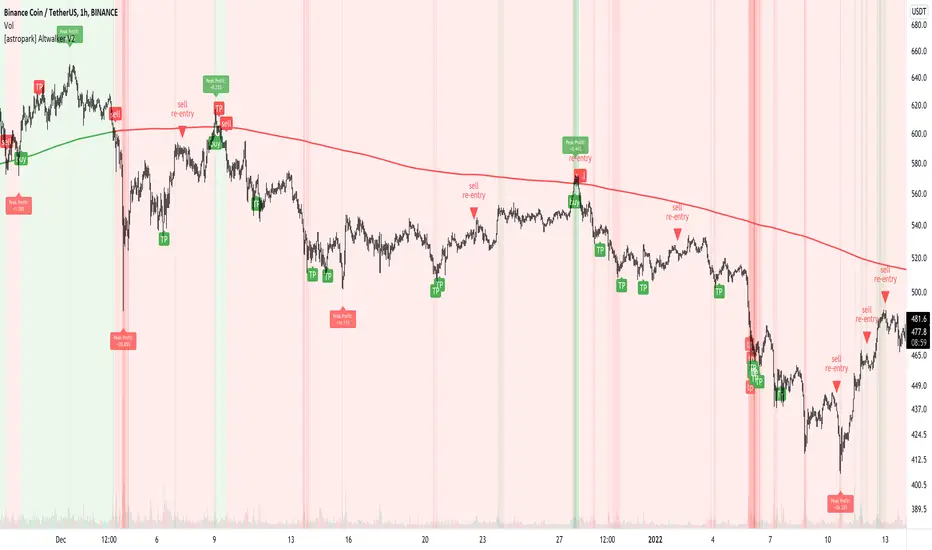
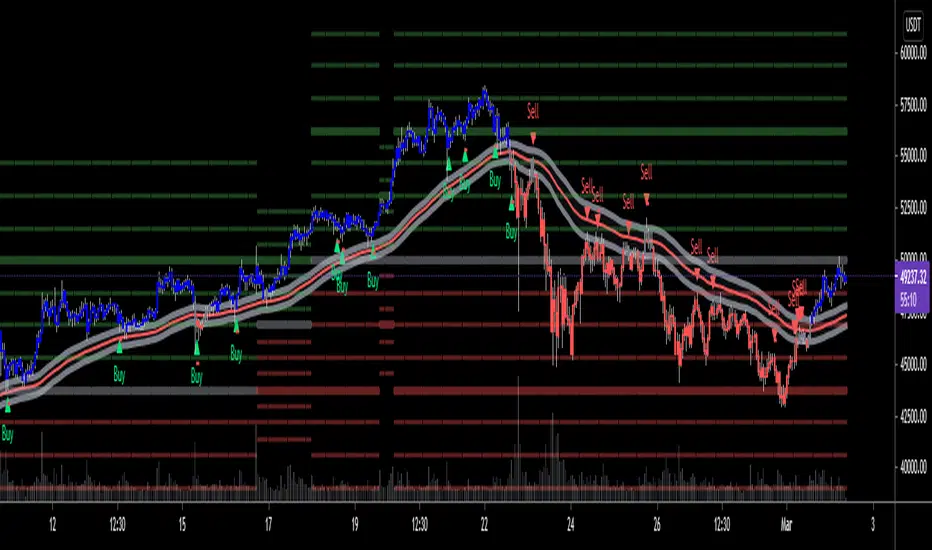
[astropark] Altwalker V2Dear Followers,
today I'm happy to share with you Altwalker V2 , an updated version of the former Altwalker for lower timeframes (from 5 minutes to 4 hours).
It is both a Swing and Scalping Strategy indicator , based on a simple trend following theory , mainly designed for Cryptocurrencies, Altcoins and of course Bitcoin.
Here you can see the Altwalker V1:
Based on Moving Average, Altwalker V2 on low timeframes dynamically identifies market resistance and support, so in which trend a cryptocurrency is during time:
green trendline and background means bullish trend , in fact it start with a "buy" signal
red trendline and background means bearish trend , in fact it start with a "sell" signal
if a series of buy and sell appears (this may happen especially in lower timeframes), this means price is in consolidation or distribution phase, so be prepared for a new trending phase coming soon, always remembering that taking profits is awesome and managing your risk by defining you position size and having a stoploss is a must in trading
To help in Taking Profits, Altwalker integrates also 2 special tools besides the trend highlighter:
Overbought and Oversold RSI Signals , which appear both as darker background (the darker the color, the more the price is in overbought/oversold) and green "ob"-"tp" / red "os"-"tp" labels (they optionally pop up only on a configurable stronger overbought/oversold condition) (you can enable/disable it optionally)
Peak Profit Tracker , which resets every time a new trade start and keeps track of price fluctuation during the trade: the message is don't be too much greedy and take profits or lock them with a stoploss in profit (you can enable/disable it optionally)
You can edit many options in order to
enable/disable showing buy/sell signals
enable/disable showing trendline
edit trendline variant (you have 2 options, by default variant 1 is selected)
enable/disable showing trend as background
enable/disable showing RSI TP signals
edit RSI length, overbought (OB) and oversold (OS) levels
enable/disable showing peak profits on each trade
The user who wants to use this strategy, especially via an automated bot, must always set a stoploss (example 150$ from entry on bitcoin ) or use a proper risk management strategy .
This is not the "Holy Grail", so use it with caution. It's highly suggested to use a proper money management .
This script will let you set all notifications you may need in order to be alerted on each triggered signals.
Here there are some examples how Altwalker V2 works on many timeframes and markets:
LINK/USDT 1h
XLM/BTC 1h
ETH/BTC 1h
ETH/USDT 1h
COMP/USDT 1h
YFI/USDT 15m
NEO/BTC 5m
VET/USDT 15m
This is a premium indicator , so send me a private message in order to get access to this script .