Multi Time Frame - Trend AnalysisMuti Time Frame - Trend Analysis
How does it work ? Price movements over range of period is to compute the trend forward.
This script used SuperTrend (ST) , ATR and RSI to determine the trend and direction so that a buy sell decision can be made
To Indicate the strength of the trendline , RSI is computed over multiple timeframes and then used to in sync with SuperTrend to help determine the direction
The user can customise the RSI strength validation. So one the Super Trend and ATR Levels are matched , the RSI is validated before giving a BUY/SELL suggestion
Best Time Frames to use : Upto 15/30 Mins if using RSI based logic , user can use higher timeframe if the goal is to identify the trend and the use lower time frame to determine Buy/Sell
Where to use
Trend Indicator using Multi Time Frame Analysis to suggest a long or a short
The main use of this indicator is quick scalping and Intra-day trading.
The Indicator shows the option to show the Trend Zone and Buy/Sell Signals which the use can on or off
How to use
User Choices : To avoid false positives we have introduced a double check using RSI ,
it is defaulted to 60/ 40 - the users are free to change it as per their preferences
The system will not suggest a trade when the the counter in beyond the RSI limits
Stop Loss - That should be done by following ones risk appetite , Ideally the open/close of the previous candle should be the stop loss for the buy/sell
but everyone has their own Risk Management Strategies based on the capital deployed.
Disclaimer : There could be scenarios when the candle is shown as a long or short and then the candle turns into opposite direction red/green .
In such scenarios , Please refer to the just preceding candle and if this candle is moving into positive direction (forming green candle) only then buy ,
Similarly Sell/Short only if this candle is forming a red candle
How to get access
Please click on the link / email in the signature or send me a private message to get access
Feedback
Please click on the link/email in the signature or send me a private message for suggestions/feedbacks
Cerca negli script per "scalping"
BlueswimmersMinorsBoxV1sloth288Something different to what you usually see in the pine world Part 2
This is an add on to BlueswimmersMajorBoxV1sloth288.
Custom currency screener, to be used with BlueswimmerDoesPine at the same time. to get an idea of whats going on change lookback setting to 0, and go to minute candles.
But in a nutshell.
With lookback being 1, and if currency pair says NEUTRAL LONG, it means last close of candle the long signal happened.
With lookback being 0, and if currency pair says NEUTRAL LONG, it means last candle was neutral and current candle is sitting at long.
If scalping minute candles. Have trading screen split in two, BlueswimmersMajorsBoxV1sloth288 on one side, and BlueswimmerDoesPine on the other. that way when flicking between different charts the indicator does not need to load security data over and over again. This is also the reason why the time frame setting is there, so on the screener it can be just loaded to low time frames, and to double check a trade on the other screen you can zoom out to larger time frames and not reloading data over and over again.

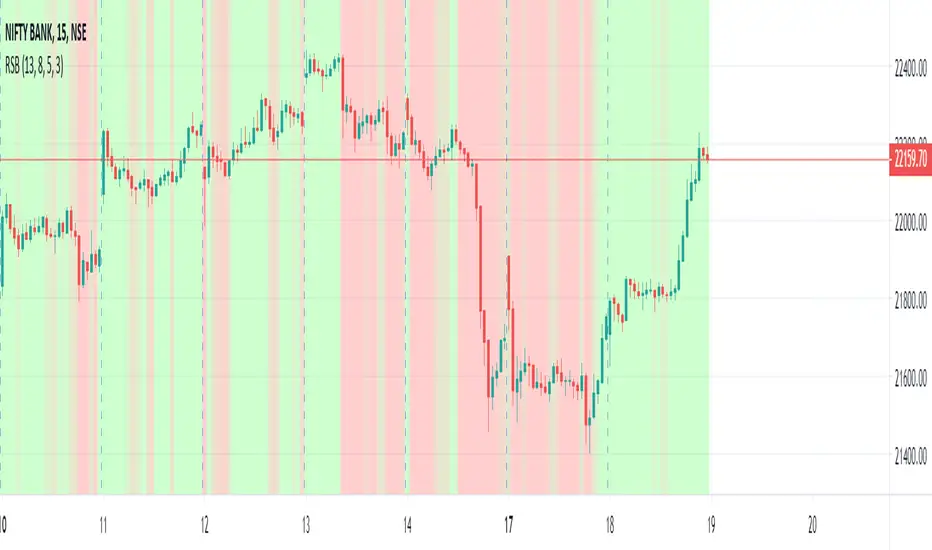
Relative Strength Background [RSB] - Scalping / Intraday / SwingThis script uses Relative Strength Index to display the strength of the trend as a background. The trend can be filtered as there are multiple RSI working synchronously in order to provide the best possible view of the trend and get favourable entry and exits.
Hope This Helps.
mForex - Keltner channel + EMA Scalping systemTransaction setup parameters
Time frame: M5, M15
Currency pair: EUR / USD , GPB / USD
Transaction: London, USA
Number of orders / day: 10 - 15 orders
Trading strategies
=== BUY ===
Candles close on the upper Keltner
EMA10 crosses the upper Keltner range from below
Stop loss in the middle band or up to 12 pips
Profit target: 15-25 pips
=== SELL ===
Candles close below Keltner below
EMA10 crosses the Keltner range below from above
Stop loss in the middle band or up to 12 pips
Profit target: 15-25 pips

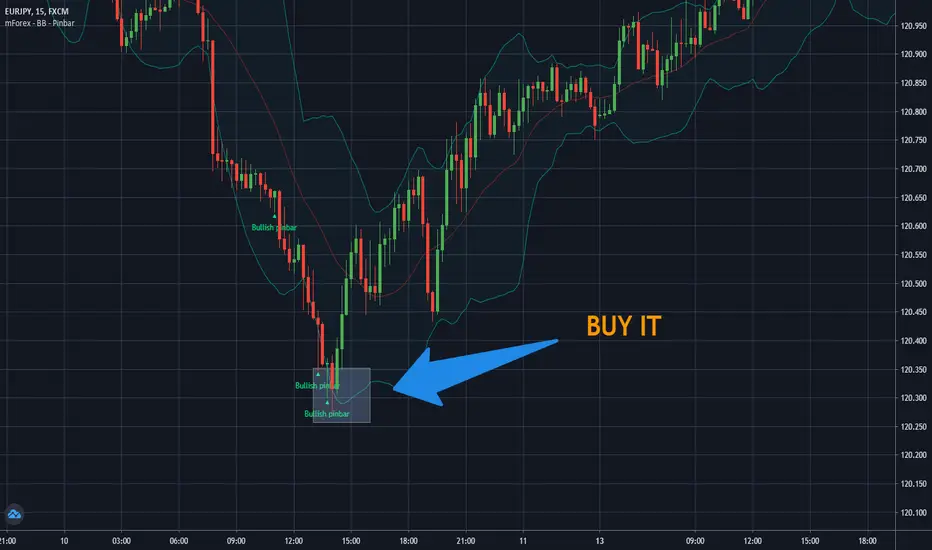
mForex - Bollinger Bands - Pinbar scalping systemTransaction setup parameters
Time frame: M5, M15
Currency pair: Any except XAU/USD
Trading strategies
=== BUY ===
Price break out of the lower Bollinger Bands
The Pinbar reversal candlestick appears and closes the candle on the lower Bollinger Bands
Stop loss: Nearest bottom + 3-5 pips
Profit target: 10-20 pips
=== SELL ===
Price break out of the upper Bollinger Bands
The Pinbar reversal candle appeared and closed below the upper
Stop loss: Nearest peak + 3-5 pips
Profit target: 10-20 pips
* If you have any questions or suggestions for this strategy, feel free to ask us.
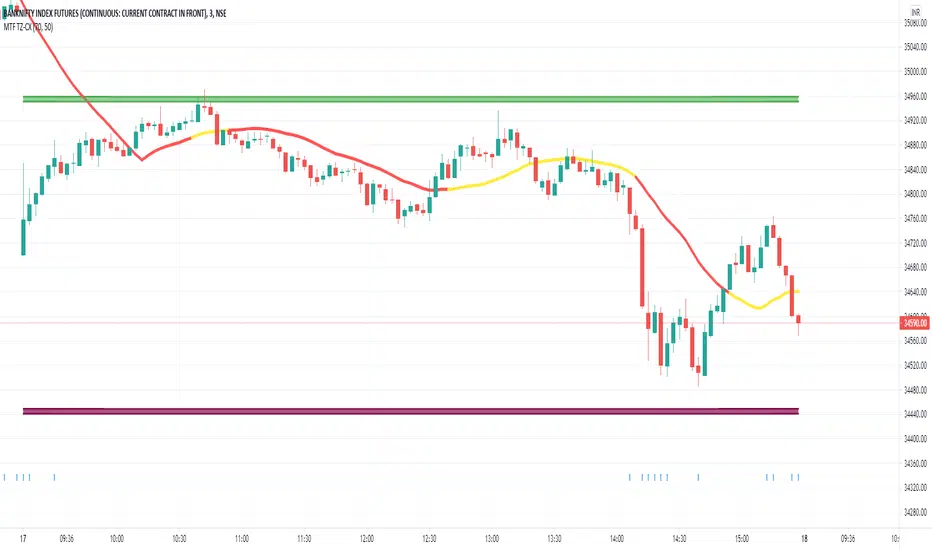
MTF TZ-CXThis is a Beta version of Trend Indicator using Multi Time Frame Analysis to suggest a long or a short
the main use of this indicator is quick scalping and Intra-day trading.
The Indicator shows the option to show the Trend Zone and Buy/Sell Signals which the use can on or off
Also to avoid false positives we have introduced a double check using RSI,
it is defaulted to 60/30 - the users are free to change it as per their preferences
The system will not suggest a trade when the the counter in inside the RSI limits
Stop Loss - That should be done by following ones risk appetite , Ideally the open/close of the previous candle should be the stop loss for the buy/sell
but everyone has their own Risk Management Strategies based on the capital deployed.
Disclaimer : There could be scenarios when the candle is shown as a long or short and then the candle turns into opposite direction red/green .
In such scenarios , Please refer to the just preceding candle and if this candle is moving into positive direction (forming green candle) only then buy ,
Similarly Sell/Short only if this candle is forming a red candle

Dragonfly Doji with DMI and Volume FiltersA Dragonfly Doji is a type of candlestick pattern that can signal a potential reversal in price to the downside or upside, depending on past price action. It's formed when the asset's high, open, and close prices are the same. The long lower shadow suggests that there was aggressive selling during the period of the candle, but since the price closed near the open it shows that buyers were able to absorb the selling and push the price back up.
The study enhances standard Dragonfly Doji accuracy by clearing out market noises and manipulations from the indicator's triggers. Specially selected values of Directional Movement Index (DMI) components detect only strong signals while RSI bands indicator is used to find the safiest signals' closure moments.
The indicator can be applied to trading pairs with USD, USDT, ETH and BTC quote currencies. It is better to check the recent performance on each particular trading pair before apply it. The Indicator supports spot, futures and marginal trading exchanges. The best performance is obtained while using at 15m timeframe and for scalping signals
Advantages of this indicator:
1. Weak signals and market noises are filtered. This allows to receive only strong and confirmed alerts
2. The indicator includes both
Study with built-in custom alerts to use with your own software through web hook connection.
Strategy with configurable risk management settings (order size, commission, take profit, stop loss and trailing). This provides you opportunity of direct broker connection and allows to conduct backtests before applying the strategy to real account
How to use?
Long signals:
1. Apply indicator to the trading pair your are interested in at 15m timeframe chart
2. Once conditions are met price action candle will be colored yellow and DD label will be drawn. Place a long position and wait. The
3. Once price action breaks RSI resistance band, retraces and closes below the band the signal is finished and the position should be closed
Automatic strategy:
When conditions of long or short position from the strategy are met the script opens position.
Strategy.exit closes the position once risk management settings are met.
Strategy.close closes the position once RSI band rejection is confirmed
If you want to obtain access to the indicator please send us a personal message
If you want to obtain access to the indicator please send us a personal message or leave a comment

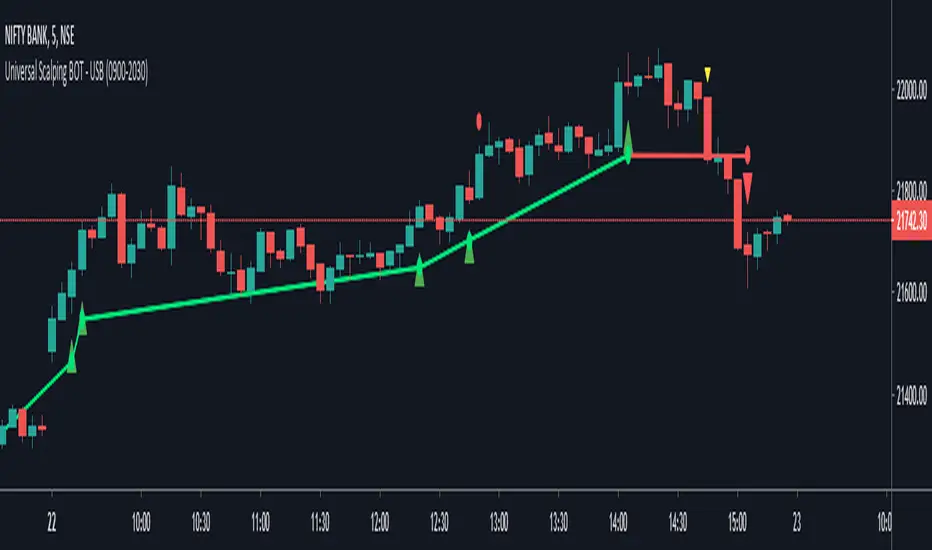
Universal Scalping BOT (USB) - With AlertsThis Study Is based on
• RSI
• Moving Average
• Candlestick price action and
• Bulls Bears calculation.
This Study is Also has alerts inbuilt.
Alerts are for:
• Buy Active
• Buy Profit Achieved
• Buy Loss Hit
• Sell Active
• Sell Profit Achieved
• Sell Loss Hit
How to trade ?
• When Green big Up triangle Comes, Buy that time and book profit at red small circle and book loss at yellow down small triangle.
• When Red big Down triangle Comes, Sell that time and book profit at green small circle and book loss at yellow up small triangle.
► Options Available In Setting:
To Show / Hide :
• Target Line
• Stop-Loss Line
• Define Trading Sessions
► Trailing SL is calculated on candle stick price action and not on Average True Range.
Test Yourself and give feedback.
PM us to obtain access.
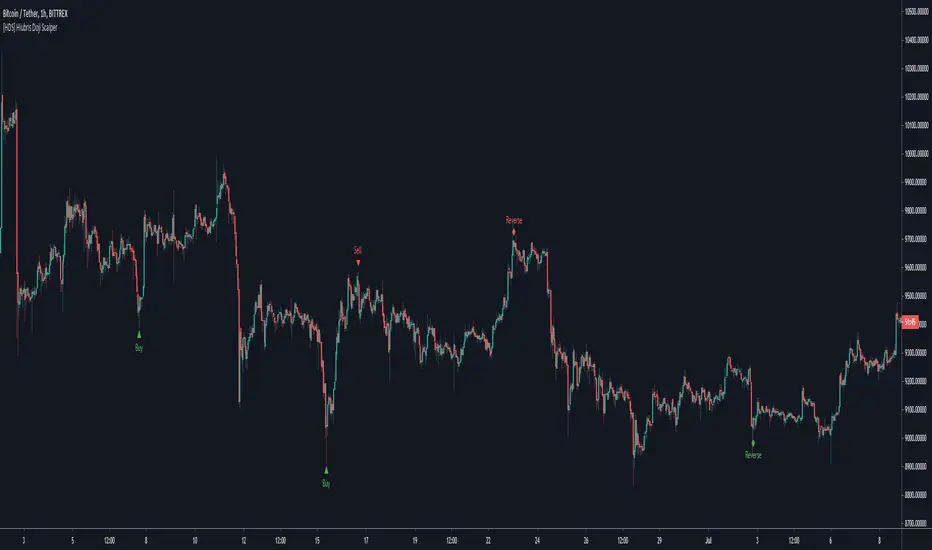
[HDS] Hiubris Doji ScalperThis is a simple Scalping Strategy based on custom Candle Patterns
The script mainly identifies reversal patterns and signals them on the chart.
All chart signals can be setup as live alerts !
It works well on literarly any Pair/Timeframe
[astropark] VWAP Crosses [alarms]Dear Followers,
today a new Swing and Scalping Strategy based on WVAP , mainly designed for Bitcoin and High-Cap Cryptocurrencies, like Ethereum. It works also on Forex and Stocks.
It works great since 15m and above till 1D. I suggest you to use it on 15m, 30m or 1h timeframes .
VWAP or "Volume Weighted Average Price" is a volume-based indicator similar to a moving average.
This trading indicator is used to identify market resistance and support levels and is represented as a weighted average price for the treaded volumes.
My strategy will help you identify main support-resistance level to be careful of and it will trigger a buy or a sell depending on how price will intereact with vwaps.
green means we are in a bullish trend, in fact it start with a "buy" signal
red means we are in a bearish trend, in fact it start with a "sell" signal
blue means we are in a moment where trend may change, so be careful and always remember that taking profits is awesome and have a stoploss is a must in trading
The user who wants to use this strategy, especially via an automated bot, must always set a stoploss (example 150$ from entry on bitcoin) or use a proper risk management strategy .
This is not the "Holy Grail", so use it with caution. It's highly suggested to use a proper money management .
This script will let you set all notifications you may need in order to be alerted on each triggered signals.
The one for backtesting purpose can be found here below:
This is a premium indicator , so send me a private message in order to get access to this script.

ADD for SPX intraday (NYSE Adv-Decl) -Tom1traderThis is the NYSE Advancers - decliners which the SPX pretty much follows. You can chart it like any index (ADD -NYSE $ADV MINUS $DECL) but I find it more useful in a separate panel with colors for direction.
The level gives an idea of days move (example: plus or minus 500 is not much movement through the session) but I follow the direction as when more stocks advance (green) or decline (red) the index tends to track it pretty closely.
On SPX, SPY and correlateds - very useful for intra-day trading (Scalping or 0DTE option trades) but not for higher time frames at all. If you chart the ADD in a chart and compare 5 minute to daily you will see what I mean.
I left it at 5 minutes timeframe which displays well on any intraday chart. You can change it by changing the "5" in the security function on line 13 to what you want ("1" 1 minute, "15" 15 minutes) or change it to timeframe.period (no quotes) so that it will follow the timeframe of the current chart. I like 5 min as it displays better on higher timeframes i.e. 15 min. or hour.
A simple moving average with a length of 10 is added to help gauge momemtum.
Hope this helps with trading or scripting ideas, questions or feed back welcome. Keep Smiling.

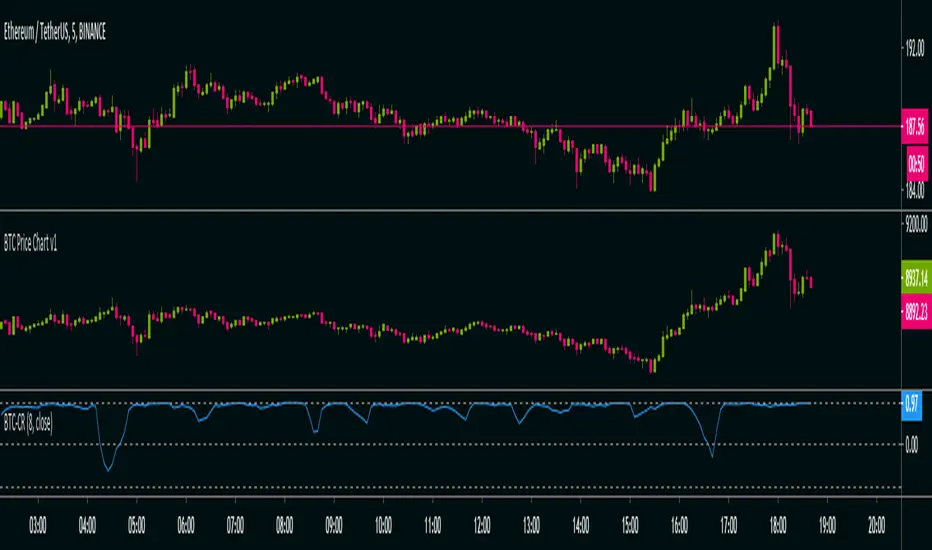
BTC Co-Relation v1Calculate Pearson-correlation-coefficient of selected cryptocurrency with Bitcoin average price of 10 different exchanges.
This is helpful in scalping(at least for me), by using this we can find co-relation between a cryptocurrency and Bitcoin .
Here we are using Bitcoin average price of 10 different exchanges.
It is an oscillator with minimum value -1 and maximum value +1.
👉-1 means current selected cryptocurrency price is completely out of relation with Bitcoin price, means Bitcoin price increasing and it's price decreasing or Bitcoin price decreasing and it's price increasing in selected time-frame.
👉+1 means current selected cryptocurrency price is completely in co-relation with Bitcoin price, means Bitcoin price increasing and it's price also increasing or Bitcoin price decreasing and it's price also decreasing in selected time-frame.
Happy trading 👍.
Theft Indicator - 5Min Scalping SystemWhat is our indicator?
Theft Indicator - Buy & Sell Alert System is our first published script that shows price action on a certain period of time (We Use ATR indicator). We take pride in enabling trading to become easier for the experienced and the non-experienced traders around the globe. Buy & Sell alerts will be fired once a condition in our algo is met.
Does it Repaint?
Our indicator does NOT re-paint. Although while setting an alert it may pop up the repaint alert, please take into consideration that once a signal is fired on a "CLOSED BAR", our signal will never disappear, they do not repaint.
What Markets is it usable with?
You can use it in any market, Forex, Stocks, Crypto, Indices. All time frames are profitable, not all trades. But the Majority is profitable if you use a stop loss and target price.
How to use:
Simple plug and play it to your chart, in addition to a few other indicators we will recommend to you (we still have not published them yet), and this will confirm your trades. You can also connect TV alerts with a bot and let it run. Please be aware that SLIPPAGE time is important, If you run a bot on this indicator you HAVE to know that the buy/sell price will be on the bar AFTER the Candle close (For example: the BUY/SELL alert is on a candle, the buy/sell your bot or you will execute WILL be in the following candle depending on your trading system. We advise you to not leave the bot to trade on its own, you have to monitor and have a specific syntax that we will help you with creating according to your trading style.
How are the Buy/Sell Alerts fired?
We use the simple ATR (Average True Range) indicator. However we have modified the indicator to serve our trading system. Check below for a definition of what ATR is:
What is Average True Range - ATR?
The average true range (ATR) is a technical analysis indicator that measures market volatility by decomposing the entire range of an asset price for that period. Specifically, ATR is a measure of volatility introduced by market technician J. Welles Wilder Jr. The true range indicator is taken as the greatest of the following: current high less the current low; the absolute value of the current high less the previous close; and the absolute value of the current low less the previous close. The average true range is then a moving average, generally using 14 days, of the true ranges.
Why is our indicator special and different from the normal ATR indicators?
We have modified the mathematical equation and changed it slightly to give more accurate signals, we do not promise all trades are profitable, the use of this indicator is up to your own judgement and liability. We believe that we have an indicator like no other ATR.
P.S: This is not financial advice, we are just sharing our indicator that we know has good results, and it will take time for people in -ve profiles to recover losses and for the profiting to be more profitable. We use a specific trading method that only works with it
You can contact me for more information about the indicator, Goodluck :)

Profit Sniper 2.0 Visual Scalper CompanionProfit Sniper companion indicator for scalping, derived from standard Chande Momentum that can be changed to display Heiken-Ashi Chande while Japanese candles are displayed on the screen.
To be used as a visual tool alongside "Profit Sniper 2.0" Indicator to allow you to clearly and easily verify Heiken-Ashi Chande Momentum precise position and general trend at the time a "Sight" label is painted onto your chart from the main "Profit Sniper 2.0" Indicator.
We'll be adding further indicators in the near future to match legacy Profit Sniper.

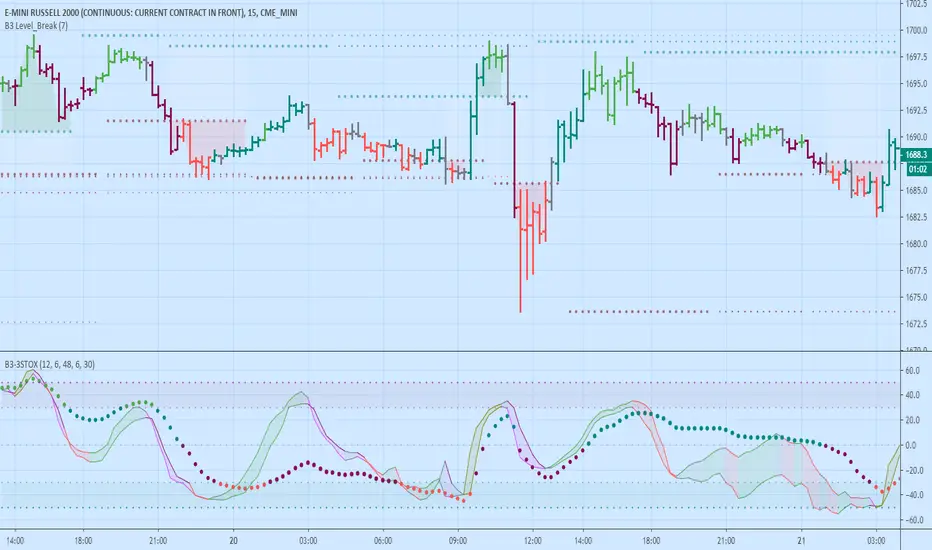
B3 3-Stox - Scalping OscillatorThis is an indicator that combines what I see some scalpers use on youtube videos and webinars.
3 Stox = Three Stochastic Readings
Fast Stochastic of Highs
Fast Stochastic of Lows
Slow Stochastic of Bar Average
Bar Color Code
Bar Color Coded
Light Green = Long with trend
Dark Green = Long counter trend
Light Red = Short with trend
Dark Red = Short counter trend
Fast Line Color Code
Green = Lows leading highs up (Organized Rise)
Olive = Highs leading lows up (Rapid Rise)
Red = Highs leading lows down (Organized Fall)
Fuchsia = Lows leading lows down (Rapid Fall)
Trades to be looked at:
Trading in the direction of the fast lines, when they are similar to and near one another, in the same direction as the Slow stochastic line's color or slope
Trading Long Fastline green color when all 3 lines are oversold
Trading Short Fastline red color when all 3 lines are overbought
AVOID Trading when fast lines are spread out and a large cloud appears between them (Chop Filter)
Look for solid up & down & up & etc. oscillation or you can use the slow line to find trends to trade
Green and red fast lines are organized moves, the olive and purple lines are faster moves and harder to lock in sometimes
Things to note:
Pairs nicely with a level printing study like B3 Level Break (applied on above chart)
There are 2 color schemes for the Fast High and Low Stochastic lines, and 2 color schemes for the bars
In this script the bar average is defined as (open+high+low+close+close ) / 5, keep the slow line at a large length input so that you can get a macro trend reading without zooming out the chart
The Extended Stochastics from one of my previous scripts is defaulted as the style used, however, you may turn that feature off and use the classic Stochastics
More details: drive.google.com
Enjoy!
~ B3 d^.^b
TOPDOG SCALPING-BANDS****this indicator is an implementation of the Bollinger Band
scalping system.
This technique is for those who want the most simple method that is
very effective. It is BEST traded during the busiest trading hours,
This method doesn't work in sideways markets, only in
volatile trending markets.

NiLUX Trend Scalper TSSL (Alerts)Trend Following Scalping Bot
Great results on pretty much any pair and timeframe
Features:
Dynamic Trend Detection
Long / Short Scalp Alerts
Take Profit (Trailing Stop) & Stop Loss Alerts
TP/SL Plots for Profitview included
This is Donationware 🍺
Leave me a tip, you decide the amount, then send me a DM to get access.
The link to my tip jar is below in the signature

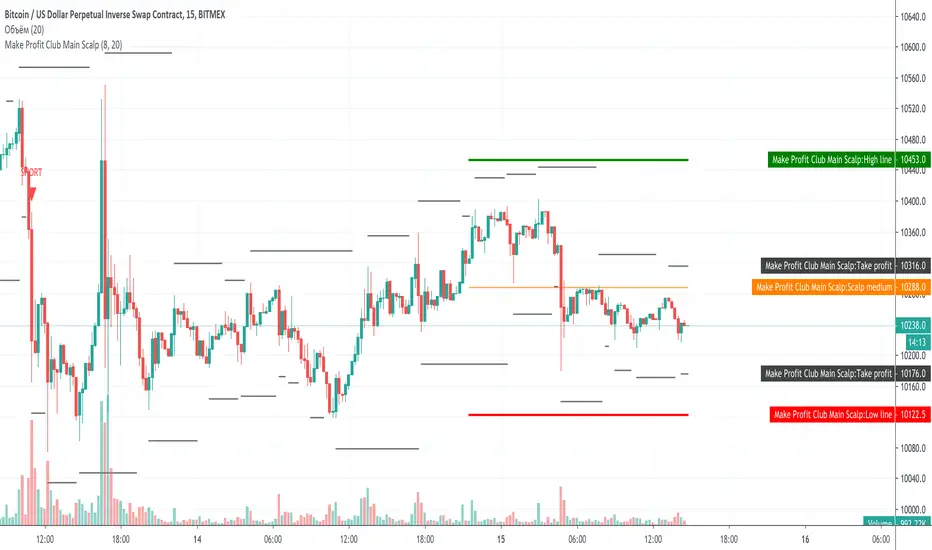
Make Profit Club Main ScalpThe main scalping indicator.
We use this indicator to trade for a short time in a TF of 5-15 minutes.
We have created takeprofit zones for you so that you can understand where we can get to and take your profit. these points are mostly very helpful.
There are basic settings that allow you to adjust the indicator individually for each situation; because of this, this indicator can be used for any exchange and any currency pair.
For Scalp trading, we use 3 different strategies available to our clients. If you enter them correctly, you can never see the minus sign.
Use the link below to obtain access to this indicator.
[astropark] Trend Is Your Friend V3 [alarms]Dear Followers,
today another awesome Swing and Scalping Trading Strategy indicator, runnable on a bot , which works great on High Timeframes (1D is suggested) but also on lower ones (just write me in order to help you find correct settings) and even better on 1m Renko chart!
If you are a scalper, you will love suggested entries for fast profit. You can run it on 1h timeframe (below is not suggested, there is "no-trend" below 1h!) if you are used to scalp trading and close each trade whenever you feel happy (a proper trailing stop strategy is suggested anyway).
This is not an evolution of "Trend Is Your Friend V1" or V2 , but a twin sister or the "Trend Is Your Friend V1" indicator you can see here below
and twin sister or the "Trend Is Your Friend V2" indicator you can see here below
This strategy differs for the engine used as basis, but has the same usage settings:
enable/disable signals on chart
enable/disable showing trend cloud
enable/disable bar coloring based on trend
enable/disable background coloring based on trend
edit trend period length (direct message me in order to help you fine best settings)
edit a smart variant option to enhance the trend cloud on your chart
enable/disable an option to smart enter trade
This strategy only trigger 1 buy or 1 sell. In order to get notified when a signal is triggered, you need to use the "alarms" version of this indicator.
Strategy results are calculated on the timeframe from December 2012 to now, so on 8 years, using 10000$ as initial capital and working at 1x leverage (so no leverage at all! If you like to use leverage, be sure to use a safe option, like 3x or 5x at most in order to have liquidation price very far).
This is not the "Holy Grail", so use a proper risk management strategy.
This script will let you set all notifications you may need in order to be alerted on each triggered signals.
The one for backtesting purpose can be found by searching for the astropark's "trend is your friend v3" and then choosing the indicator with "strategy" suffix in the name, or you can find here below
This is a premium indicator , so send me a private message in order to get access to this script.

1min - EMA Scalping SystemEMA Scalping System
by Mishu
Rule´s
When the two groups of MMAs part, you have an entry signal. You can tell when this has occurred by watching for a gap between the yellow and aqua EMAs.
The best entries are given when the long-term (red) group is already aligned in a perfect order behind the trend indicated by the short-term (green) group. Sloppy crosses result in sloppy trades.
There are a few of things you need to pay attention to with this implementation of guppy:
1. Avoid trading against the 200 EMA. (I don't like trading against the multi-day trend, either.)
2. Don't take shaky crosses. You want the candle to be moving above or below the greens with authority.
3. The best crosses occur at a sharp angle against the reds.
4. Do not take a cross if the reds are still pointing the other way. When the reds tighten and start to flip over, you're ok.
5. Sometimes it is better to wait for a pullback to confirm the validity of the move. When you get a candle closing at its high or low in the direction of the move, you can enter.
Important :
The visualization of the entrances (buy / sell) only serves to help you find "possible" options better / faster.

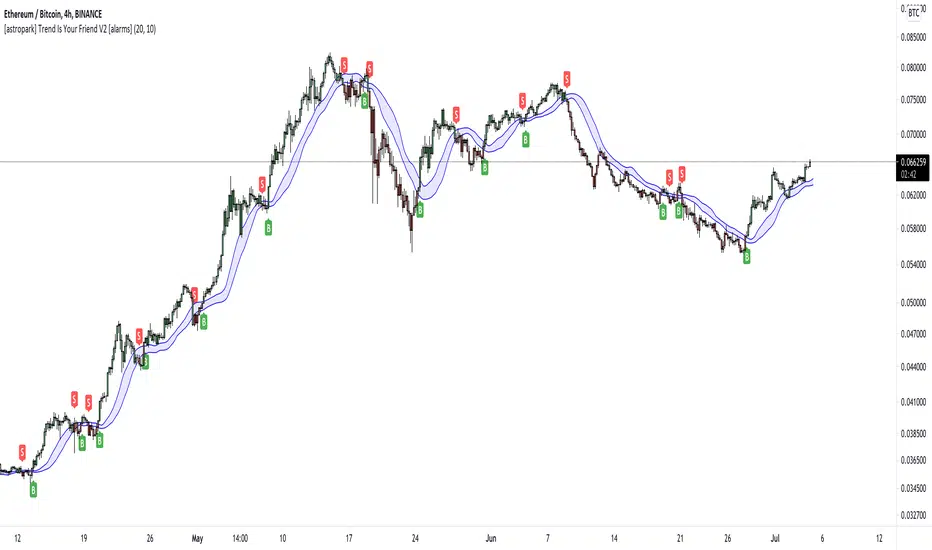
[astropark] Trend Is Your Friend V2 [alarms]Dear Followers,
today another awesome Swing and Scalping Trading Strategy indicator, runnable on a bot , which works great on High Timeframes (1D is suggested) but also on lower ones (just write me in order to help you find correct settings) and even better on 1m Renko chart!
If you are a scalper, you will love suggested entries for fast profit. You can run it on 1h timeframe (below is not suggested, there is "no-trend" below 1h!) if you are used to scalp trading and close each trade whenever you feel happy (a proper trailing stop strategy is suggested anyway).
This is a twin sister or the "Trend Is Your Friend V1" indicator you can see here below
This strategy differs for the engine used as basis, but has the same usage settings:
enable/disable signals on chart
enable/disable showing trend cloud
enable/disable bar coloring based on trend
enable/disable background coloring based on trend
edit trend period length (you have to increase it if you go on lower timeframes or you go on FOREX/Stocks market, direct message me in order to help you fine best settings)
This strategy only trigger 1 buy or 1 sell. In order to get notified when a signal is triggered, you need to use the "alarms" version of this indicator.
Strategy results are calculated on the timeframe from January 2015 to now, so on 5 years, using 10000$ as initial capital and working at 1x leverage (so no leverage at all! If you like to use leverage, be sure to use a safe option, like 3x or 5x at most in order to have liquidation price very far).
This is not the "Holy Grail", so use a proper risk management strategy.
This script will let you set all notifications you may need in order to be alerted on each triggered signals.
The one for backtesting purpose can be found by searching for the astropark's "trend is your friend" and then choosing the indicator with "strategy" suffix in the name, or you can find here below
This is a premium indicator , so send me a private message in order to get access to this script.
[astropark] Trend Is Your Friend V1 [alarms]Dear Followers,
today another awesome Swing and Scalping Trading Strategy indicator, runnable on a bot , which works great on High Timeframes (1D is suggested) but also on lower ones (just write me in order to help you find correct settings) and even better on 1m Renko chart!
If you are a scalper, you will love suggested entries for fast profit. You can run it on 1h timeframe (below is not suggested, there is "no-trend" below 1h!) if you are used to scalp trading and close each trade whenever you feel happy (a proper trailing stop strategy is suggested anyway).
This strategy let's you edit following settings:
enable/disable signals on chart
enable/disable showing trend cloud
enable/disable bar coloring based on trend
enable/disable background coloring based on trend
enable a special option to enhance trend cloud on FOREX/Stocks charts (optional)
edit trend period length (you have to increase it if you go on lower timeframes, like 1h)
This strategy only trigger 1 buy or 1 sell. In order to get notified when a signal is triggered, you need to use the "alarms" version of this indicator.
Strategy results are calculated on the timeframe from August 2017 to now, so on almost 2 years and half, using 10000$ as initial capital and working at 1x leverage (so no leverage at all! If you like to use leverage, be sure to use a safe option, like 3x or 5x at most in order to have liquidation price very far).
This is not the "Holy Grail", so use a proper risk management strategy.
This script will let you set all notifications you may need in order to be alerted on each triggered signals.
The one for backtesting purpose can be found by searching for the astropark's "trend is your friend" and then choosing the indicator with "strategy" suffix in the name, or you can find here below
This is a premium indicator , so send me a private message in order to get access to this script.

MyCryptoradar Scalping strategy v3I use this script as a scalping strategy.
The script contains the following indicators:
1. VWMA
2. VWAP 2-colored line
3. SAR with bull and bear distinction in color
