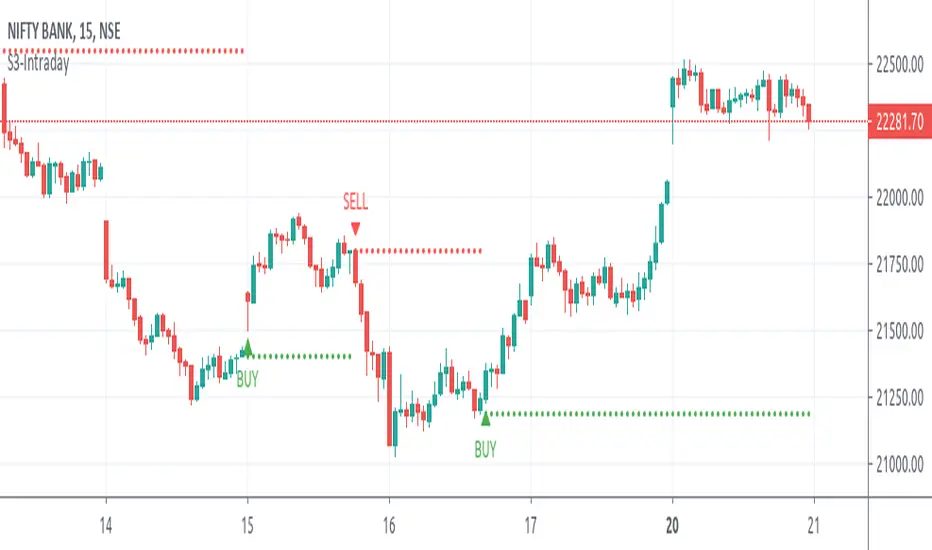
S3-Intraday (Sanjay3725)This script is based on free-float market data of constituent stocks of Index and has been calibrated for Bank-Nifty considering its volatility .
Entry and exits are Plotted on the basis of Price action structures combined with the stock data and can be used as a standalone setup or a trigger system with any exiting strategy based on the user's risk appetite.
Buy = Up triangle with previous candles low as SL
Sell= Down Triangle with Previous candles High as SL
Note: Please Do not use this for any other script than Bank -Nifty and Nifty ( Bank-Nifty has better performance than Nifty )
The ideal time frame for Intraday is 15 min and 5 mins for scalping.
It is imperative to understand that this study does not offer guaranteed profit & Results. It is highly recommended to do paper trades before going live.
Disclaimer:-By using this script you accept that you understand the risk involved with trading and you should carefully consider your investment objectives, level of experience, and risk appetite, In no case, the author shall be deemed responsible for any losses or damages incurred.
Use the link below to obtain access to this indicator
Cerca negli script per "scalping"
Trend Risk Indicator (TRI)The Trend Risk Indicator is a simple bands indicator made of 2 custom averages of candlesticks ranges calculated within the variable “ BandBars ” period.
Upper and lower channel bands width can be adjusted with the “ Deviation ” variable, which act as a simple factor to enlarge the spread between them.
When Close crosses over the upper band, it is a bearish signal and candlesticks are painted in Red.
When Close crosses under the lower band, it’s a bullish signal and candlesticks are painted in Green.
One of the most interesting indicators for 1 minute scalping. Recommended to use on Renko bars.
*drag to chart and pin to scale, also remove borders from candlesticks.

ForteTrader Heiken Multi Time Frame Trend IndicatorThis indicator is using Heiken Ashi Candle Stick System to measure three separate time frames of your choosing. Default setting is with 120 minutes, 240 minutes, and 720 minutes. Ideal for swing trading, or scalping. When two or more time frames align red, looking for short entries. When two or more green time frames align, looking for long entries. Entries and Exits are at your own discretion. This is not trading financial advice just a tool to help you all find overall confluence in your trading and direction.

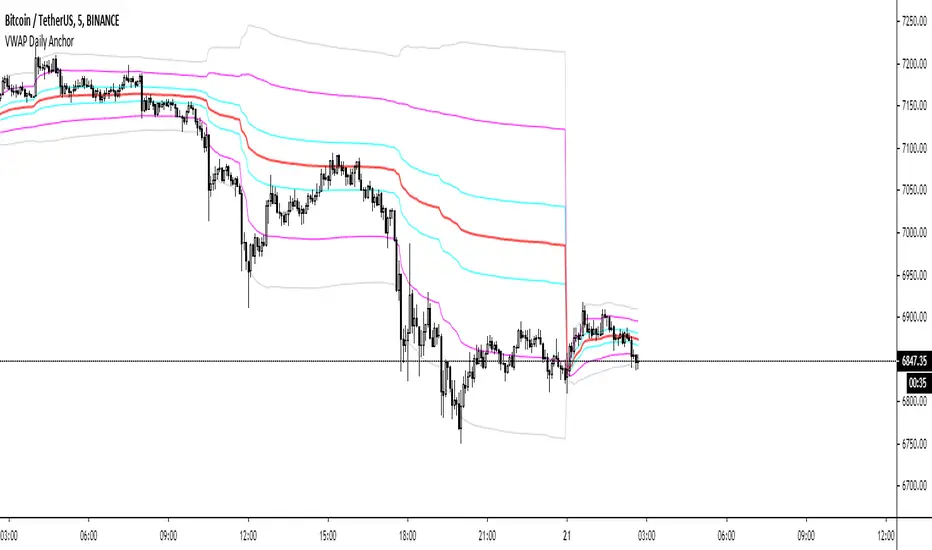
VWAP Daily AnchorAnchored daily VWAP with adjustable standard deviation bands - intended for intraday scalping.
Anchored VWAP is useful because not matter what timeframe you look at it on, it will look the same, unlike normal VWAP indicators. This means there's nothing left to interpretation.
[JOHN] SUPER BOSSHello this is SUPER BOSS indicator.
---------------------------------
How this indicator work?
SUPER BOSS work in sync with KNIFE CUT script.
This indicator provide trendline to check the trend and support/resistance areas.
Check the images below.
The system work with moving averages (you can choose your favorite with 8 different type).
Support and resistance work with rsi conditions.
This script work with every pair and market, with all timeframes.
OverBought, Oversold candles
Green line is a LONG, Red line is a SHORT.
4H example, work with all timeframes also for excellent 15m scalping.
Some other big % ROI examples
Many opportunities.
Tried this with 15m timeframe trading and the result is incredible.

Bullyena SignalsWhat is Bullyena Signals?
-It is an indicator that aids the trader in making entry/exit decisions.
-Note that this is optimized for swing traders but you can also use this for scalping.
-The algorithm contains multiple modern indicators and some of them are proprietary.
Bullyena Signals usage:
-Gives entry/exit signals
-Shows the trend of the price using a bar color overlay.
-Shows trailing stops
-Shows buy/long and take profit signals
-Ichimoku cloud for trend confirmation
Installation
- For candlestacks, make sure to Right click > Settings > Symbol > disable wicks and borders.
Access and Documentation
- Message or PM me to know how to get access

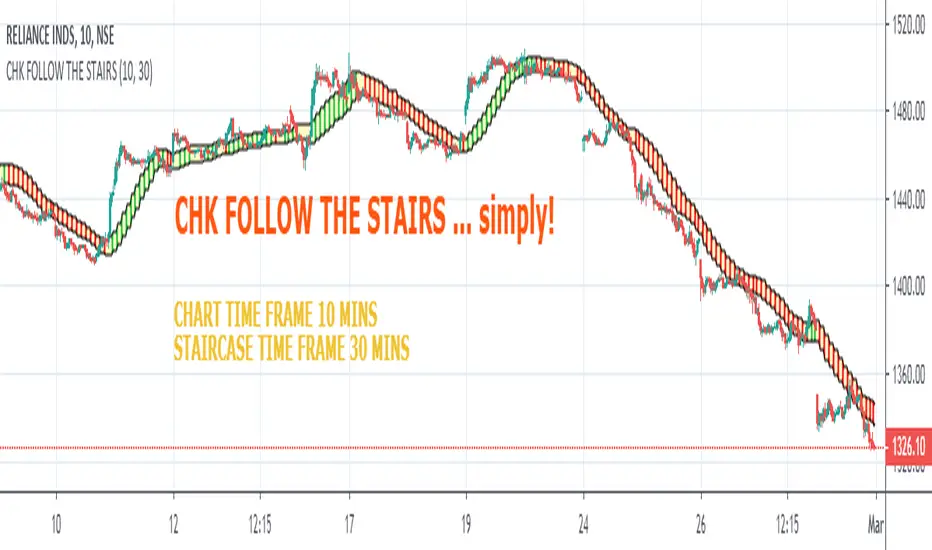
CHK FOLLOW THE STAIRSCHK FOLLOW THE STAIRS....
The stairs are nothing but HIGH LOW CHANNEL at HTF or LTF
I observed 10 Period Moving Average an optimum length for the Staircase
you can change it to 8 or 13, one will generate noise, other will generate lag
Tinker with the Staircase Time Frame to get an optimum fit
The script also shows Strength of the Trend.
If there is a gap between the price and the stairs, that is relection of the strength
The script can also be used for scalping.
Satoshi Stacker Swingtrading Indicator (Former BEAST)About the Satoshi Stacker Swingtrader
Was made by until1mil
Has over 1040 users.
Was first published in July 8, 2018.
It had 6 iterations, this is the 7.
It has been continuously updated throughout the past 18 months, had some poor outputs about 10 months after it was launched but is now fixed.
It works by checking the buy/sell balance in the market, receives those inputs and then those are filtered using different types of moving averages.
Main notes about this iteration:
Discontinued the Beast+ and introduced the Sat Stacker Scalper in this script.
Removed all the garbage.
Removed the website link in the background of your chart.
Has three toggles for you to activate on the inputs tab (names are pretty self-explanatory):
SSSI Scalper - Activate when you're scalping.
SSSI FX - Activate when trading Forex. (I always have it on, even in crypto)
SSSI Swingtrader - Activate it all the time.
Should I use it on all timeframes and all pairs?
You can, if you look at the historical outputs and they are good. However, I use it mostly on XBTUSD BTCUSDT ETHUSD XAUUSD and OILUS on LTF and HTF (dont forget to turn it on using the toggles described above). I like to check the 3, 13 and 23 min as well as the 3day on BTCUSDT using the SSSI Swingtrader, Scalper and FX.
For access, please DM us or visit the link below in our Signature.

TRADER DREAMSThis indicator based macd,rsi,stochastic based. But it includes my own secret values. Comes with Machine learning technology and zero lag option. Next generation of technical analysis.
Also you can look my other scripts
this is symbol scanner
this is wolfe and scalping indicator
this is trending trend based kst indicator
this is also can harmonic formation and trend analysis automatic and shows you target
this is the best for trading
and others....
I'm publishing this indicator for a while. Good luck.

Cuban's Volume-Weighted Anchored Trend with Guppy ModeThis is the first moving average that I've had a crack at. It's a VWMA of sorts that's anchored to significant price events but stays flat during chop.
This moving average essentially ignores most other price action while providing dynamic support and resistance levels, and displaying the underlying trend.
I personally use this moving average in it's singular form on higher timeframes to guide the bias of my low timeframe scalping. Generally, I will curve fit the MA to the recent price action and timeframe.
I've included a guppy function with adjustable lengths to assist defining the current trading range. There is an adaptive mode that will give quicker reversal signals at the sacrifice of increased noise. It works by flipping the source from high to low depending on the trend. I haven't added shading fills to the guppy as I think it takes away too much from the price action, but will add them if there is enough demand.
Enjoy.

shibasukya~柴犬スキャル~
重要な価格を自動で引く機能があります。
There is a function to automatically pull important prices.
この価格では反発する確率が高いので、その反発をスキャルピングでトレードします。
At this price, there is a high probability of a rebound, so trade that rebound by scalping.
リスクリワードを重視してトレードする様にして下さい。
Trade with an emphasis on risk rewards.

[BERA] SUper BOSSHey beras and bulas, this is another gift for you! work in sync with KNIFE CUT script
Please message me if you like my indicators. Thanks you.
This indicator work in sync with KNIFE CUT, check it.
SUper BOSS
Is a special indicator with 2 metrics you can use for be a better trade and stop losing money entering useless positions.
using also KNIFE CUT you will get up to 4 parameters you can compare, for enter only good trades.
This indicator can:
Supports and resistances area as point of reference.
OverBought, Oversold candles
Green line is a LONG, Red line is a SHORT.
4H example, work with all timeframes also for excellent 15m scalping.
SEE? many opportunities.
Tried this with 15m timeframe trading ALGO MOON or DOOM and the result is incredible.
With SUper BOSS and KNIFE CUT, you will earn money in any timeframe!
I may find 15 trades a day with this system.
See price history.
You not believe? i believe.

ToadmodeA swing trading version of that other script I made. Seems like it works well. Maybe no swing trading, but... definitely not scalping. Same business as usual:
- Follow signals and dots!!!
- Move your stop loss up when you see dots, or use a trailing stop.
- I'm working on developing some other stuff to confirm signals or just inspire confidence in confluence.

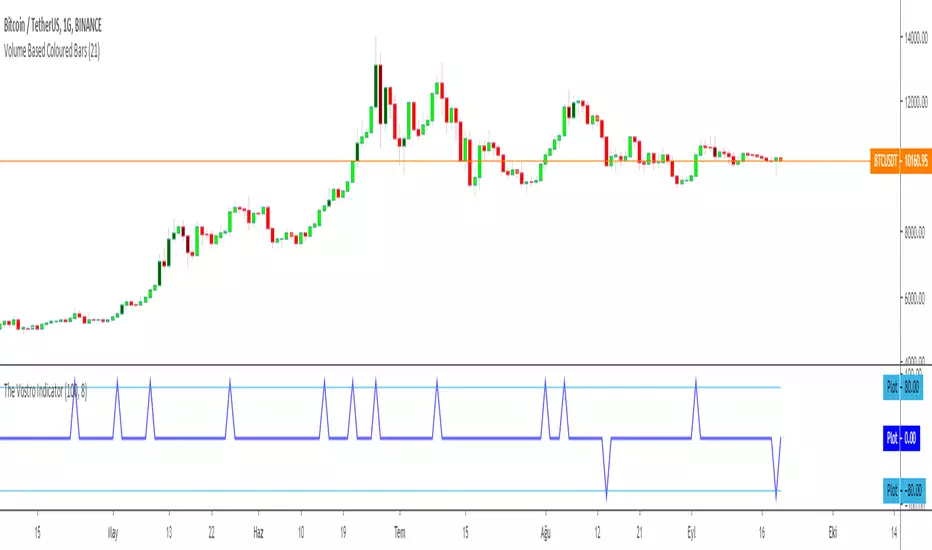
The Vostro Indicator by KIVANÇ fr3762The VOSTRO indicator is a trend indicator that automatically provides buying and selling signals. The indicator marks in a window the potential turning points. The indicator is recommended for scalping.
The Vostro indicator determines the overbought zones (value greater than +80) and the oversold zones (less than the -80 level)
BUY signal: The Vostro curve moves below the -80 level and forms a trough – Turnaround of the upward trend
SELL signal: The Vostro curve moves above the +80 level and forms a peak – Downward trend
further info:
www.prorealcode.com
Here's the link to a complete list of all my indicators:
t.co
Yazar: KıvanÇ @fr3762 twitter
Şimdiye kadar paylaştığım indikatörlerin tam listesi için: t.co
Relative Vigor IndexHere we are looking at a trend strength indicator based on the Relative Vigor Index(RVI). The RVI measures trend strength by comparing the open-close and high-low ranges for the current and three most recent periods. As a zero-centered oscillator, the RVI oscillates above and below zero to signal the strength of the trend.
As there are different ways to interpret the RVI, we have included 3 different modes for traders to choose from in the input option menu:
1. Zero-Crossing:
The RVI Histogram will turn green when it crosses above zero and red when it crosses below. Therefore, a green RVI means the trend is bullish and red means bearish. This mode is better for longer-term swing trading in comparison to the other 2 modes.
2. Increasing / Decreasing:
The RVI histogram will turn green when it is increasing(rvi >= rvi ) and red when it is decreasing. A green RVI is viewed as a bullish signal and red means bearish. This mode is a good middle-ground between the Zero-Crossing and Signal Comparison modes.
3. Signal Comparison:
Here, the RVI is compared to its signal line. If the RVI is greater than its signal line, the histogram is green, indicating a bullish trend, while red means bearish. This mode is preferred for scalping.
Hope everyone finds this one useful!
You can check out our other invite only studies/strategies at our website: profitprogrammers.com

MA differentialThe differential between MA. Works good on lower time frames (1 min). This is basically a modified MACD for lower time frame scalping.

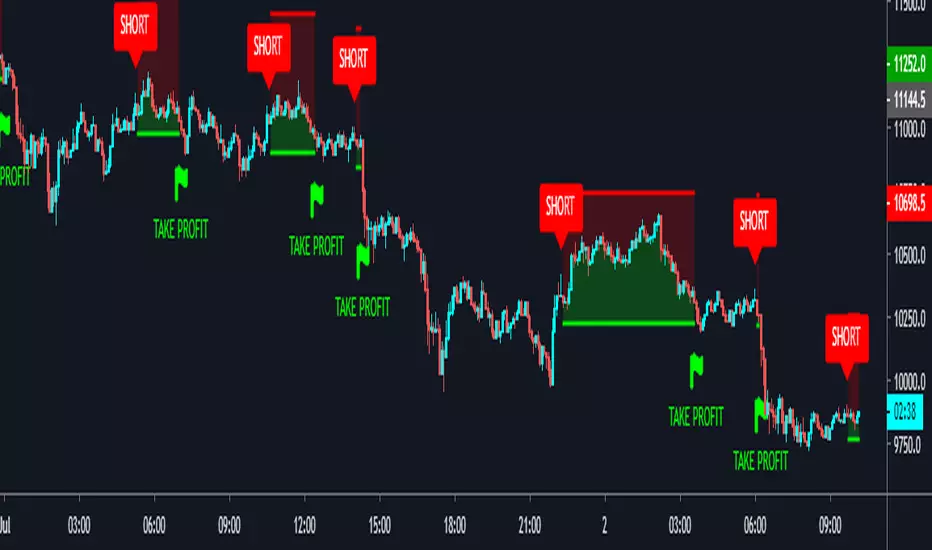
DayTrade - XBTUSD 5m [ALERTSETUP]Plug & Play indicator for BITMEX:XBTUSD in 5 minute timeframe for Manual or Automated Day Trading.
Built upon Cyatophilum Scalping Bot
Backtest below show results over 2 weeks, calculated with a 0.075 % commission fee and using 100% of equity on each trade from 10 000$ inital capital.
> Get access to the Cyatophilum Indicators <
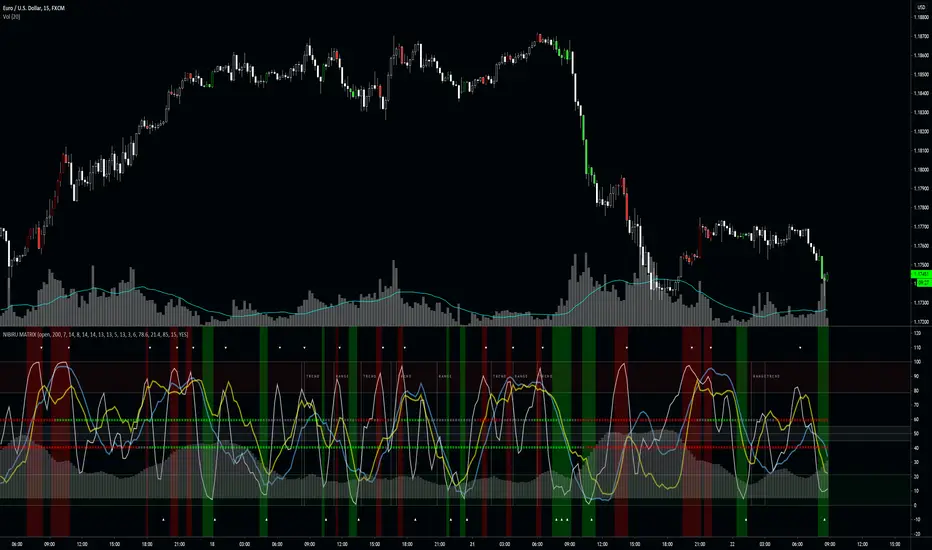
NIBIRU MATRIXThe Nibiru Matrix is an entry timing tool based on oscillators and trends. It's to provide an intuitive way of timing trades when price is at the resistance or on the support.
The Nibiru Matrix provides trade entry hints and information about the current market behavior (trending or ranging). If the market is trending, it also shows the trend strength and direction. It is a secondary indicator meaning it trade should be made on the support or resistance using Nibiru Matrix as a confluence indicator.
What it plots?
Slow, fast and stochastic oscillators
Bar coloring to warn about possible setups
Trending/ranging market indication
Current volatility
2 methods of trend confirmation based on 2 different algorithms
Indicator components:
Trend/range setup - provides information about current possible trade strategy. Following a RANGE indicator, Voodoo Matrix suggests that the safest way to trade will be between the local support and resistance shown by Voodoo Support and Resistance, and following a TREND indicator, it is likely that a trending strategy or taking profit on larger ranges is more profitable.
Fast trend indicator - providing color based information on direction of the short-term trend. This is the most reactive trend indication shown by Voodoo Matrix. This can even be used for counter-main-trend scalping.
Green - uptrend
Red - downtrend
Gray - indecision
Slow trend indicator - providing color based information on direction of the long-term trend. It is based on the behavior of a longer period EMAs.
Green - uptrend
Red - downtrend
Gray - indecision
Volatility histogram - information on current price strength. Best used in confluence with the short term trend indicator.
Fast oscillator - oscillator based on stochastic RSI, modified to provide better information on timing and price movement. It's fast moving which helps time the shorter-term moves.
Slow oscillator - oscillator based on stochastic RSI, modified to provide better information on timing and price movement. It's slow moving and provides useful information about the price direction and strength of the move.
Stochastic oscillator - simple stochastic oscillator. Best used with both Fast and Slow Oscillators to get best timing and price movement strength and direction.
Overbought zone - area of the chart where the modified stochastic oscillator suggests the market is currently overbought.
Oversold zone - area of the chart where the modified stochastic oscillator suggests the market is currently oversold.
Neutral zone - area of the chart where the modified stochastic oscillator suggests the market is currently neutral.
Timing confirmation hints - signaling confirmation of fast oscillator forming a buy/sell setup.
Fast oscillator buy/sell color hint s – bar coloring to bring a focus and attention to possible buy/sell signal forming on the fast oscillator.
Use the link below or PM me to gain access to the indicator.
DOUBLE TRIXTRIX is an oscilator which is calculated from close price by exponentially smoothing it three times.
When it crosses zero and goes up, it tells that the trend is upwards and vise versa.
Some traders use 2 TRIX lines with different periods to enter the deal when they cross each other.
On tradingview there was no such option to use 2 TRIX on chart and niether the option to choose the source of calculation.
DOUBLE TRIX lets you use 2 TRIX lines and choose the source.
By default the configuration is 18-9, source ohlc4.
How to use:
1. You can use it in combination with TRSI (my other script which contains the code of TRIX) to filter the entry point, i.e. to
open the position when both indicators show the same direction. Look at the chart for an example.
2. You can also use 4-14 for small timeframes for scalping.
Use it carefully and in combination wiht other indicators.
Will be glad to see your feedback.

B1 BetaThis indicator study RSI values for many other special indicators.
this indicator is great for scalping.
Green comes overall, that's mean long.
Orange comes overall, that's mean short.

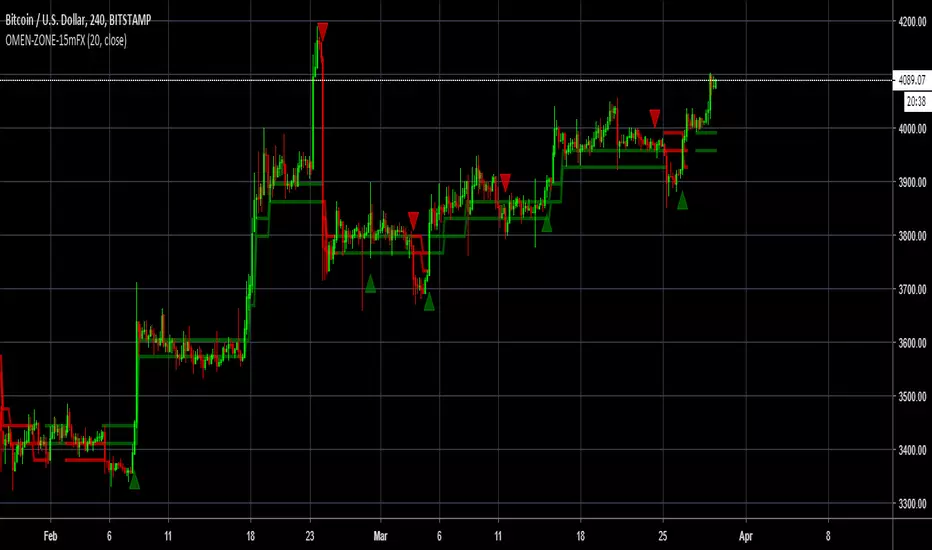
OMEN-ZONE-15mFXOMEN-ZONE created for 15m Charts FOREX. Omen-zone allows users to have a zone of entry for shorting and Longing.
3 Candle Wait will give users larger Zones for catching longer moves and to find great entries
20 Candle Wait will give users smaller Zones for catching Shorter moves for Scalping.
PPSignal BB and EWO BB Strategy ScalpDescription:
This indicator is an implementation of the Bollinger Band and EWO Oscillator Scalping system.
This technique is for those who want the most simple method that is very effective. It is BEST traded during the busiest trading hours, 3am to 12am EST NY time. This method doesn't work in sideways markets, only in volatile trending markets.
-Time Frames: 1, 5, 10, 15 ,30 min.
-Currency pairs: majors, btc, futures and volatile stock.
Other Chart indicators:
Add EWO bb.
Optionally Add Squeeze Indicato or bbsqueeze .
Here's the strategy:
// Going LONG:
Enter a long position when Curve Slope has crossed up through the Bollinger upper band (lime) . At the same time, the EWO BB or BBqueeze should be approaching or crossing it's zeroline, going up. This is indicated by "Buy" alert.
// Going SHORT:
Enter a short position when Curve Slope has crossed down through the low Bollinger red. At the same time, the EWO BB or BBqueeze should be approaching or crossing it's zero line, going down. This is indicated by the "Sell" Alert.
// Take profit:
// 10-20 pips depending on pair or When Awesome Oscillator turns a different color.
// HINTS: Best trades tend to occur when price reversing bounce off outer band and and outside Optional Bollinger Squeeze indication.
// References:
www.forexstrategiesresources.com
