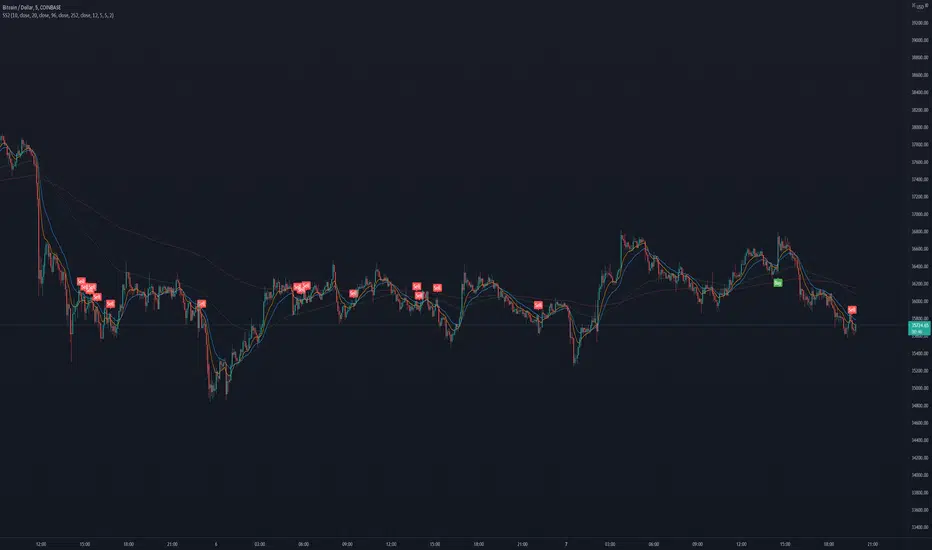
Top Scalping Indicator with Trend & S/RINTRODUCTION
---------------------
Welcome Traders, this is a custom indicator created specifically for scalping stocks, commodities, currencies, and cryptos where there is usually high volatility and momentum. This indicator is a fusion of three specially coded indicators.
1) Custom Dynamic Trend Line
2) Custom Buy and Sell signals
3) Support and Resistance lines
The trendline and the buy/sell scalp signals are based on RSI, MACD, Stochastics values, and the past volume of the security. There is also an ATR inbuilt which allows you to ride the trend. All values can be tweaked according to your trading style. After choosing the desired values, a trendline and buy/sell signals will be generated providing you with various trading opportunities.
Finally, the S/R levels help you to take better confluence trades.
HOW TO USE THIS INDICATOR
-------------------------------------
To make the most of this indicator, deploy it on your chart, wait for a buy signal when the candlestick breaks the trend line from below and take a trade after it closes above the trendline, with previous candles low as to stop loss. Similarly, take a short when the candle cuts the trendline from above and closes below. Maintain a 1:1 or 1:2 risk to reward ratio for net positive results over time. My suggested time frame for trading is 3m, 5m, and 15m, but it may be used on higher time frames as well depending on your strategy and trading style.
The above strategy is just a suggestion from personal experience. As this indicator is a confluence indicator that takes into account various technical values, it is best to back-test this strategy or create your own through the tools provided in this indicator.
Happy Trading!!
Cerca negli script per "scalping"

Pro Algo Scalping/DT/ST No Repaint/No Lagging by@ProKingTV This is a bar-by-bar trading signal system for scalping, day trading or swing trading on all time frames. It generates ONE signal(buy/sell or long/short) for the most of important bars and candles with no repaint and no lagging.
How does it work?
* Defines all support/resistance(S/R) levels based on floor trader’s pivot points and my own S/R levels.
* Calculates the trend/reversal signals, price reactions close to all above S/R levels.
* Generates one trading signal: buy/long or sell/short based on all combined factors.
What are the signals?
* Blue Arrow signals are bullish
* Pink Arrow signals are bearish
How to use?
* Blue Up Arrow : Buy(Long) or continuous Buy(Long)
* Pink Down Arrow : Sell(Short) or continuous Sell(Short)
* Increase time frame to reduce signal noises, but will generate less trading opportunities.
* There is no way to filter all noises even with higher time frame, all the trades must have a stop.
* This indicator is highly sensitive to a price change and reversal signals will be generated immediately.
How to access?
* PM me to obtain access
* 10 day Free Trial is available

SKARB Long/Short Scalping EURUSDThe indicator is specially created for scalping the euro-dollar
Best timeframes 5 m and 15 m

(ง ͠° ͟ل͜ ͡°)ง Larry Connors RSI-2 Scalping StrategyMore info here:
stockcharts.com
and here:
systemtradersuccess.com
Very interesting and simple scalping strategy with unbelievable results.
I added 4 versions that combines only the RSI OB/OS thresholds.
Also the single variable that you can change is the RSI, sometimes RSI 3 or RSI 4 works better then the original.
Also his exit point is not quite good in these days, so I added TP and SL to adjust it according to the market conditions.
Added re-entries.
It works in any time frame, so play with the TF, RSI and with all 4 variants until it fits to your needs.
Enjoy!
Zekis

Hermes Scalping Study by ZekisA simple scalping indicator, based on Highs and Lows.
It's working in any timeframe, the only condition is ... volatility .
Values are already set, but you can change them according to your preferences and to your chart.
Alerts are enabled.
Enjoy!
@ Zekis

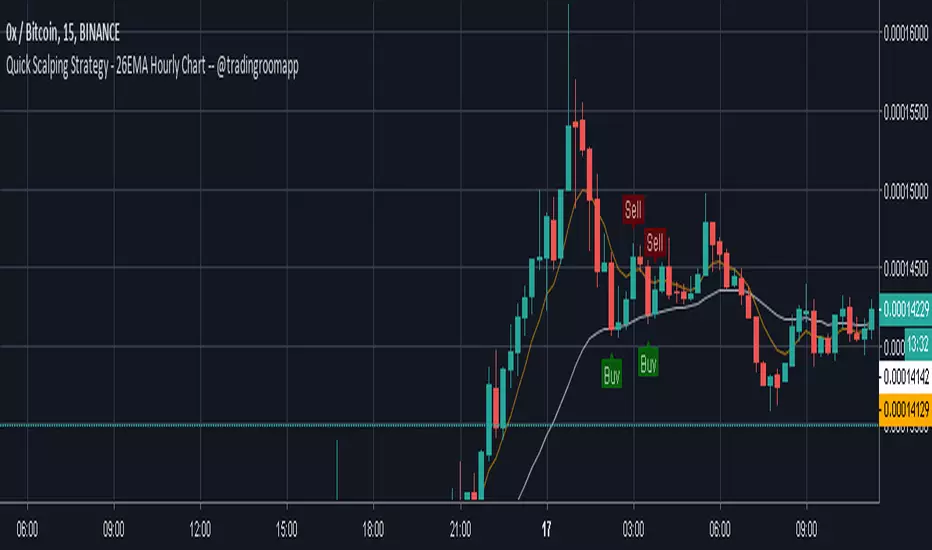
Quick Scalping Strategy - 26EMA Hourly Chart -- @tradingroomappQuick Scalping Strategy around 26EMA and 7EMA published by @TradingRoomApp twitter.com
and brought into TV by myself.
It will give you a quick Buy and Sell opportunity based on crypto price spikes.
If you want access to the tool feel free to send me a DM or contact me through twitter (@CryptoNTez)
Happy Trading!

Draculapresley's Daytrading Scalping STRAT O' DoomUsing some custom settings with a few indicators and a custom movement algorithm I have backtested this script and used it with great results. Excellent for getting in and out for quick scalping trades. The results are typically 1% + and sometimes even a great deal more. The indicator gives you buy and sell points and works great with 15 min candles though you can modify the inputs to work with any time frame. Use all 3 indicators for safest bets but most of the time just using the Stoch input with the movement algorithm almost always yields positive results with tons of buys. Works pretty well even in a downturn but absolutely kills in a bull market.
Check out the screenshots below.
imgur.com

OneX HiteshB Scalping Indicator 1.0Full Documentation:
This script uses the 10 and 20 period EMAs on the higher time frame to determine the trend and 14 period Stoch RSI from current time frame to determine entries in the direction of the trend.
Available Settings :
1. Turn On/Off Trend - This will show you the bearish trend in a red background and the bullish trend in a green background. Redundancy only, the indicator is already calculating trend without this setting.
2. Stoch RSI settings - These are set to default. The SRSI sensitivity is set to 15 for oversold and 85 for overbought, and this cannot be edited.
3. Target and Stop Loss offsets - You can modify this according to your Reward:Risk.
Known Issues:
-Old entries do not erase if the stop loss was hit
Pros:
1. Very useful in scalping in the direction of the trend
2. Can be used on ANY time frame, across ANY asset class (however I recommend using this between the 5 minute to 30 minute time frames for the most profitability, with the 15min being my personal favourite)
3. Current average profitability stands at roughly 65% across any mix of trends - this will be proven in the strategy to be released later this week)
Cons:
1. Unable to call any sort of trend reversal
2. Does not account for stop runs on lower time frames (1min-3min but I don't recommend using those time frames anyway)
Future Plans:
-Implementation of SRSI divergences
If you have any criticism or suggestions, please do comment below.
[BullTrading] 1 minute Easy Scalping Sys v3.0This is the third version of Bull Trading Easy Scalping Tool for 1 minute charts. This improved code filters trend direction and power to avoid some false entries on horizontal markets. Exits after profit are commonly taken when the price hits the ma's.
DISCLAIMER:
The Following indicator/code IS EXPERIMENTAL AND NOT intended to be a formal investment advice or recommendation by the author, nor should be construed as such. Users will be fully responsible by their use regarding their own trading vehicles/assets.

[BullTrading] Easy Scalping Sys v2.0This alert friendly indicator is designed as a scalping tool, it displays arrows for entries and color differentiation for exits. Play arround with Trend Length settings for signal sensibility. Comments for improving are very welcome.
DISCLAIMER:
The Following indicator/code IS EXPERIMENTAL AND NOT intended to be a formal investment advice or recommendation by the author, nor should be construed as such. Users will be fully responsible by their use regarding their own trading vehicles/assets.

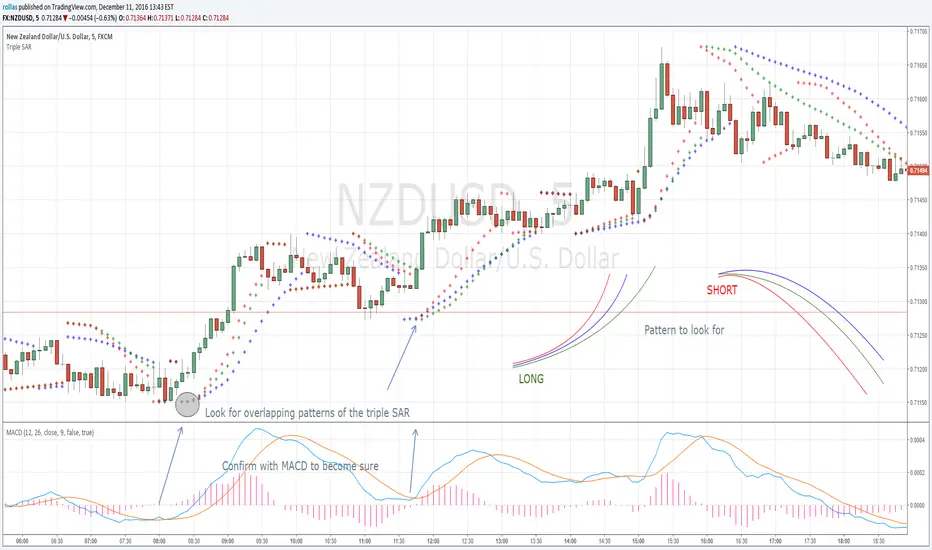
Triple SAR Scalping 5MTriple SAR scalping method must be used with a 5 minute chart. Look for the patterns that 3 bands overlap. Close deal within 4-5 pip profit or build your own style after getting comfortable with this technique and share your approach with us for maybe higher profits.
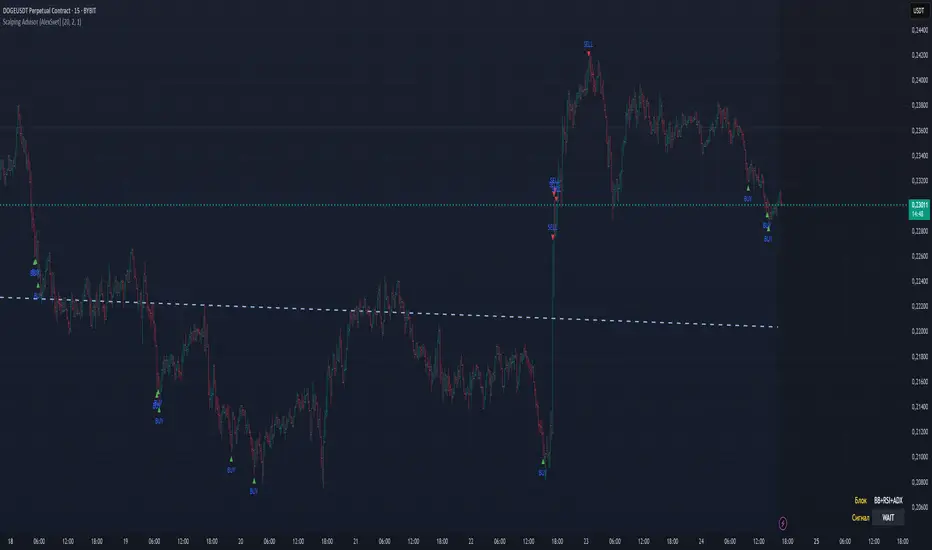
Scalping Advisor [AlexSvet]Scalping script. I added a dashboard table: it shows the BB+RSI+ADX block and the final signal (BUY, SELL, WAIT)
Scalping MarsuScalping Marsu
Trading using Tradingview. Build trading bots for bitcoin , altcoins, forex, stocks and more...
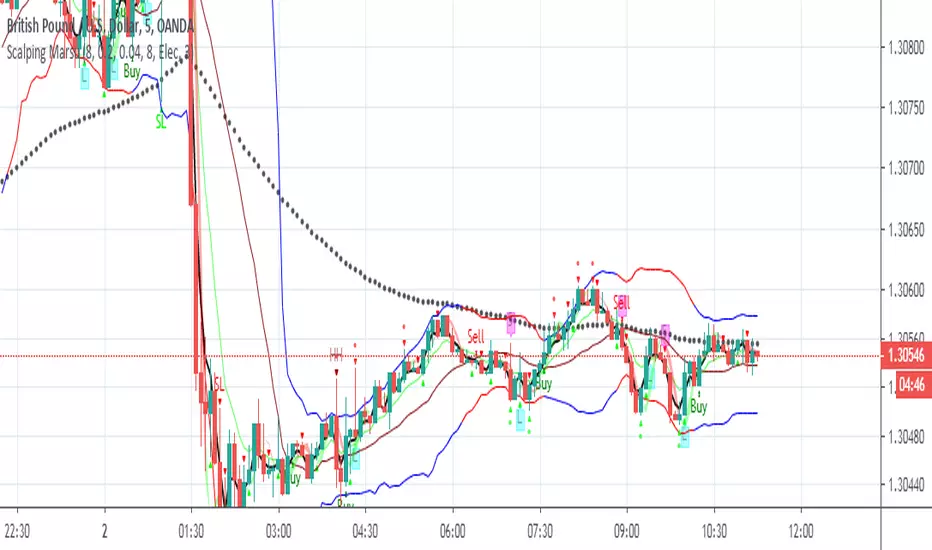
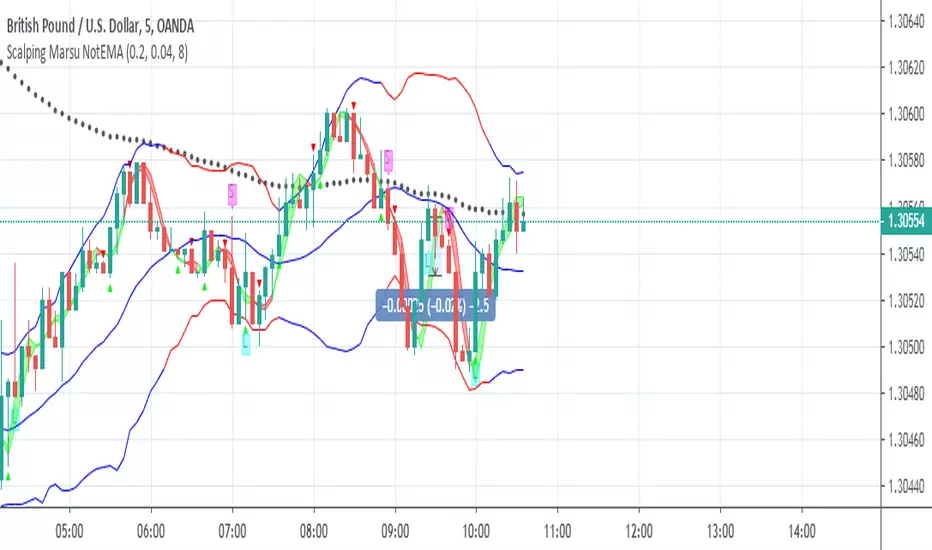
Scalping Marsu NotEMAScalping Marsu NotEMA
Trading using Tradingview. Build trading bots for bitcoin, altcoins, forex, stocks and more...
Scalping of Marsu PilamiScalping of Marsu Pilami
Trading using Tradingview. Build trading bots for bitcoin, altcoins, forex, stocks and more...


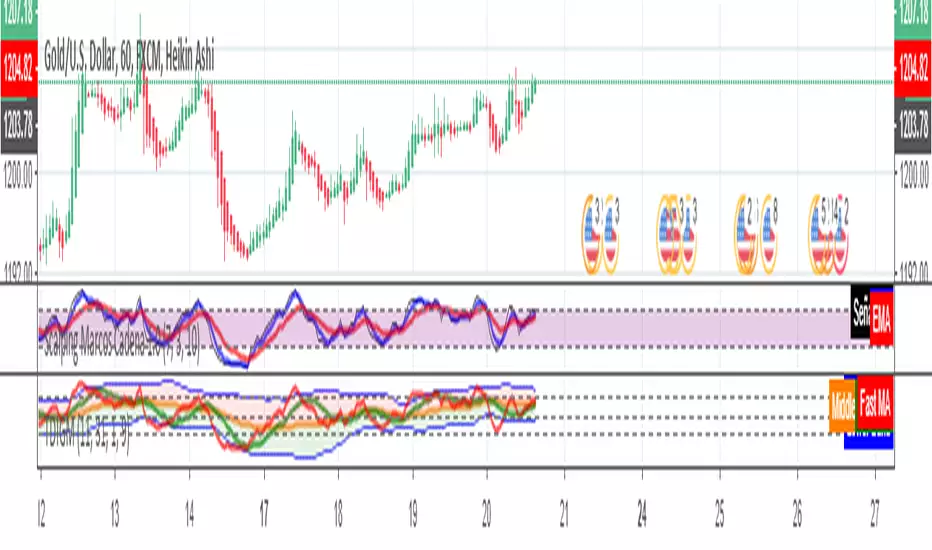
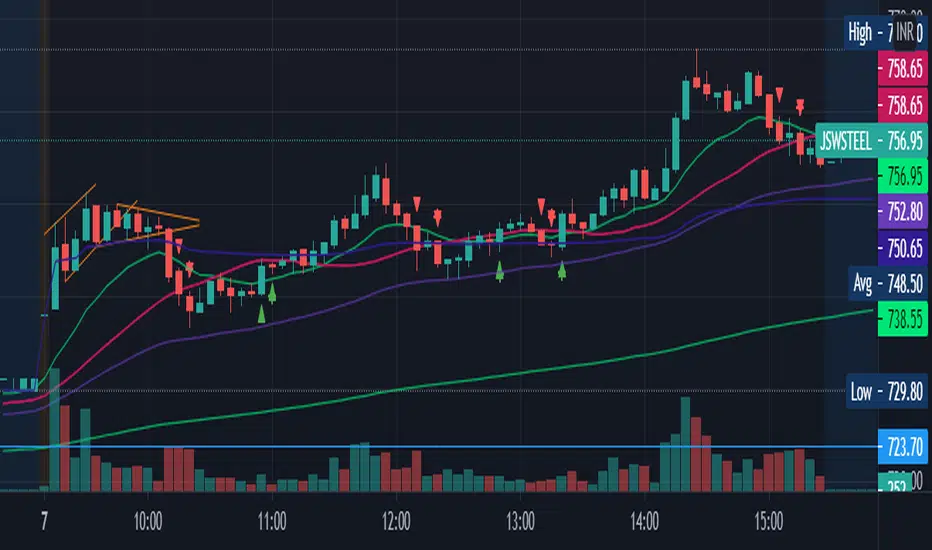
Scalping Marcos Cadena 1.0Scalping Marcos Cadena Crossing of moving averages together identifying within the RSI when it is overbought or oversold
scalping2sahilnarkarThis is the a bit edited to the previous script. As per regulations i have kept this as an open script.
The only Difference to confirm your support resistance levels is an addition of simple moving average 21.
Rules are the Same-
- Trade long when above vwap and 21EMA
- Trade Short when below the VWAP.
EMA21 and EMA50 acts as support where as SMA 21 will show the Trend.
Even though This script is purely based on EMA's, i tend to find the SMA21 as a good Support resistance/support while taking a trade as it avoids the wipsaws while taking an entry.
Please Note-
-This is a scalping Script so book profits and keep stoplosses accordingly.
-When you put this script on the screen, remove everything except EMA9,EMA21,EMA50,EMA200 and the SMA21(keep the arrows and edit the arrows as you want)
-This is not a plug and play script so tune it as you want on the settings.
-Please consider using a VWAP always.
-I have made this script after putting it into many indian stocks you have to tune it as per your stock exchange.
Trench Cross ScalperThe original script was posted on ProRealCode by user Nicolas.
This indicator is an attempt of scalping strategy by crossing the mean high or low weigthed price over a short "n" period. This 2 lines represent the black "trench" on screenshots attached.
When signal line (blue one) crossing the buy trigger one (dotted green one) a buy signal should occur and vice-versa for a sell signal (when crossing the dotted red one). I add an option to draw the white signal line as the close price value of the high/low ones if they are respectively above or below the trench' buy or sell lines trigger.
The yellow green and red brick lines serve as stoploss.
The indicator can be use alone with no price chart as its values are derivated from it, of course if you dont mind about candlesticks informations.
I think enter/exit trades should occur very quickly, as it were designed for scalping trading purpose. I didn't have much time to test it for a long period, so here it is as a concept indicator, despite that, it does have sense.


[SCALPING] L3 Banker Flow (1m Optimized)What’s improved for 1-min scalping:
Shorter lengths for trend and range detection (9, 5, 3, 2).
Faster EMA and weighted averages for quicker signal response.
Entry signal conditions are slightly relaxed (bull_bear_line < 30) for faster entry in micro-trends.
Maintains the same visuals: yellow/green/white/red/blue candles for easy reading.

ScalpingSystem 2.0 @MishuComplete scalping strategy with all related indicators.
1) Wait for an up/down-trend (10 EMA (Orange) crosses ABOVE/Below 20 EMA (Blue))
2) Wait for price to breakout then retest the EMA's (either one(based on the trend type))
3) Wait for bullish/bearish confirmation candle after the retest
4) Enter after the confirmation candle
5) Set a stop loss underneath the previous swing low (previous Zigzag point)
6) Take profit one the EMA's cross the other direction (10 EMA crosses BELOW/ABOVE 20 EMA)
Standart Strategy
with the second trend (higher TF)
zigzag included (@author=lucemanb)
if you have a number of signals you can filter the first signal